
0 ITEMS

The Top 5 Frameworks for Making Investment Decisions

In fast-changing markets, making quick, informed investment decisions is crucial to seize opportunities and avoid risks.
- Investment frameworks help evaluate options efficiently, balancing risks and returns without the need for perfect timing.
- Frameworks like IRR, MOIC, payback period, ROI, and cash-on-cash yield provide structured methods to analyze profitability and project viability.
- Each approach offers different insights, from measuring total value created to assessing liquidity and payback speed.
- Using these tools improves decision confidence and aligns investments with long-term financial goals.
- Understanding the strengths and limitations of each framework helps navigate complex market conditions more effectively.
Read on to identify the right decision-making tools for your investment strategy.
What are Frameworks for Making Investment Decisions?
Frameworks for making investment decisions are structured approaches that guide investors in evaluating options, managing risks, and making informed choices. They involve methodologies and analytical tools that help streamline the decision-making process. These frameworks allow investors to assess potential outcomes and systematically align investments with strategic objectives. By breaking down complex financial data and market dynamics into more manageable segments, this disciplined approach significantly enhances decision quality and reduces the likelihood of emotional biases impacting the investment strategy. The top 5 frameworks for making investment decisions provide a clear and focused path for investors. They encompass structured approaches that help investors assess various financial scenarios, decide on beneficial strategies, and ultimately achieve their financial objectives. These frameworks are theoretical constructs and practical tools that cut through the dense fog of potential investment opportunities, providing clarity and direction. A structured approach ensures that choices are made based on analysis and logic rather than impulse or speculation.
The major financial issues confronting management often revolve around making strategic decisions that aim to maximize shareholder value while ensuring financial stability. These decisions encompass a range of important considerations, including valuing assets or businesses, choosing between buying and selling, adopting a buy-and-hold strategy, and evaluating the potential return for spending money. Addressing these challenges effectively is key to aligning management actions with the overarching goal of sustaining long-term value creation for shareholders.
In financial modeling, choosing the right framework for decision-making is crucial to navigating complex business scenarios and making sound financial choices. Companies can better assess potential investments and strategize effectively with the appropriate decision-making framework. Our top 5 frameworks for making investment decisions are:
- Internal Rate of Return Analysis
- Multiple on Invested Capital
- Payback Period Analysis,
- Return on Investment Analysis
- Cash-on-Cash Yield Calculation
Each of these frameworks offers a unique perspective on evaluating the profitability and viability of an investment, empowering decision-makers with insights to foster smarter investment choices.

1. Internal Rate of Return Analysis
The Internal Rate of Return (IRR) is a key financial metric used to assess the potential profitability of an investment by calculating the rate at which the net present value (NPV) of future cash flows equals zero. In simple terms, IRR represents the break-even rate of return for an investment. If the IRR exceeds the required rate of return or the cost of capital, the investment is generally considered worthwhile. An Internal Rate of Return analysis is particularly helpful for comparing multiple investment opportunities, as it provides a uniform metric that can be easily compared across projects with different time horizons and cash flow patterns. IRR also considers the time value of money, making it a more comprehensive metric than some simpler methods, such as the payback period. It also helps evaluate an investment’s sensitivity to changes in key assumptions, such as projected cash flows or discount rates, giving investors a better understanding of the risks involved. This makes IRR a valuable tool for both corporate finance professionals and individual investors looking to make informed decisions in dynamic market conditions.
How to Calculate IRR
The Internal Rate of Return (IRR) is a financial metric used to evaluate the attractiveness of a potential investment. It represents the discount rate that makes the net present value (NPV) of all future cash flows from an investment equal to zero. Here are the steps to calculate IRR:
- Estimate Future Cash Flows: Identify all expected future cash inflows and outflows over the lifetime of the investment.
- Apply the Discount Rate: Calculate the project’s NPV using an estimated discount rate, typically the Weighted Average Cost of Capital (WACC).
- Iterate Until NPV Equals Zero: Adjust the discount rate iteratively until the calculated NPV is as close to zero as possible. At this point, the discount rate is the IRR.
- Compare IRR to Required Rate of Return: Before making an investment decision, compare the IRR to the company’s required rate of return (or cost of capital). If the IRR exceeds the required rate, the investment is generally considered favorable.

Sample IRR Calculation
An IRR Project Finance Analysis template provides a valuable framework for investment decisions by helping assess the potential profitability of a project and the cost of capital. When comparing the IRR to the project’s cost of financing or hurdle rate, investors can determine whether the anticipated returns justify the risks involved. A higher IRR relative to the hurdle rate signifies a potentially attractive opportunity, making IRR analysis crucial for evaluating different investment options, prioritizing projects, and deciding whether to pursue or reject a project.

The above image shows an internal rate of return analysis for Project Finance, including calculations for both Project IRR and Equity IRR. The project IRR is 12.1%, indicating the rate of return generated by the project’s free cash flows without considering financing costs. The equity IRR, which accounts for debt financing, is 21.6%, reflecting the return on equity for investors after debt servicing. The free cash flow to the firm (FCFF) and to equity (FCFE) are presented year by year, alongside a payback period calculation, which indicates that the investment will achieve positive cumulative cash flows in year 8. Based on the internal rate of return analysis, the equity IRR of 21.6% exceeds the project’s discount rate of 12%, suggesting that the investment is likely worth it, as the returns for investors are greater than the cost of capital.
Pros of IRR Analysis
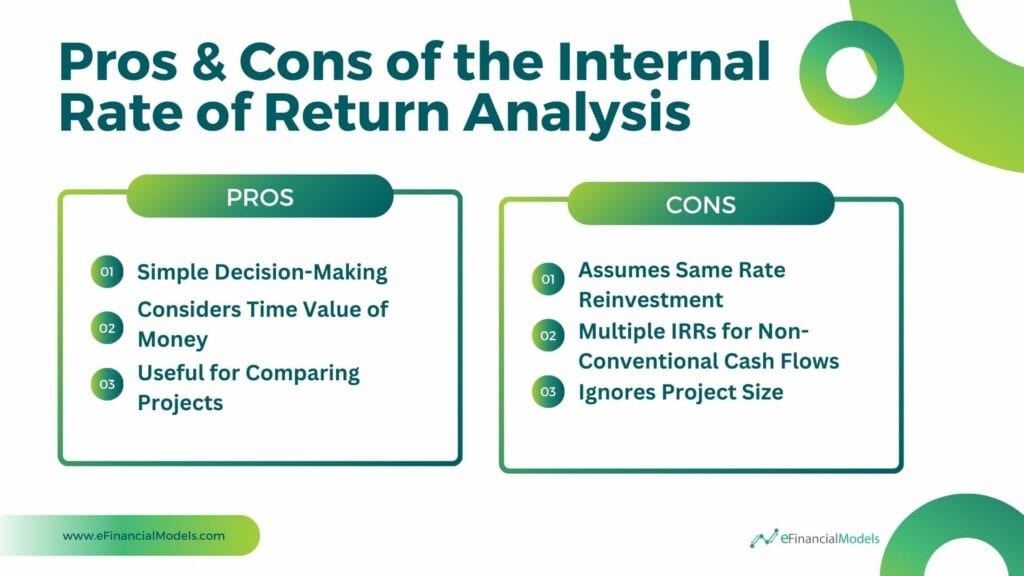
The Internal Rate of Return analysis has several key advantages. First, it provides a simple decision-making criterion: an investment is considered favorable if its IRR exceeds the required rate of return, allowing stakeholders to make quick judgments. Secondly, IRR incorporates the time value of money, which accounts for the timing of cash flows and provides a more accurate representation of an investment’s profitability compared to simpler metrics like the payback period. Additionally, IRR is particularly useful when comparing multiple projects, as it offers a consistent benchmark that helps in evaluating investment opportunities across different projects, regardless of their size or cash flow structures. These advantages make IRR a valuable tool for assessing and comparing the viability of investments.
Cons of IRR Analysis
While useful, the Internal Rate of Return analysis has several limitations. One major drawback is that it assumes all future cash flows can be reinvested at the same rate as the IRR, which may be unrealistic and can lead to overestimating the project’s profitability. Additionally, for projects with non-conventional cash flows—where cash flows alternate between positive and negative values—multiple IRRs can exist, making it difficult to interpret the results and complicate decision-making. Another limitation of IRR is that it ignores the investment size, which can lead to a preference for smaller projects with higher IRRs over larger projects that might generate more overall profit but have a lower IRR. It can result in inefficient resource allocation, as projects with higher returns in absolute terms may be overlooked.



















































2. Multiple on Invested Capital
The Multiple on Invested Capital (MOIC) is a financial metric used to evaluate the total return on an investment relative to the initial capital invested. Unlike other return metrics, such as the internal rate of return (IRR), MOIC measures how much value an investment has generated in proportion to the amount initially invested. This metric is particularly useful for assessing private equity, venture capital, and other investments where cash flows could be more predictable or where there may be a longer time horizon before returns are realized. MOIC offers a simple representation of value creation and is especially helpful when comparing different investments, as it ignores the complexities of timing and discount rates. Using MOIC as a framework for making investment decisions, investors can easily gauge potential returns in absolute terms, clarifying which opportunities may yield higher multiples of their capital. It is especially popular in early-stage investing, where large returns are targeted, even if they are achieved over an extended period.
How to Calculate the Multiple on Invested Capital
To calculate the Multiple on Invested Capital, you divide the total value of the investment (including both the value realized through cash distributions and the unrealized value of the remaining assets) by the initial capital invested. The formula is straightforward:

Where:
- Realized Value refers to the cash flows that have already been received from the investment. It includes proceeds from dividends, interest, or other distributions paid to the investor.
- Unrealized Value refers to the estimated value of the remaining assets that are still invested. It could be the current market value of a portfolio or any assets that have yet to be sold or liquidated.
- Initial Invested Capital is the original amount of money invested in the investment at the beginning. It is the base reference for comparing how much value has been created.
For example, if you invested $1 million in a private equity fund, received $500,000 in cash distributions, and the current unrealized value of the portfolio is $2.5 million, your MOIC would be calculated as follows:

This means that for every dollar you invested, you have generated $3 in value, combining both the cash flows you’ve received and the residual value left in the investment.
Pros of MOIC
Multiple on Invested Capital (MOIC) is a valuable framework for making investment decisions because it provides a clear and straightforward way to measure total return by comparing the current value of an investment to the initial capital invested. Unlike IRR, MOIC is not time-sensitive, which makes it ideal for comparing investments of different durations without the skew of time-based calculations. Additionally, MOIC is particularly useful for long-term investments, as it focuses on the overall value creation without being affected by interim cash flows, making it especially relevant in industries like private equity and venture capital.
Cons of MOIC
Multiple on Invested Capital (MOIC) has some limitations as an investment decision framework, primarily because it ignores the time value of money, treating a dollar earned today the same as one earned years later, distorting long-term evaluations. It also provides limited insight into interim cash flows, focusing solely on the total return and overlooking the importance of liquidity and performance during the investment period. Additionally, MOIC tends to overemphasize the outcome, downplaying the value of consistent or early gains that might be more favorable for certain investment strategies.

3. Payback Period Analysis
The payback period is a straightforward framework used to determine how long it will take for an investment to recover its initial cost. By calculating the period over which cumulative cash flows equal the initial outlay, this framework provides insight into the risk associated with an investment. Shorter payback periods are generally more attractive, as they imply faster recovery of invested capital and reduced exposure to uncertainties. While a payback period analysis does not consider cash flows beyond the break-even point or the time value of money, it remains a useful tool for quickly gauging an investment’s liquidity and risk. One of the advantages of a payback period analysis is its simplicity, as it is easy to calculate and understand, making it an appealing option for investors looking for a quick assessment of capital recovery. However, its limitations must also be recognized. By ignoring cash flows after the payback period, this method may undervalue investments that yield significant returns in the long term. Additionally, a payback period analysis needs to account for the time value of money, which can lead to less accurate assessments of an investment’s overall value. Despite these limitations, the payback period remains a valuable tool for preliminary screening, allowing investors to identify projects that warrant more in-depth analysis using other frameworks.
How to Perform a Payback Period Analysis
The payback period is a straightforward metric that helps investors determine how long it will take to recover an initial investment. The calculation involves a few simple steps:
- Identify Initial Investment: Determine the total cost of the investment.
- Estimate Annual Cash Inflows: Forecast the cash inflows generated by the investment each year.
- Calculate Payback Period: Divide the initial investment by the annual cash inflows if they are constant, or sum the yearly cash flows until they equal the initial investment if inflows vary.
The result represents the time it takes for the investment to “pay itself back,” providing a clear liquidity indicator.

Sample Payback Period Analysis
A Payback Period Calculator provides a simple yet effective framework for investment decisions by helping investors determine the time required to recover their initial investment. Calculating how long it takes for cumulative cash inflows to match the initial cost allows investors to assess the risk and liquidity of a project. A shorter payback period is often seen as favorable, as it suggests quicker recovery of funds, thereby reducing exposure to potential risks and uncertainties.
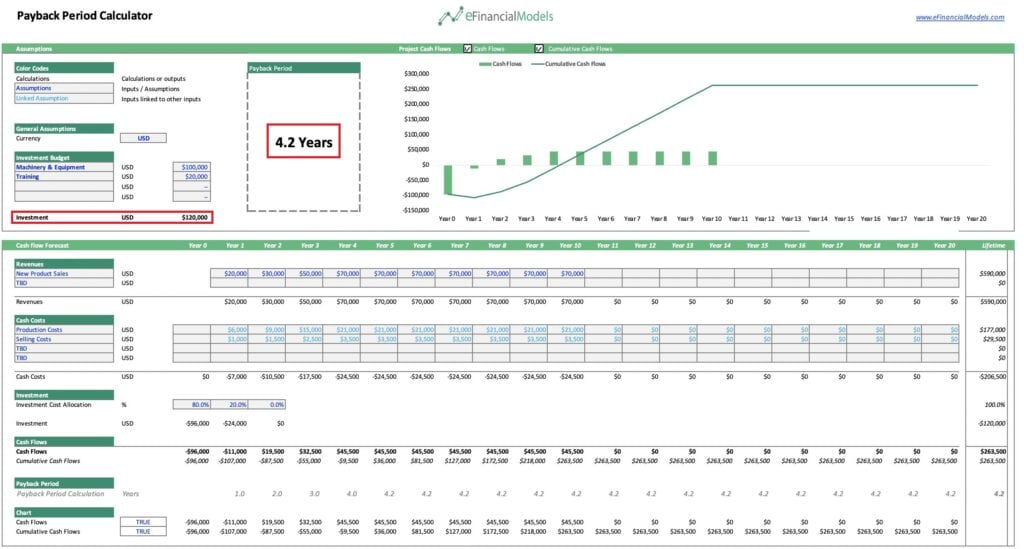
The Sample Payback Period Analysis determines if an investment is good by calculating the years required to recover the initial investment through projected cash flows. In this analysis, an initial investment of $120,000 is made, and cash inflows and outflows are forecasted annually. The payback period is calculated by tracking the cumulative cash flows to identify when they become positive, indicating that the investment has been recovered. The analysis shows a payback period of 4.2 years, meaning it will take just over four years to recoup the initial cost. If this period meets or is shorter than the company’s acceptable timeline for investment recovery, the project is deemed a good investment. However, a payback period analysis only considers cash recovery rather than factors like long-term profitability or time value of money, making it useful but limited for comprehensive decision-making.
Pros of Payback Period
The payback period analysis offers a straightforward and practical method for evaluating investments, making it particularly attractive for businesses and individuals who prefer simplicity over more intricate financial models. Its ease of use stems from its basic focus on calculating the time required to recover the initial investment cost without delving into complex metrics like net present value or internal rate of return. Moreover, the payback period provides valuable insight into liquidity risk, as it effectively indicates how long it takes for the cash outflow of an investment to be recovered, thereby reducing the uncertainty surrounding the investment. This emphasis on liquidity is particularly appealing to risk-averse investors who prioritize minimizing exposure to prolonged capital risks. Additionally, the payback period’s focus on shorter-term returns aligns well with companies that must maintain a steady cash flow, highlighting projects likely to yield rapid returns. Such a focus can be advantageous for businesses operating in uncertain markets or industries with rapid technological change, where recovering invested funds quickly is crucial to reduce risk and maintain operational agility. Although the method does not factor in the profitability of the entire investment lifespan, its ability to emphasize quick payback is often beneficial for maintaining a stable financial position, especially when dealing with constrained resources or when funding multiple projects concurrently.
Cons of Payback Period
While simple and useful for quick assessments, the payback period analysis has significant drawbacks that can make it unreliable as a comprehensive investment appraisal tool. One major area for improvement is that it needs to include the time value of money. This oversight can lead investors to make misguided decisions, particularly when comparing projects of varying durations since it doesn’t adjust because cash received sooner has greater value. Moreover, the payback method provides no insight into a project’s long-term profitability or potential; it focuses solely on how long it takes to recoup the initial investment, without considering the cash flows that may be generated after that point. As a result, projects that generate substantial profits after the payback period need to be adequately assessed, potentially leading to a bias towards short-term gains over long-term profitability. Additionally, the payback period fails to measure an investment’s overall profitability or return, offering no concrete metric such as rate of return or net profit margin. This lack of an explicit profitability measure means that relying solely on payback period analysis can result in poor decision-making, particularly if it leads investors to prioritize fast recoveries over better long-term value.


4. Return On Investment Analysis
Return on Investment (ROI) is one of the most well-known and straightforward frameworks for evaluating the profitability of an investment. ROI is calculated by dividing the net profit from an investment by the initial cost and multiplying by 100 to express it as a percentage. This metric is ideal for assessing short-term and long-term investments and allows for easy comparisons between various investment opportunities. A return on investment analysis helps investors make informed decisions by providing a clear picture of the potential gains relative to the cost involved. One of the major advantages of a return on investment analysis is its simplicity, which makes it accessible to a wide range of investors, from beginners to experienced professionals. Additionally, a return on investment analysis can be applied across different asset classes, allowing for a versatile comparison of potential returns in various sectors, including real estate, equities, and private business ventures. However, it is important to note that ROI does not account for the time value of money or the risk associated with an investment, which can limit its usefulness in more complex decision-making scenarios. For a more thorough analysis, investors often pair ROI with other metrics to gain a deeper understanding of their investments’ profitability and risk profile.
How to Perform an ROI Analysis
Return on Investment analysis is a straightforward financial metric used to evaluate the efficiency or profitability of an investment. The process involves a few key steps:
- Determine Initial Investment: Identify all costs associated with the investment, including direct and indirect costs.
- Estimate Net Returns: Calculate the expected financial gains from the investment, such as profits, savings, or increased revenue.
- Apply the Formula: The ROI formula is (Net Return / Initial Investment) x 100. This calculation provides a percentage that represents how much return you can expect relative to the amount invested.
- Compare to Benchmarks: To assess whether this investment is worthwhile, use the ROI percentage to compare against benchmarks, alternative investments, or your required rate of return.

Sample Return on Investment Analysis
A return on investment (ROI) analysis on a Bike Rental Business Financial Model is a critical framework for making informed investment decisions by quantifying the potential gains against costs. Through a detailed assessment of projected revenues, operating expenses, and capital expenditures, this analysis provides investors with a clear understanding of how quickly they can expect to recoup their initial investment and what profits lie beyond that point. It allows stakeholders to gauge profitability, identify key performance indicators (KPIs), and evaluate the effectiveness of their strategic choices, such as pricing adjustments, expansion, or marketing initiatives.
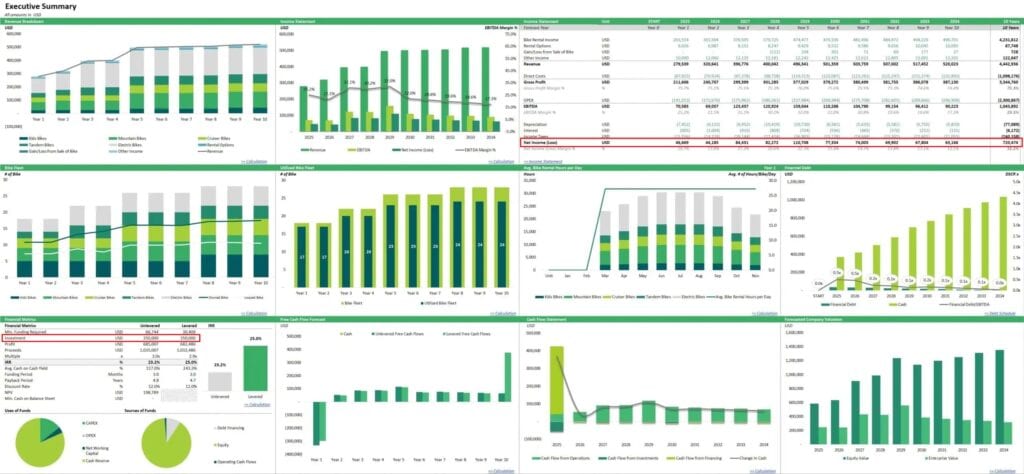
The sample return on investment (ROI) analysis on the Bike Rental Business Financial Model compares the initial investment and net income over ten years. The model shows a minimum funding requirement of approximately $390,000 while projecting significant growth in net income from the early stages of operation to year 10, resulting in a cumulative net income of over $720,000. The income statement demonstrates a consistent rise in revenue and EBITDA margins, indicating operational efficiency improvements over time. The model also depicts how leveraging the investment enhances the potential returns, with an internal rate of return (IRR) of 23.2% under a leveraged scenario. Given the growth trends, the positive free cash flow, and the steady increase in profitability metrics, the sample suggests a viable investment opportunity with an appealing return for investors considering the projected financial performance and cash flow stability over time.
Pros of ROI Analysis
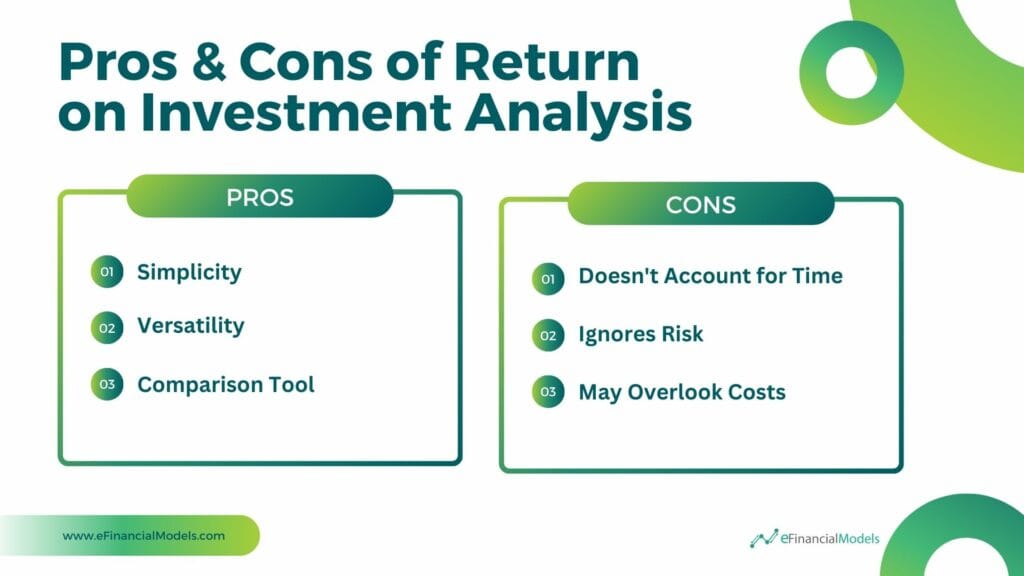
ROI analysis offers several key advantages. Its simplicity makes it easy to calculate and understand, even for those without extensive financial expertise, providing a straightforward snapshot of an investment’s potential return. ROI is versatile and applicable across various investment types, from real estate to marketing campaigns, making it broadly useful in different contexts. Additionally, a return on investment analysis is an effective comparison tool, enabling investors to evaluate multiple opportunities side-by-side to identify the highest return potential, supporting more informed decision-making.
Cons of ROI Analysis
ROI analysis has several limitations that can lead to misleading conclusions. One major drawback is that it doesn’t account for the time required to achieve the return—an investment that takes five years to provide a return could appear equally attractive as one that takes six months, potentially obscuring the value of time efficiency. Additionally, ROI ignores the risk involved, offering no insight into the varying risk profiles of investments that may otherwise show similar ROI figures. Finally, ROI can overlook important costs, such as ongoing maintenance or opportunity costs, which can result in an inaccurate representation of an investment’s true profitability.




































5. Cash-On-Cash Yield Calculation
Cash-on-Cash Yield, also known as the Cash-on-Cash Return, is a metric that measures the annual cash return on the amount of capital invested in a project. This framework is particularly popular in real estate and private equity investments, as it helps investors understand how much actual cash return they are earning relative to their invested capital. A Cash-on-Cash Yield calculation is a great tool for evaluating the ongoing performance of an investment, especially when the focus is on annual income generation. It is a simple and effective way to compare investments with different leverage structures or financing arrangements. Unlike other metrics that may incorporate factors such as appreciation or depreciation in asset value, a Cash-on-Cash Yield calculation focuses solely on the cash returns generated, making it a straightforward measure of cash profitability. This framework is particularly useful for investors who prioritize steady cash flow, as it clearly shows how efficiently their capital is being utilized to generate income. Additionally, Cash-on-Cash Yield calculation is highly effective for comparing similar investments with different financing structures, such as varying levels of debt or equity contributions, as it isolates the cash return element from the overall capital structure.
Steps to Calculate Cash-on-Cash Yield
- Determine Initial Cash Investment: Calculate the total cash invested in the property. It includes the down payment, closing costs, and any immediate expenses needed to prepare the property for rental.
- Calculate Annual Pre-Tax Cash Flow: Subtract annual expenses (property management fees, maintenance, insurance, and taxes) from the gross rental income to determine the annual net cash flow. It is before tax considerations.
- Divide Cash Flow by Initial Investment: Divide the annual pre-tax cash flow by the initial cash investment to find the cash-on-cash yield. Express this value as a percentage.

Sample Cash-on-Cash Yield Calculation
The Cash-on-Cash Yield calculation in a Cider Distillery Financial Model allows investors to evaluate the profitability of initial cash investment quickly. This metric measures the return on invested capital by comparing the annual cash flow generated by the distillery to the original cash invested, offering a straightforward perspective on the potential yield. With a cider distillery, which often involves significant upfront costs for equipment, production, and distribution, this calculation helps stakeholders gauge how effectively their money works.

The Cash-on-Cash Yield percentages for different years, shown in the “Max Cash-on-Cash Yield” row, indicate how effectively the business generates cash flow relative to the amount invested. For example, the model’s yield starts from relatively low values in the initial years (as the business incurs startup costs and requires time to stabilize). Still, the metric gradually improves over time, showing an increase in cash returns. This improvement in Cash-on-Cash Yield indicates growing profitability and suggests that the business is starting to achieve economies of scale and efficient cash flow management. The positive cash flow, combined with higher yields in the later years, provides a clear signal that the business is moving towards a sustainable and profitable operation, making the investment worthwhile.
Pros of Cash-on-Cash Yield
The cash-on-cash yield is a popular metric for evaluating real estate and other cash flow-generating investments due to its simplicity and practical focus. It is easy to calculate, which makes it accessible for investors to quickly compare multiple investment opportunities and assess profitability without complicated financial analysis. Since it centers on actual cash flow, cash-on-cash yield provides insights particularly valuable to those focused on income generation, such as investors needing steady cash flow for living expenses or reinvestment. Additionally, it measures the rate of return on the initial cash investment, offering a clear view of how well an investment is performing relative to the capital put in, making it an effective tool for understanding the immediate returns generated.
Cons of Cash-on-Cash Yield
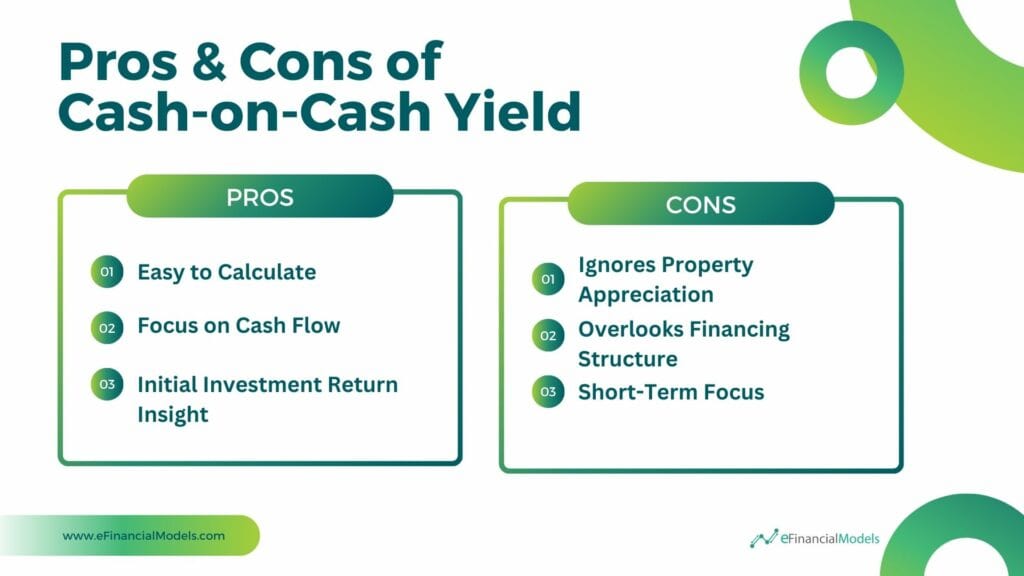
The cash-on-cash yield, while useful, has several limitations that can affect the overall evaluation of an investment. It ignores property appreciation, which is a key factor in assessing the long-term profitability of real estate, thus giving a limited view of potential gains. Additionally, cash-on-cash yield overlooks the effects of different financing structures, as it focuses solely on the initial cash investment and cash flow, potentially neglecting the impact of debt and financing costs that could significantly alter the returns. Its short-term focus also means it doesn’t capture the broader investment timeline, such as future appreciation, refinancing opportunities, or variations in rental income, which could result in investors being overly influenced by initial cash flow while missing important aspects of long-term financial viability.
Master Investment Decisions with Financial Modeling Scenarios
Making investment decisions can be complex, but with the right frameworks, evaluating potential opportunities becomes more structured and efficient, whether you’re analyzing the recovery time of your capital, assessing a company’s intrinsic value, or comparing cash flow projections; these five frameworks can offer invaluable insights.

By mastering these tools, investors can make more confident decisions that align with their financial goals, ensuring that each investment contributes meaningfully to their wealth-building journey. Mastering investment decisions requires a robust financial model that evaluates multiple scenarios to guide you effectively. Creating diverse financial scenarios allows you to understand how market conditions, interest rates, and business performance affect your investment options. Each scenario helps you compare different decision criteria—such as net present value (NPV), internal rate of return (IRR), payback period, and profitability index—to identify the most relevant criteria for your specific situation. The power of financial modeling lies in its ability to clarify complex decisions, enabling investors to make choices that align with their risk appetite and long-term financial goals.



























You might also like:
- 10 Tips to Develop a First Class Business Valuation Report
- 10 Main Elements of a Business Plan
- Do You Need an Investment Proposal Template in Excel?
- How to Build a Capitalization Table
- Financial Modeling for Startups and Small Businesses
- Exploring the Benefits of a Rental Property Excel Spreadsheet
- 5 Practical Tips to Help Raise Funds For Startups
- Valuation Services
- Cash Flow Analysis in Excel
- Financial Statements – Definition, Uses, Contents and Templates
- Top 5 Risks of Wind Energy Parks
- How to Evaluate a New Solar Park for Investment?
- Commercial Real Estate Valuation Methods: Helping Investors in Taking Informed Decisions
- Mastering the Art of IRR Calculation: A Comprehensive Guide for Investors
- Financial Modelling PDF Examples
- Building a Monthly Budget – Using Monthly Budget Templates
- 10-Step Financial Planning Checklist for Smart Executives
- 7 Key Tips: How to Best Work With a Financial Model Template
- Steps to Building Financial Models in Excel
- Investor Presentations