
0 ITEMS

Financial Model PDF Examples: DCF, IRR & More
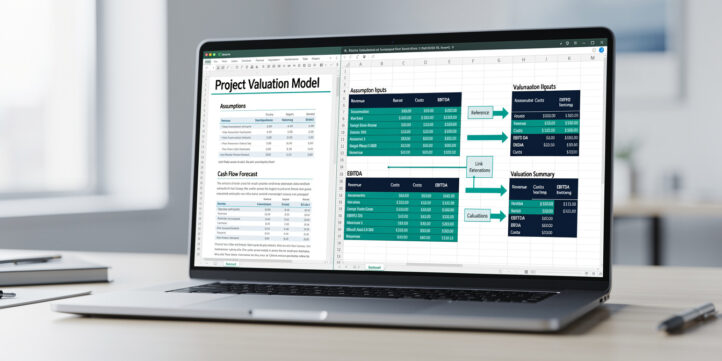
These free financial model PDF examples walk you through complete modeling workflows, from raw assumptions to valuation outputs, so you can learn the methodology, not just copy a spreadsheet.
Key Takeaways
- 5 free PDF financial model examples cover restaurants, manufacturing, gold mining, hotels, and private schools, each with annotated methodology.
- A DCF model (discounted cash flow) for a restaurant requires at least 6 core assumption inputs: revenue per cover, seat count, occupancy rate, EBITDA margin, WACC, and terminal growth rate.
- Gold mine project finance models produce 2 distinct IRR outputs: project IRR (pre-financing) and equity IRR (post-debt service), which typically differ by 3-8 percentage points.
- Manufacturing financial models track 4 key operating drivers: production capacity utilization, inventory turnover, fixed vs. variable cost split, and COGS as a percentage of revenue.
- PDF format adds learning value that Excel alone cannot: formula logic is annotated, assumptions are labeled, and the output flow is visible without needing to open cells.
- Beginners should start with the restaurant DCF or hotel valuation model; advanced users gain more from the gold mine project finance or manufacturing operating model.
- Every model in this library pairs a downloadable PDF walkthrough with a working Excel file so you can study the logic and then apply it immediately.
What Financial Model PDF Examples Contain
A financial model PDF example is a static, annotated snapshot of a working Excel model that shows every section, formula rationale, and output in a readable, shareable format. Unlike opening a raw Excel file, the PDF lets you study the architecture first: you see how assumptions flow into calculations, how calculations feed output schedules, and how outputs connect to a valuation summary, all without accidentally overwriting a formula.
A well-structured financial model PDF typically contains 5 core sections:
- Assumptions page: All input variables labeled with units, sources, and sensitivity ranges.
- Revenue and cost build: Line-by-line calculation of revenue drivers and operating expenses.
- Three-statement model: Integrated income statement, balance sheet, and cash flow statement. You can explore three-statement model templates to see how these link together.
- Output schedules: Free cash flow bridge, debt schedule, working capital schedule.
- Valuation summary: DCF output, IRR table, or comparable company analysis, depending on the model type.
The Association for Financial Professionals notes that structured documentation of model assumptions is one of the most cited gaps in analyst-built models, which is exactly what the PDF format forces you to address. According to the CFA Institute, financial modeling competency is now a core requirement in Level 1 and Level 2 curriculum, reflecting how central these skills are to the profession.
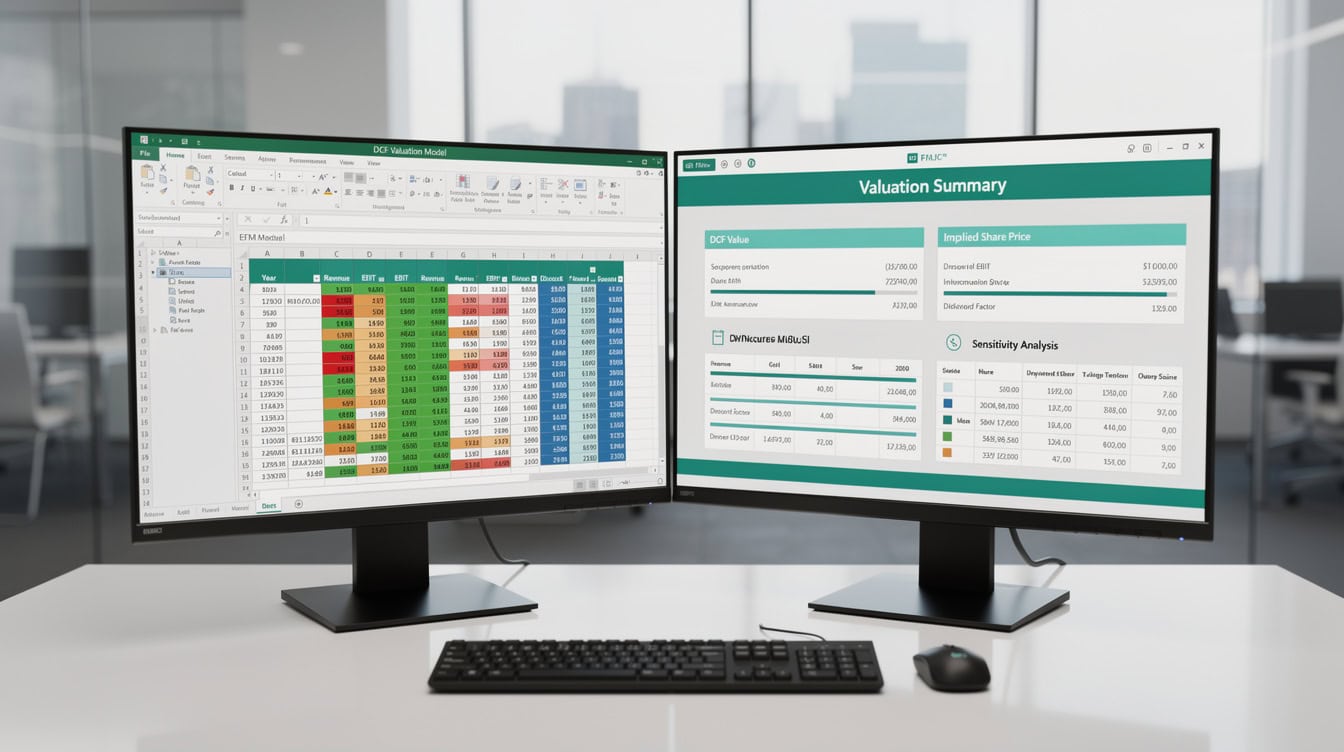
Every PDF example in this library follows this 5-section architecture, from assumptions through to valuation output.
Restaurant Valuation Model: DCF Methodology Walkthrough
The restaurant DCF model values a single restaurant by forecasting its free cash flows over a 5-to-10-year period and discounting them back to today using a weighted average cost of capital (WACC). WACC is the blended required return across all capital sources: equity investors expect a higher return than debt holders, so WACC weights each by its share of total capital.
Here’s the math for a simplified restaurant DCF:
Assumptions used in this example:
- Annual revenue: $1,200,000
- EBITDA margin: 18% (industry midpoint for full-service restaurants, per the National Restaurant Association)
- EBITDA: $216,000
- Depreciation: $40,000
- Capital expenditure: $55,000
- Change in working capital: $8,000
- Free cash flow (Year 1): $216,000 – $40,000 tax-adjusted EBIT adjustment – $55,000 capex – $8,000 = approximately $113,000
- WACC: 10%
- Terminal growth rate: 2%
- Terminal value: FCF Year 5 / (WACC – g) = $130,000 / (0.10 – 0.02) = $1,625,000
- PV of terminal value: $1,625,000 / (1.10)^5 = $1,009,000
The PDF walkthrough annotates each of these steps, showing which cell references feed which formula. That annotation is what makes the PDF format genuinely educational rather than just a screenshot.
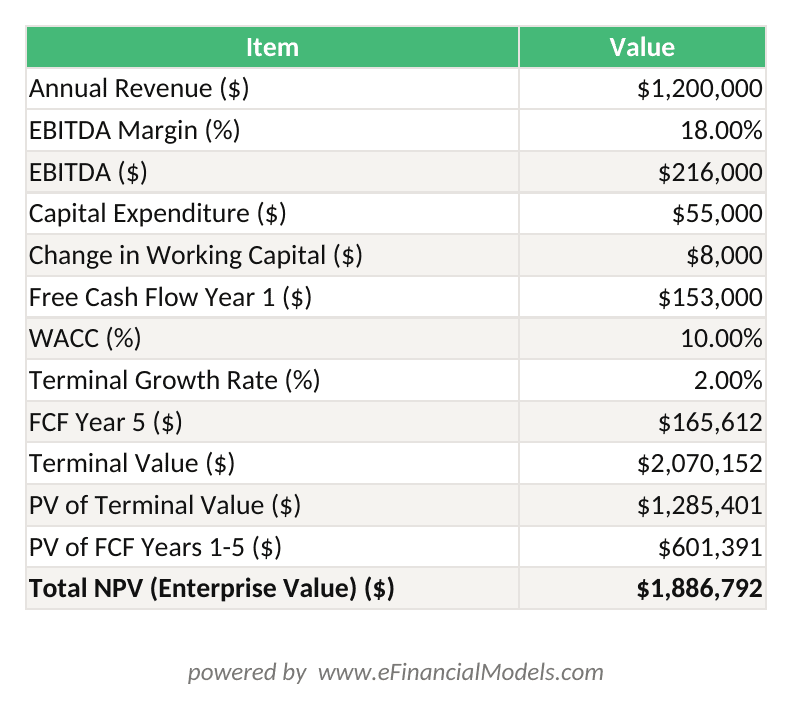
Restaurant DCF: Annual revenue of $1,200,000 at 18% EBITDA margin, discounted at 10% WACC with 2% terminal growth, yields an NPV of approximately $1,122,000.
The restaurant model PDF also covers revenue drivers in detail: covers per day, average spend per cover, and occupancy rate by day-part. These three inputs alone determine 80% of revenue variance in a restaurant model, so the PDF dedicates a full page to stress-testing them. Excel’s NPV function, which is used throughout this model, requires a fixed discount rate and discounts cash flows beginning from period 1 rather than period 0 (Microsoft), so the initial investment must always be added separately outside the function.
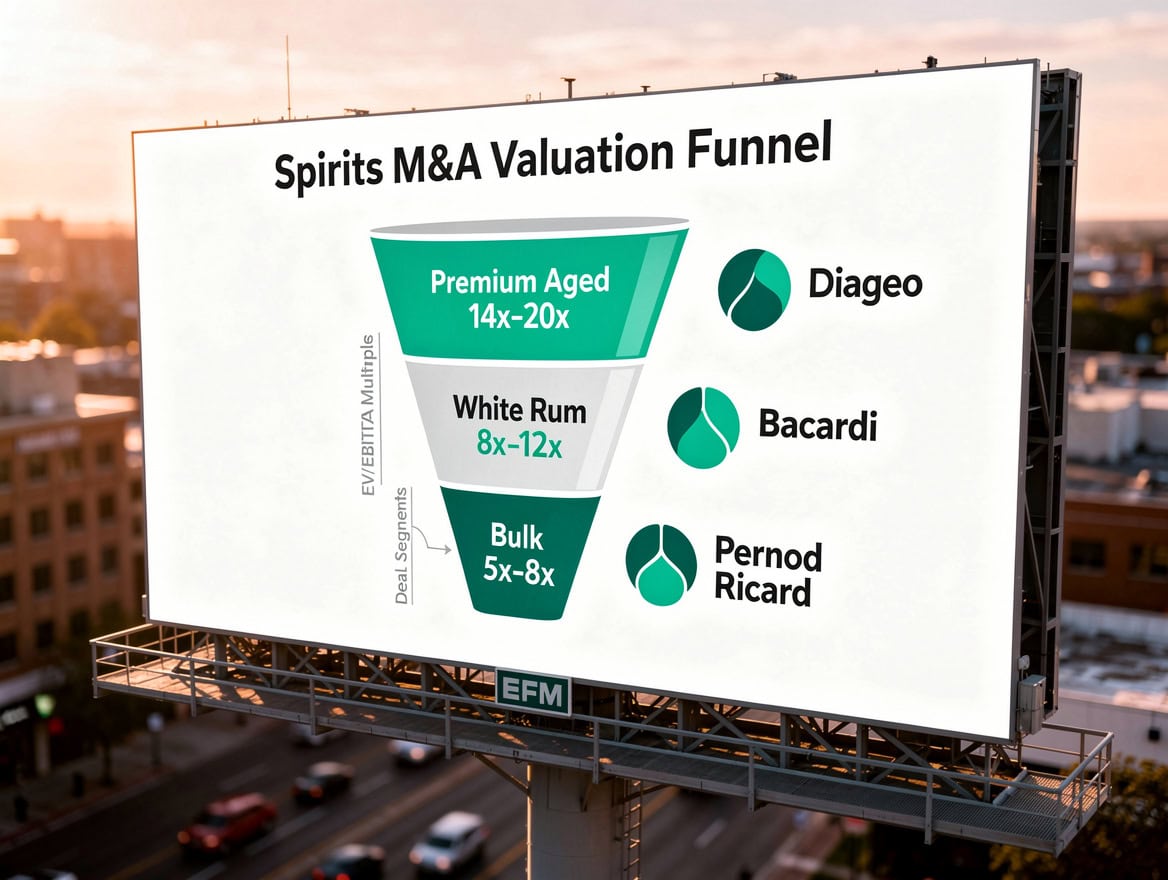
Revenue per cover, occupancy rate, and EBITDA margin drive 80% of variance in a restaurant DCF model.
Manufacturing Company Financial Model: Operating Forecast Structure
The manufacturing model builds a bottom-up operating forecast, meaning it starts with production capacity and works forward to revenue, rather than starting with a top-line revenue assumption. This approach is more accurate for capital-intensive businesses where output is physically constrained.
The 4 key drivers the PDF example tracks are:
- Capacity utilization rate: The percentage of total production capacity actually used. A typical manufacturing plant runs at 75-85% utilization according to the Federal Reserve’s Industrial Production and Capacity Utilization report (Federal Reserve).
- Inventory turnover: How many times inventory cycles through in a year. Higher turnover reduces working capital needs.
- Fixed vs. variable cost split: Fixed costs (rent, depreciation, salaried labor) don’t change with volume; variable costs (raw materials, hourly labor, utilities) do. The PDF shows how to model each separately so margin behavior at different volumes is transparent.
- COGS as a percentage of revenue: The model benchmarks this against industry data and flags when the assumption drifts outside a plausible range.
The financial projections templates library includes manufacturing-specific variants that extend this structure to 5-year and 10-year horizons.
Gold Mine Project Finance Model: IRR Calculation Framework
The gold mine model uses a project finance structure, which means it models the project’s cash flows independently of the sponsoring company’s balance sheet. This is the standard approach for large capital projects in mining, energy, and infrastructure.
The model produces two IRR outputs. IRR (internal rate of return) is the discount rate at which the net present value of all cash flows equals zero. A higher IRR means a more attractive investment relative to its cost of capital. Excel’s IRR function assumes cash flows occur at regular intervals and requires at least one positive and one negative value in the range (Microsoft), which is why the gold mine model always includes the upfront capital outlay as a negative cash flow in Year 0.
- Project IRR: Calculated on total project cash flows before any debt service. This measures the return on the total capital invested (equity plus debt).
- Equity IRR: Calculated on equity cash flows only, after debt repayment and interest. Because debt is cheaper than equity and amplifies returns, equity IRR is typically 3-8 percentage points higher than project IRR when leverage is used.
The PDF example walks through the production ramp-up curve: ore volumes processed in Year 1 are typically 40-60% of steady-state capacity as the mine reaches full operation. The model then layers in gold price scenarios (base, upside, downside) and shows how each scenario shifts both IRR figures.
Capex phasing is also annotated: pre-production capital (mine development, processing plant construction) is front-loaded in Years 1-3, which is why IRR is highly sensitive to construction cost overruns. The PDF flags this with a sensitivity table showing IRR at capex variances of -20%, base, and +20%.
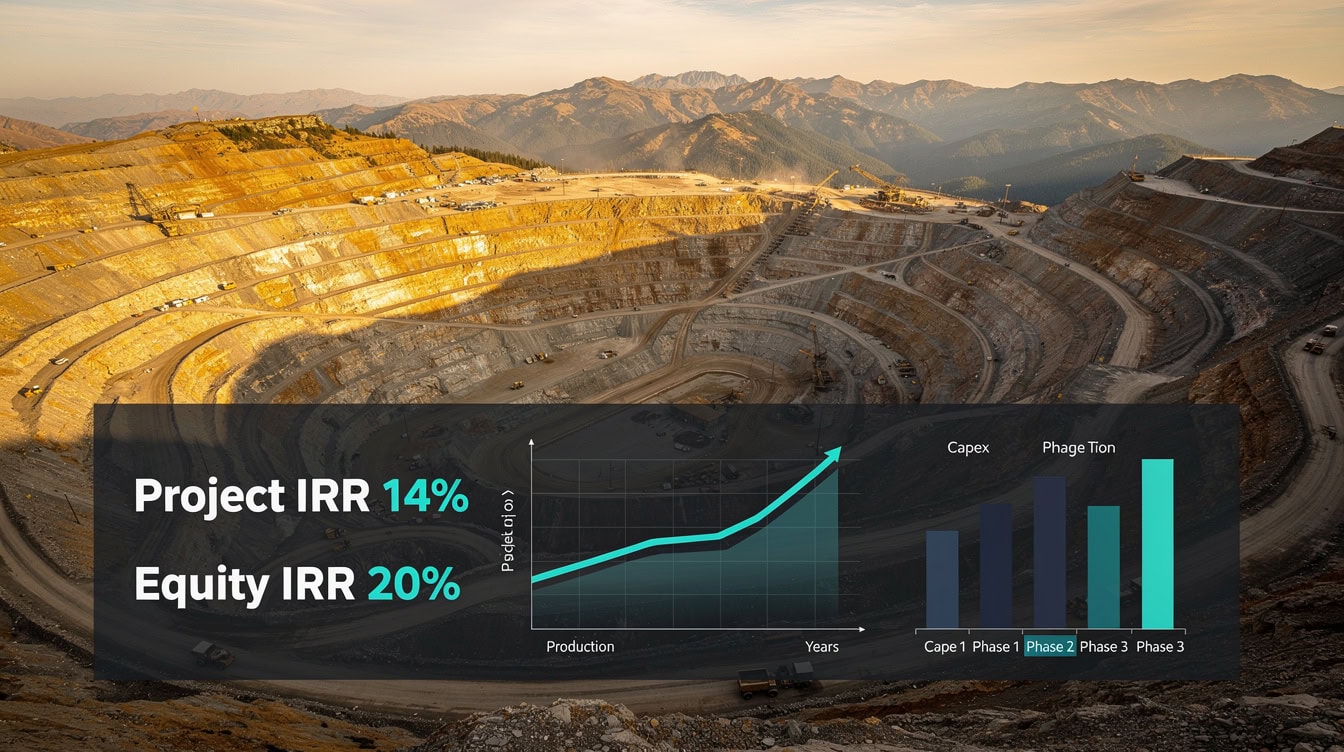
Equity IRR exceeds project IRR by 3-8 percentage points when leverage amplifies returns to equity holders.
How to Use These PDF Examples to Build Your Own Models
The most effective way to use a financial model PDF example is as a reference document alongside the working Excel file, not as a replacement for it. Read the PDF first to understand the architecture, then open the Excel file to examine the actual formulas.
Follow this 5-step workflow:
- Read the assumptions page in the PDF: Identify every input variable and understand what it represents before touching the Excel file.
- Trace the calculation flow: Follow how one assumption (say, revenue per unit) flows through to EBITDA, then to free cash flow, then to NPV. The PDF makes this flow visible; the Excel file lets you verify it.
- Rebuild one section from scratch: Pick the revenue build or the DCF output and recreate it in a blank Excel sheet using only the PDF as your guide. This is the fastest way to internalize the methodology.
- Swap in your own assumptions: Replace the example inputs with real data from your business or target company. Keep the formula structure intact.
- Stress-test with scenarios: Use the sensitivity tables shown in the PDF as a template for your own scenario analysis. The financial analysis templates library includes pre-built scenario frameworks you can attach to any model.
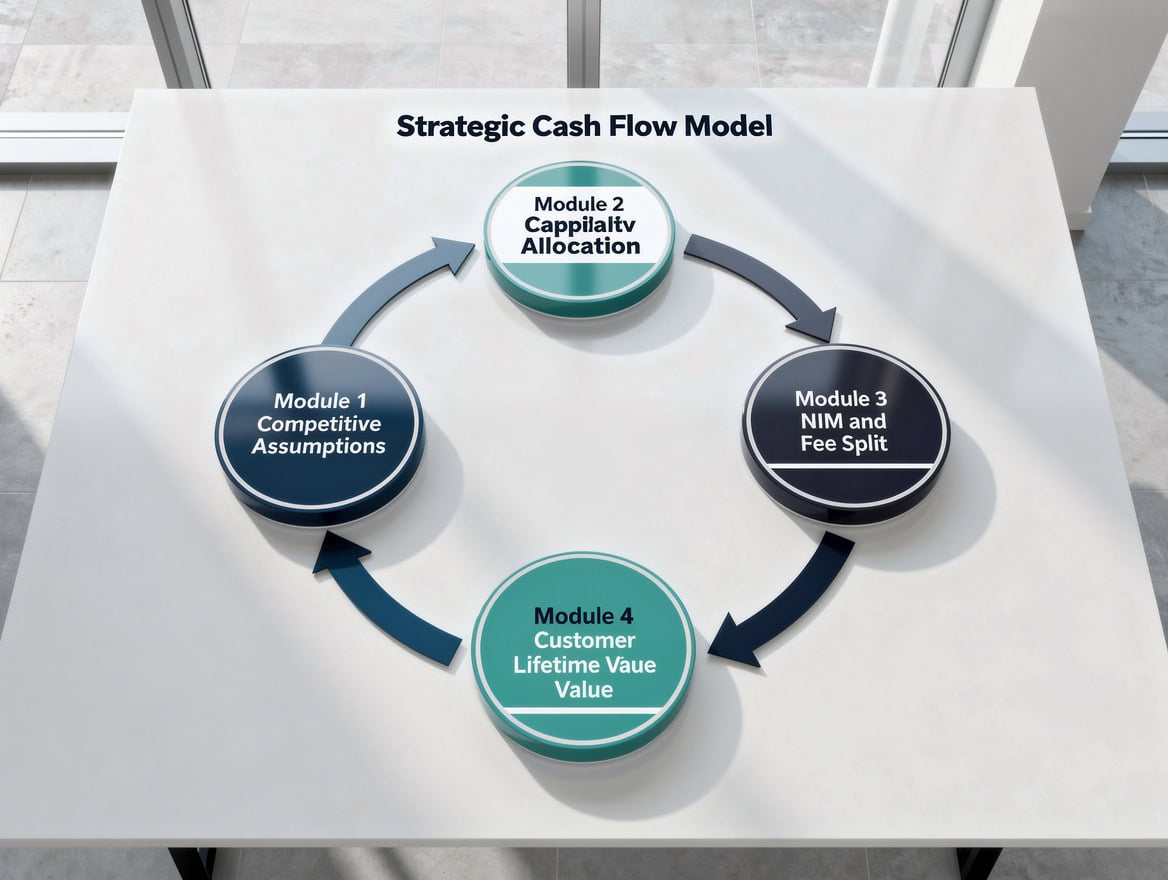
Rebuilding one section from scratch using only the PDF as a guide is the fastest way to internalize modeling methodology.
Model Type Comparison: When to Use Each Approach
Choosing the right model type before you build saves hours of rework. The table below maps each PDF example to its primary use case, complexity level, and the key output metric.
| Model | Use Case | Complexity | Key Output |
|---|---|---|---|
| Restaurant DCF | Acquisition, valuation | Beginner | NPV, implied multiple |
| Manufacturing Forecast | Budgeting, planning | Intermediate | EBITDA, FCF |
| Gold Mine Project Finance | Investment decision | Advanced | Project IRR, Equity IRR |
| Hotel DCF | Acquisition, refinancing | Intermediate | NPV, cap rate |
| Private School Startup | Feasibility, fundraising | Beginner | Breakeven, FCF |
Beginners should start with the restaurant or private school model: both have straightforward revenue drivers and a single valuation output. The gold mine model is best tackled after you’re comfortable with multi-year cash flow modeling and understand how debt schedules interact with equity returns.
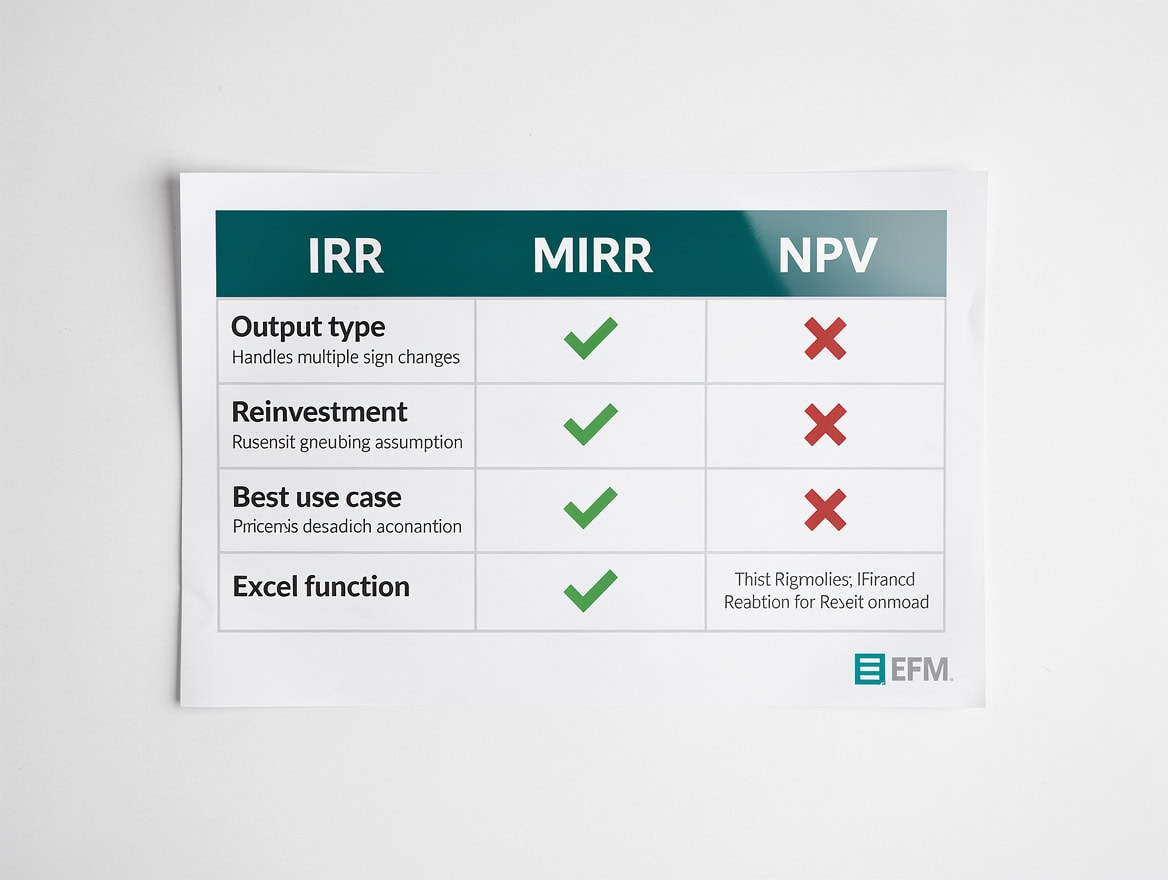
Matching model type to business decision before you build saves hours of rework.
Best Practices Illustrated in These Financial Modeling Examples
Every PDF example in this library demonstrates 6 modeling best practices that professional analysts apply consistently.
1. Assumption transparency: Every input has a label, a unit, and a source note. You never see a hardcoded number inside a formula without an explanation.
2. Formula consistency: The same formula structure repeats across rows. If Year 1 revenue uses =Units*Price, then Years 2-5 use the same structure, not a different approach. According to the Financial Modeling Institute, formula inconsistency is the leading cause of model errors in analyst-built files.
3. Separation of inputs and calculations: Assumptions live on a dedicated tab. Calculation sheets reference that tab. Output sheets reference calculation sheets. This three-layer structure means you can update one assumption and watch it flow through the entire model without hunting for hardcoded values.
4. Scenario structure: Each model includes at least a base case, upside, and downside scenario. The PDF shows how to toggle between them using a single dropdown cell, a technique that uses Excel’s data validation feature, which supports up to 32,767 characters in a custom validation list (Microsoft) (a dropdown list that restricts cell input to predefined options).
5. Error checks: The PDF examples include a dedicated error-check row that flags when the balance sheet doesn’t balance or when cash flow doesn’t reconcile. These checks use simple IF formulas: =IF(Assets=Liabilities+Equity,"OK","CHECK").
6. Version control notation: Each PDF example includes a version number and date in the header, a simple habit that prevents the “final_v3_FINAL_USE_THIS” filename problem.
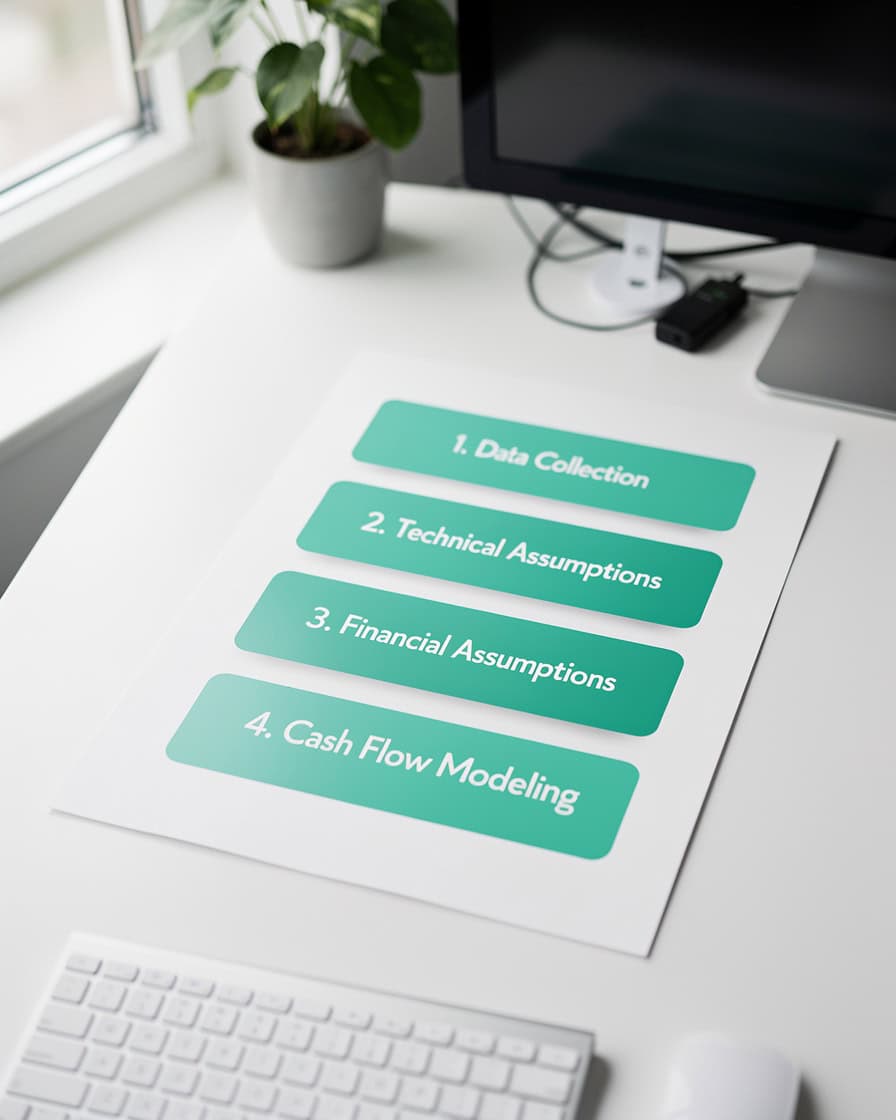
Formula consistency and assumption transparency are the two practices most cited as gaps in analyst-built models.
Common Financial Modeling Mistakes These Examples Help You Avoid
Studying annotated PDF examples is one of the fastest ways to recognize and fix the errors that slow down real modeling work.
Mistake 1: Hardcoding assumptions inside formulas. If your revenue formula reads =1200000*1.05, you’ve buried two assumptions (base revenue and growth rate) inside a formula where no one can find or change them. The PDF examples show every assumption as a labeled cell reference.
Mistake 2: Ignoring working capital in cash flow. Many beginners treat EBITDA as a proxy for cash flow. It isn’t. Working capital changes (receivables, payables, inventory) consume or release cash independently of profit. The manufacturing model PDF dedicates a full schedule to this, showing how a growing business can be profitable but cash-negative.
Mistake 3: Using a single-point valuation. A DCF that produces one number without a sensitivity table is incomplete. The restaurant and hotel PDF examples both include a two-variable sensitivity table showing NPV across a grid of WACC and terminal growth rate combinations.
Mistake 4: Confusing project IRR and equity IRR. Using equity IRR to evaluate whether a project clears its hurdle rate (which is typically a project-level metric) overstates returns. The gold mine PDF explains this distinction explicitly with a side-by-side comparison.
Mistake 5: No error checks. A model without reconciliation checks will eventually produce a wrong answer that looks right. Every PDF example in this library includes at least one balance check and one cash flow reconciliation.
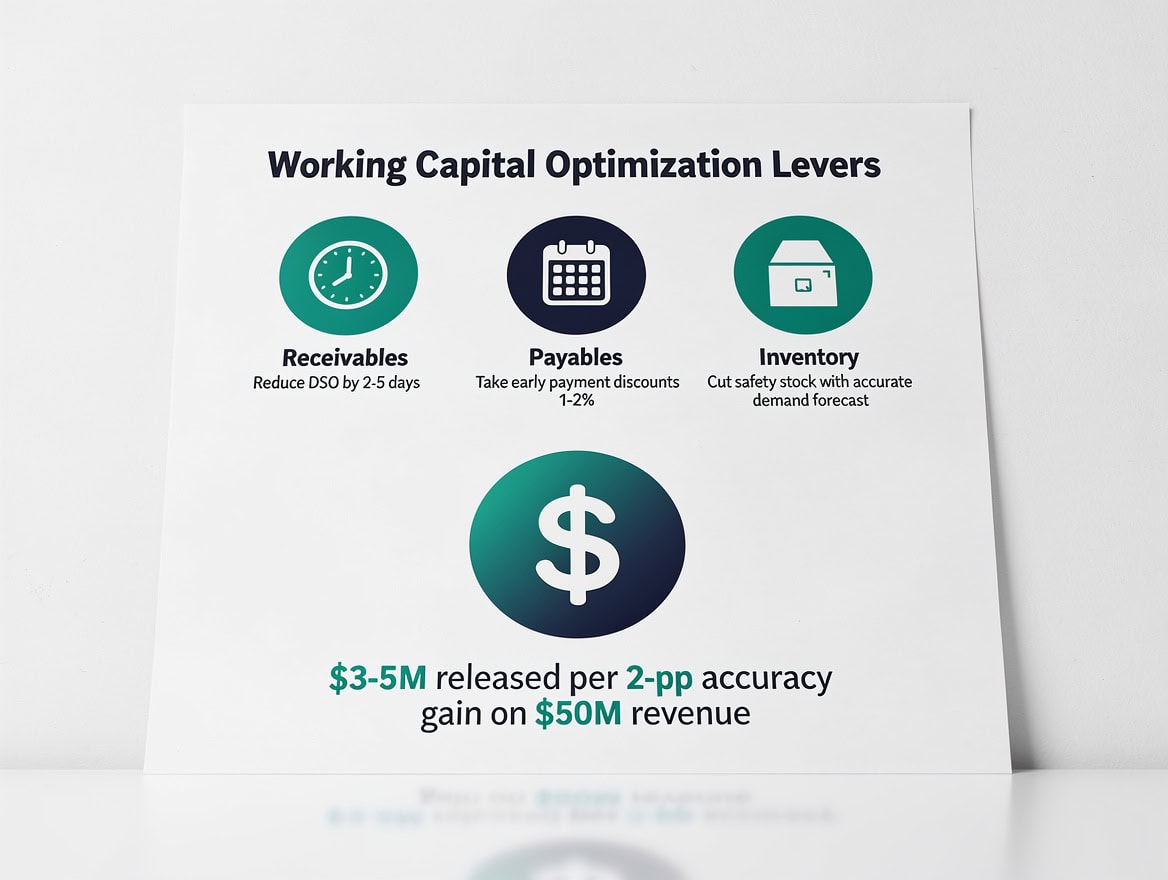
Working capital changes can make a profitable business cash-negative, a mistake the manufacturing model PDF explicitly flags.
Frequently Asked Questions
What is a financial model PDF example and how is it different from an Excel template?
A financial model PDF example is a static, annotated export of a working financial model that shows the full structure, assumptions, and outputs in a readable format without requiring you to open Excel. The key difference is pedagogical: the PDF annotates why each formula works, labels every assumption with its unit and source, and shows the flow from inputs to outputs visually. An Excel template gives you the working mechanics; the PDF gives you the reasoning behind those mechanics. For learning purposes, reading the PDF first and then opening the Excel file is the most effective sequence, because you understand the architecture before you start modifying formulas.
Which financial model PDF example is best for beginners?
The restaurant DCF model and the private school startup model are the best starting points for beginners. Both use straightforward revenue drivers (covers per day and average spend for the restaurant; student enrollment and tuition fees for the school), produce a single primary output (NPV or breakeven), and have fewer than 10 core assumption inputs. The gold mine project finance model, by contrast, requires familiarity with debt scheduling, production ramp-up curves, and the distinction between project IRR and equity IRR, making it better suited to intermediate or advanced users who already understand three-statement modeling.
How do I calculate WACC for a restaurant DCF model?
WACC (weighted average cost of capital) blends the required return on equity and the after-tax cost of debt, weighted by each source’s share of total capital. Here’s the formula: WACC = (E/V) x Re + (D/V) x Rd x (1 – Tax Rate), where E is equity value, D is debt value, V is total capital (E+D), Re is cost of equity, and Rd is cost of debt. For a small restaurant, a typical WACC range is 9-14%, reflecting higher risk than a large public company. The cost of equity is usually estimated using the Capital Asset Pricing Model (CAPM): Re = Risk-Free Rate + Beta x Market Risk Premium. The restaurant PDF example walks through each component with labeled cells.
What is the difference between project IRR and equity IRR in the gold mine model?
Project IRR measures the return on total capital invested in the mine (equity plus debt), calculated before any debt repayment or interest. Equity IRR measures the return on equity capital only, calculated after debt service. Because debt is cheaper than equity and financial leverage amplifies returns to equity holders, equity IRR is almost always higher than project IRR when the project uses debt financing. In a typical mining project with 50-60% debt financing, equity IRR can exceed project IRR by 3-8 percentage points. The gold mine PDF example shows both calculations side by side so you can see exactly how the debt schedule creates this difference.
Can I adapt these PDF financial model examples to a different industry?
Yes, and the PDF format makes adaptation easier because the methodology is documented. The core structure of a DCF model (assumptions, free cash flow forecast, terminal value, discount rate) applies across industries. To adapt the restaurant model to a cafe or bar, you’d change the revenue drivers (covers, average spend, day-parts) and update the EBITDA margin assumption to reflect the new business type. For a manufacturing business, you’d replace the revenue-per-cover driver with a units-produced driver and add a production capacity constraint. The financial model templates library includes industry-specific variants that have already made these adaptations.
How many pages does a typical financial model PDF example contain?
A well-structured financial model PDF typically runs 8-20 pages, depending on model complexity. A restaurant DCF PDF might cover 8-10 pages: 1-2 pages of assumptions, 2-3 pages of revenue and cost build, 2 pages of three-statement output, and 1-2 pages of valuation summary and sensitivity tables. A project finance model for a gold mine runs longer, often 15-20 pages, because it includes a detailed production schedule, a debt and equity waterfall, and multiple scenario outputs. The PDF examples in this library are sized to be comprehensive without being padded.
What Excel functions appear most often in these financial model examples?
The most common Excel functions across these PDF examples are: NPV (calculates the present value of a series of future cash flows at a given discount rate), IRR (finds the discount rate that makes NPV equal to zero), SUMPRODUCT (multiplies arrays and sums the results, useful for weighted averages and scenario toggles), OFFSET (returns a cell reference offset from a starting point, used in dynamic range calculations), and IF (conditional logic for error checks and scenario switches). Excel’s NPV function requires a fixed discount rate and a range of cash flows, and it discounts from Period 1, not Period 0, so initial investment must be added separately outside the function. The financial modeling templates library includes files where these functions are visible and annotated.
Conclusion
Financial model PDF examples close the gap between downloading a template and actually understanding how it works. Each PDF in this library annotates the assumption logic, traces the calculation flow, and shows the valuation output in a format you can study without risking a formula error. Start with the restaurant DCF if you’re building your modeling skills from the ground up, or go straight to the gold mine project finance model if you need to get comfortable with IRR mechanics and debt structuring fast.
I recommend downloading the free financial model templates from the EFM library, pairing each Excel file with its PDF walkthrough, and rebuilding at least one section from scratch using only the PDF as your guide. That single exercise will accelerate your modeling skills faster than any course.
























































