
0 ITEMS

NPV (Net Present Value)
Listed here are financial model templates that include the calculation of the Net Present Value, a financial metric that determines the present value of a cash flow stream.


A clean, fully formula-driven acquisition model for an income-producing property.…


A practical Excel-based acquisition underwriting model designed for European SME…


Buy-side underwriting for a US utility-scale solar plant that is…


Value the equity of a business directly by discounting free…

Appraise a multi-unit residential development before you commit: development budget,…


Bankable Financial Model for Utility-Scale Solar PV Project Finance This…


AI Data Center Power Procurement & Behind-the-Meter Generation Model ⚡…

⚡ Model the grid-connection decision before delay, network upgrades, deposits,…


The Self-Storage Development & Acquisition Model Pro is an institutional-grade…


Build accurate, bank-ready financial projections for your Midstream Oil Refinery.…


An institutional, lender grade Excel model for a temperature controlled…

An institutional, lender grade Excel model for a concrete block…

An institutional, lender grade Excel model for a seawater reverse…

An institutional, lender grade Excel model for an urban bus…


A financial model built specifically for whole-body cryotherapy and recovery…

🔥 Premium AI / LLM Company Valuation Financial Model A…

10-year financial model for a biomethane RNG plant providing forecasts,…

15-year financial model for a rice farm providing forecasts, profitability…


When a lease expires, most comparisons rank options by rent…


A ready-to-use Battery as a Service (BaaS) Financial Model Template…

Small Hydropower Bankable Financial Model — Summary This is a…



A 5-year, fully editable Excel model built specifically for AI…

Plan and forecast your film production business with a ready…

A 32-sheet editable Excel decision model for EU CBAM importers…

Download a ready-to-use Tennis Club Financial Model Template built for…

Premium Private School & University Financial Model designed for integrated…

Premium 30-year Oil & Gas Upstream and Downstream Financial Model…

Premium TCFD / ISSB Physical Climate Risk Financial Model designed…

🔥 Premium Tokenomics & Web3 Token Launch Financial Model A…

Premium Green Hydrogen Production Levelized Cost of Hydrogen model for…

🚀 Premium eVTOL / Urban Air Mobility Financial Model A…

A premium Nuclear Fusion Project Finance Model designed for evaluating…

🚘 Premium Autonomous Vehicle / Robotaxi Fleet Operations Financial Model…

Evaluate a Buy Now Pay Later platform from transaction growth…

10-year financial model for a meat processing facility providing forecasts,…

10-year financial model for a farmland investment fund providing forecasts,…

10-year financial model for a Yacht & Sailing club providing…

A specialized Excel valuation model for longevity and anti-aging biotechnology…

Download our fully automated 2026 Semiconductor fab Excel model. Includes…

An integrated IFRS 16 lessee model for lease-level measurement, portfolio…

An integrated 10-year real estate portfolio model for underwriting and…

An institutional-style, fully editable model for probability-adjusted pharmaceutical valuation, commercial…

A decision-ready U.S. clean-energy tax-credit model for evaluating post-OBBBA §48E…

Build, compare and stress-test five major Sukuk structures in one…

The Hotel Development & Acquisition Model Pro is an institutional-grade…


A Solar + BESS template is a pre-built Excel financial…

FinModelAI Biotech rNPV Valuation Model Pro is a purpose-built Excel…


This financial model provides a complete investment framework for a…


Bank-ready EV charging station financial model built for European projects.…

FinModelAI Multifamily Development Model Pro is an institutional-grade Excel template…

Build accurate, bank-ready financial projections for your Mining Company. Download…

10-year financial model for a ski resort development providing forecasts,…

10-year financial model for a surf club providing forecasts, profitability…

15-year financial model for a cassava farm and processing plant…

Professional oil and gas modeling bundle with two fully editable…

A professional Excel financial model for residential building development projects…

The Data Center Development Financial Model by PDMM is a…

🚀 A professional Private Equity Buy-and-Build Roll-Up M&A Financial Model…

This Excel model is built for a hybrid P2P +…
What is Net Present Value (NPV)?
It brought both an end and a new beginning in this time of the pandemic. Many small and large businesses have ceased operations in the business industry. The root cause is the abrupt shutdown of the economy, making it difficult for companies or businesses to generate sufficient profit for their daily operations. A year has passed, and the economy, along with companies and businesses, is gradually improving. Many of them are starting from scratch, so how can they possibly allocate their resources wisely? How can they determine the viability or profitability of a project they are about to embark on? This article will give you an in-depth guide on how companies, businesses small or big, can measure the risks and profitability of a project by calculating its Net Present Value. See also this video here:Net Present Value Definition
The Net Present Value refers to the Present Value of Future Cash Flow stream (Inflows less Outflows). Net Present Value definition highlights its main purpose in financial decision-making. It is a valuation metric used to determine the viability of a project or investment. Similarly, key executives or entrepreneurs use it to determine how much money or capital they are willing to invest in a project or business. Likewise, the Net Present Value NPV emphasizes the profitability of an investment based on the time value of money. The time value of money is used in NPV, which means that a dollar today is more valuable than money in the future. In addition, it believes that money not invested now will lose its value due to market conditions such as inflation. On the other hand, money invested today can generate a return, potentially increasing its future value. Since Net Present Value NPV underscores the time value of money, it also considers the risk of investments. In calculating the NPV, you need to discount all future cash flows, which represents that there is also an adjustment for possible risk. The Net present value seeks to determine the present value of an investment's future cash flows over the investment's primary cost. Net Present Value in a Discounted Cash Flow valuation is determined by the discount rate, which can be calculated from the cost of capital required to invest. In addition, calculating the value of NPV entails discounting all free cash flows to present-day value using an assumed discount rate. The cash flows are discounted in the NPV calculation to mitigate the risk of an investment opportunity and account for the time value of money. It is also necessary to deduct the primary cost of investment from the sum of the cash flows.Positive and Negative Net Present Value: Rule of Thumb
In venturing into projects and purchases, a company or firm must ensure that what they are about to do will get them to a win-win situation. They must gauge risks and profitability simultaneously so they can foresee what could happen to the business venture. In that case, Net Present Value can be a valuable tool to measure the feasibility of a project. If a project's or expense's discounted future cash inflows exceed the investment's cost, the NPV is positive, indicating that the investment is likely to be beneficial. Hence, if the NPV is negative, the discounted future cash flows are less than the project's initial cost. This will caution the investors that the investment isn't financially viable at this discount rate. This does not necessarily imply that the investment will lose money, but it will force you to consider it beneficial. Moreover, a positive Net Present Value signifies that the investment is making money and is lucrative. Conversely, if the NPV calculation yields a negative value, the project is expected to produce a negative value (NPV). As a result, an investor should avoid pursuing funding for a particular project or venture. In a word, if the net present value NPV is greater than zero, go ahead and invest. On the other hand, if the NPV is less than zero, you should rethink or reject investing in a project because it will significantly lose a great amount of money otherwise, the firm or corporation.Net Present Value Advantages and Disadvantages
For senior executives and entrepreneurs, valuation methodologies are critical since they provide an overview of significant features of a corporation or organization. Methods of valuation are used to manage operations better and increase profitability. Net Present Value is one of the key metrics to know the profitability of a project or investment. While it is one of the known metrics in business and finance, net present value advantages and disadvantages must be considered. Let's have an overview on Net Present Value Advantages and Disadvantages:Net Present Value’s Advantages
- Time Value of Money- it means that NPV considers that cash flows in the future might not be as significant as the cash flow today. This helps enterprises or organizations in decision making as to invest in a specific project or business venture or not.
- Good metric in calculating a company's intrinsic value- It considers all the company's cash flows, whether it is inflows, outflows, time duration, and the risk as time passes by.
- Profitability measure- NPV determines the feasibility of a venture as well as the value of total profits.
- Widely used in DCF Valuations- In a DCF analysis, the Net Present Value is utilized to evaluate a company's valuation because it is one of the most theoretically sound valuation approaches.
- Measure company’s value- Net Present Value NPV can be used to estimate the value of a company, an asset, or any project with attributable cash flow streams.
- Quantifiable method- NPV offers a quantifiable method to measure the creation of shareholder’s value when used in the DCF context.
Net Present Value’s Disadvantages
- Constant Discount Rate- It is necessary to choose a discount rate. Net Present Value NPV presupposes that the discount rate remains constant throughout the investment or project's life. We must take note that discount rates fluctuate from year to year.
- Identifying the Discount rate- The finance team of a business or a company may find it difficult to determine the rate at which the cash flows should be discounted. WACC should not be used as a discount rate; instead, the project's rate of return should be used, and incorrect estimation may result in greater or lower Net Present Value. Remember that a high-risk project should be valued at its required rate of return, not its cost of capital.
- Requires Financial Plan and Forecast- Net Present Value requires a financial plan and forecast. This forecast is very subjective and can be manipulated.
- Comparing projects- NPV does not work well when you want to compare projects which differ heavily in their investment amount. If there’s a big difference in the investment amount, it is better to use IRR analysis.
The Formula for Net Present Value NPV
This is the formula for net present value, which we will use to calculate the value of NPV. NPV=Today’s value of the expected cash flows−Today’s value of invested cash The formula for net present value is consists of the following components: Present Value (PV)- refers to the current value of all future earnings earned by that investment. In other words, it is the amount of money that must be invested now to gain a given income later on. Future Value (FV)- refers to the total amount of money that will grow and accrue over time if that amount is invested.Net Present Value in Excel
This article will delve into the picture of how to calculate Net Present Value and other components that you will encounter for these examples. Let us see the examples below:Net Present Value Example Loveflies Co., Example 1:
Loveflies Co., a Glutathione capsule manufacturer, is considering investing in new beauty machines and ingredients to improve the efficacy of their product. The first investment in this initiative by Loveflies is $455 000 for five years. There is a discount rate of 12%. In this net present value example, the company wants to know its net present value.How to Calculate Net Present Value in Excel?
Let us go to the step-by-step procedure on how to calculate net present value in excel. 1. List all the assumed data. Note that all assumed data are written in blue font, and calculations are written in black font.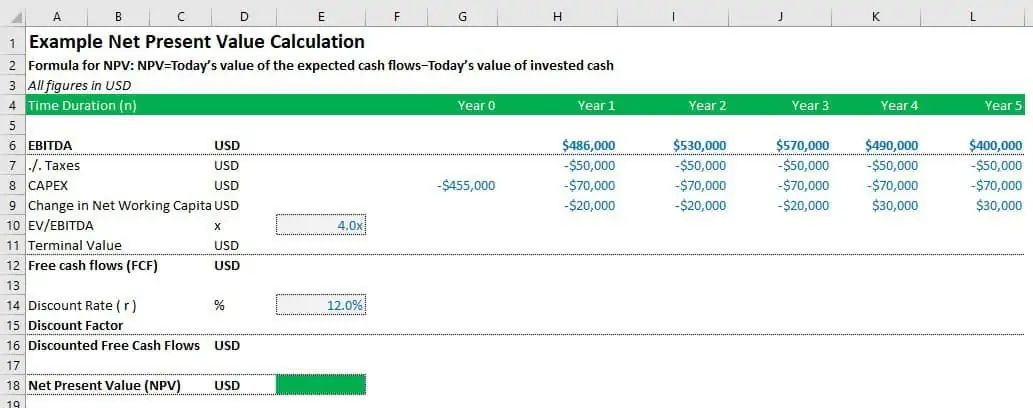 2. You will notice the highlighted cells of free cash flows for each year or duration in the first part. Hence, you might be wondering where all these cash flows came from?
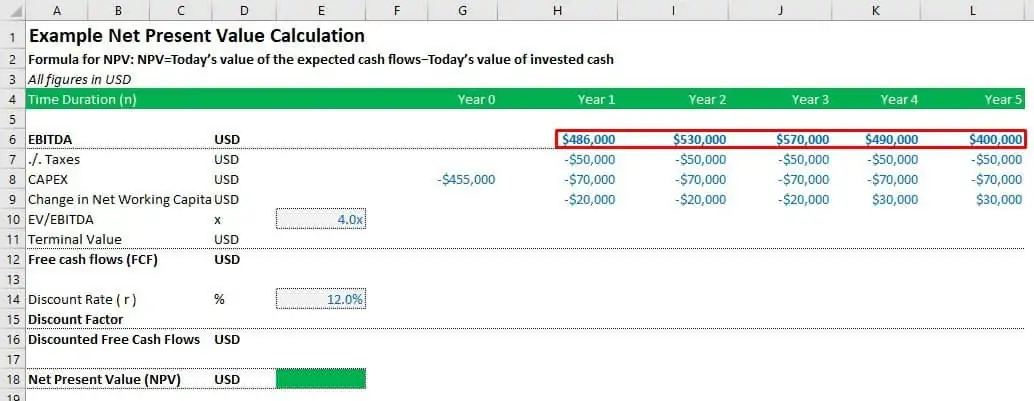 The Free Cash Flows or FCFs in calculating the Net Present Value came from the EBITDA. Again, you can see on the side of the excel the particulars. EBITDA (Earnings Before Interest, Taxes, Depreciation, and Amortization) refers to the company's earnings before essential expenses such as interest payments, tax payments, depreciation, and certain capital expenses that are accounted for, or amortized, over time.
Take note of the values under each cash flow as well. Following EBITDA is the discount for taxes, capital expenditures, and changes in networking capital. You will notice that the values for those elements are all negative. It means that this is the amount of money that the company has set aside to upgrade, fund new projects, or pay taxes.
The Free Cash Flows or FCFs in calculating the Net Present Value came from the EBITDA. Again, you can see on the side of the excel the particulars. EBITDA (Earnings Before Interest, Taxes, Depreciation, and Amortization) refers to the company's earnings before essential expenses such as interest payments, tax payments, depreciation, and certain capital expenses that are accounted for, or amortized, over time.
Take note of the values under each cash flow as well. Following EBITDA is the discount for taxes, capital expenditures, and changes in networking capital. You will notice that the values for those elements are all negative. It means that this is the amount of money that the company has set aside to upgrade, fund new projects, or pay taxes.
 3. The following assumed data are the EV/EBITDA and discount rate.
 If you are new to finance, you might be wondering what does EV/EBITDA means?
EV/EBITDA refers to the ratio which gives a picture of comparison between Enterprise value (EV) to the company's EBITDA. This is commonly used as a valuation measure to determine if the company is overvalued or undervalued.
On the other hand, the Discount rate represents the time worth of money, the risk of an investment, or it can be used as a barrier rate for investment decisions.
4. Now that we are done with the assumed values, we will calculate the terminal value.
If you are new to finance, you might be wondering what does EV/EBITDA means?
EV/EBITDA refers to the ratio which gives a picture of comparison between Enterprise value (EV) to the company's EBITDA. This is commonly used as a valuation measure to determine if the company is overvalued or undervalued.
On the other hand, the Discount rate represents the time worth of money, the risk of an investment, or it can be used as a barrier rate for investment decisions.
4. Now that we are done with the assumed values, we will calculate the terminal value.
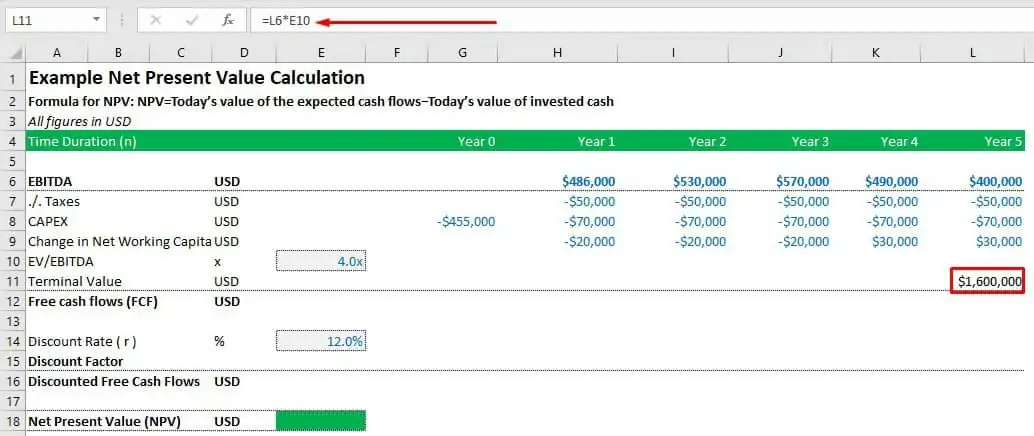 As you can see in the example, to calculate the Terminal Value, we multiplied the value of the fifth year by the EV/EBITDA. Thus, the Terminal value will be the sum of all cash flows from an investment or project. We use the assumed value for year five because we expect it to be the value of future cash flows beyond the 5-year forecast period.
5. Next is, to sum up, all the components to calculate the Free Cash Flows for each year.
As you can see in the example, to calculate the Terminal Value, we multiplied the value of the fifth year by the EV/EBITDA. Thus, the Terminal value will be the sum of all cash flows from an investment or project. We use the assumed value for year five because we expect it to be the value of future cash flows beyond the 5-year forecast period.
5. Next is, to sum up, all the components to calculate the Free Cash Flows for each year.
 You can see from our excel file how Free cash flows are calculated using EBITDA and other components.
6. After that, we are going to calculate the discount factors for each year.
You can see from our excel file how Free cash flows are calculated using EBITDA and other components.
6. After that, we are going to calculate the discount factors for each year.
 Notice that we will need the discount rate and the time duration in the formula to calculate the discount factors. Take note that the only changing value in the formula is the time duration. See the image below:
 7. The next thing that we will do is to calculate the discounted free cash flows.
 We just need to add the calculated Free cash flow to its discounting factor. You must remember that the discount factor and discount rate are closely connected; however, the discount factor pertains to the present value of cash flows while the discount rate considers the current value of future cash flows. Another purpose it serves is it may forecast an investment's predicted profits or losses, as well as its net future value.
8. Lastly, we calculate the value of Net Present Value (NPV)
We just need to add the calculated Free cash flow to its discounting factor. You must remember that the discount factor and discount rate are closely connected; however, the discount factor pertains to the present value of cash flows while the discount rate considers the current value of future cash flows. Another purpose it serves is it may forecast an investment's predicted profits or losses, as well as its net future value.
8. Lastly, we calculate the value of Net Present Value (NPV)
 To compute the Net Present value in excel, we add all of the discounted free cash flows, including the initial investment. You will notice that the value for Year 0 is negative. Why is the value negative?
Year 0 serves as the start-up year, which means that an initial investment or capital is required for a business to operate. Therefore, the formula states that we must subtract today's expected cash flows from today's invested cash value when calculating the NPV. In this case, we will include the initial investment in the sum of discounted cash flows. It will be automatically deducted from the net present value because it is a negative amount of money.
Since our calculated Net Present Value in excel is positive, it means that Loveflies Co.'s investment in new beauty machines and ingredients will be helpful to increase sales or profit.
To compute the Net Present value in excel, we add all of the discounted free cash flows, including the initial investment. You will notice that the value for Year 0 is negative. Why is the value negative?
Year 0 serves as the start-up year, which means that an initial investment or capital is required for a business to operate. Therefore, the formula states that we must subtract today's expected cash flows from today's invested cash value when calculating the NPV. In this case, we will include the initial investment in the sum of discounted cash flows. It will be automatically deducted from the net present value because it is a negative amount of money.
Since our calculated Net Present Value in excel is positive, it means that Loveflies Co.'s investment in new beauty machines and ingredients will be helpful to increase sales or profit.
Net Present Value Loveflies Co., Free Cash Flow Forecast:
In this diagram, we will look at Loveflies Co.'s free cash flows. The company intends to invest in new beauty machines and ingredients, contributing to product innovation and providing the best products and benefits to their customers. The company wants to know if the upgrade will generate a significant amount of money in the coming years. Let's look at the Net Present Value Diagram below: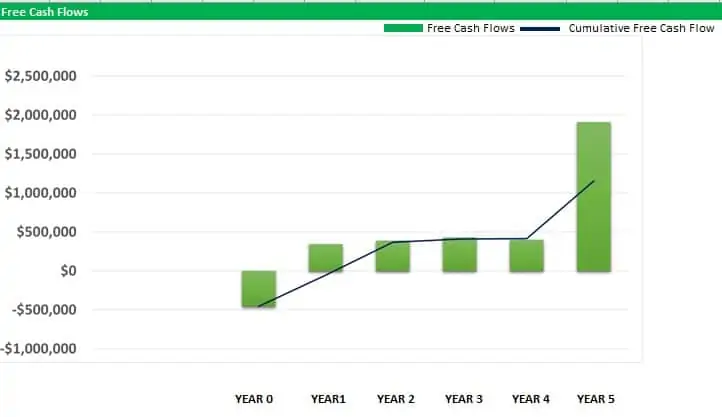 We may simply compare the values of each cash flow from each year in this diagram. You already know that the value of Net Present Value may be calculated by adding all of the discounted cash flows. However, in this illustration, the free cash flows for each year are not yet discounted. As a result, you can see that the trend line for the calculated values is going up until year 5, indicating that the investment made by investors may provide strong cash flows in the future.
To determine whether an investment can generate and sustain consistent cash flows, the net present value should be discounted. Similarly, after discounting, the calculated net present value should still be positive. Even if we include the initial investment, which has a negative value in the discounted cash flow calculation, the result is still positive in this example. It suggests that Loveflies Co.'s project is viable and will generate substantial cash flows in the coming years.
We may simply compare the values of each cash flow from each year in this diagram. You already know that the value of Net Present Value may be calculated by adding all of the discounted cash flows. However, in this illustration, the free cash flows for each year are not yet discounted. As a result, you can see that the trend line for the calculated values is going up until year 5, indicating that the investment made by investors may provide strong cash flows in the future.
To determine whether an investment can generate and sustain consistent cash flows, the net present value should be discounted. Similarly, after discounting, the calculated net present value should still be positive. Even if we include the initial investment, which has a negative value in the discounted cash flow calculation, the result is still positive in this example. It suggests that Loveflies Co.'s project is viable and will generate substantial cash flows in the coming years.
Net Present Value Buds and Meadows Example 2:
To see whether an investment could produce and sustain robust cash flows, the net present value should still have a positive calculated value even when discounted. In this diagram, we are going to have an overview of the Discounted Cash Flows. Buds and Meadows is a landscaping company that offers a variety of services. To meet the demands of their clientele, they plan to purchase new equipment and a new breed of grasses and plants. To begin the project, they aim to invest $4,550,000. There is an 18 percent discount rate. Do you believe the investment in the net present value example will yield a profit or not? For this example, we highlighted the change in the assumed values.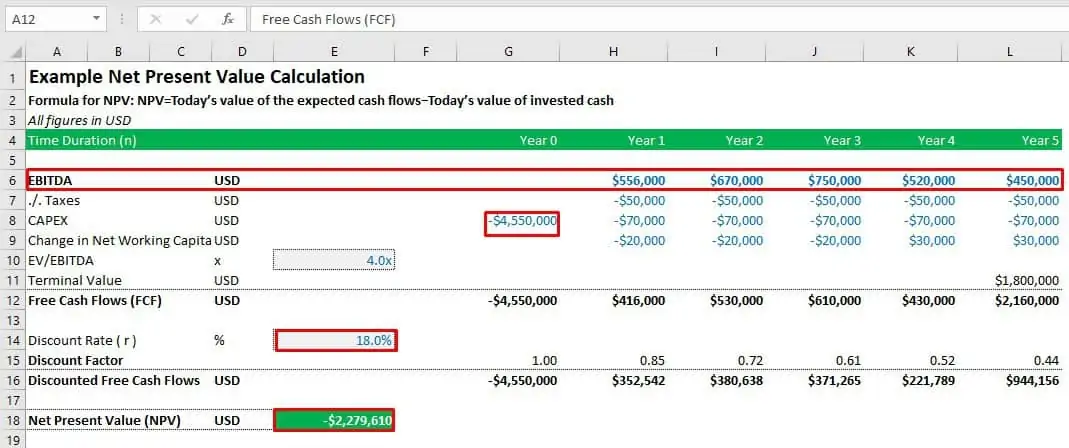 We followed the identical methods as in the first example in this case. As you can see, we have already figured out all the numbers. The starting investment, free cash flows for each year, and the discount rate were all adjusted. The only difference between this case and the first is that the calculated net present value was negative.
When the net present value is negative, the project is likely to lose a lot of money. Essentially, you expect to lose money on this project. As a result, it makes no logical sense to continue with this project.
On the other hand, the growth of other discounted cash flows from different years appeared less than the amount of money invested. As a result, the calculated net present value is negative and not even half of the amount invested.
In contrast, the first example has a favorable net present value, indicating that the project will be profitable. Also, you can see that the initial investment for Loveflies Co. is lesser than Buds and Meadows. At the same time, Buds and Meadows received a large amount of funding as a primary investment. As a result, its computed net present value was negative, signaling a red flag to investors.
We followed the identical methods as in the first example in this case. As you can see, we have already figured out all the numbers. The starting investment, free cash flows for each year, and the discount rate were all adjusted. The only difference between this case and the first is that the calculated net present value was negative.
When the net present value is negative, the project is likely to lose a lot of money. Essentially, you expect to lose money on this project. As a result, it makes no logical sense to continue with this project.
On the other hand, the growth of other discounted cash flows from different years appeared less than the amount of money invested. As a result, the calculated net present value is negative and not even half of the amount invested.
In contrast, the first example has a favorable net present value, indicating that the project will be profitable. Also, you can see that the initial investment for Loveflies Co. is lesser than Buds and Meadows. At the same time, Buds and Meadows received a large amount of funding as a primary investment. As a result, its computed net present value was negative, signaling a red flag to investors.
Net Present Value SEL Construction Example 3:
SEL Construction is a construction firm that provides top-of-the-line materials, tools, and equipment to build various infrastructures. The firm is planning to add more equipment to further polish and upgrade its services to their clients. To begin the project, they aim to invest $225,000. There is a 15 percent discount rate. Is the investment viable or not? Let’s see the calculations below: We changed the values of the highlighted cells in this example. From Year 0 to Year 5, the free cash flows vary. The values are not in a fixed range, as can be seen. This indicates that cash flows are not always at a constant rate.
In this case, the computed net present value is similarly positive, indicating that the SEL construction investment in new equipment is a good project that will provide many cash flows in the future. That's why the company can consider pursuing this venture.
We changed the values of the highlighted cells in this example. From Year 0 to Year 5, the free cash flows vary. The values are not in a fixed range, as can be seen. This indicates that cash flows are not always at a constant rate.
In this case, the computed net present value is similarly positive, indicating that the SEL construction investment in new equipment is a good project that will provide many cash flows in the future. That's why the company can consider pursuing this venture.
Comparing Net Present Values of Loveflies Co., and SEL Construction:
This illustration will compare the calculated net present values for Loveflies Co. and SEL Construction side by side. The initial investment for Loveflies Co. is $455,000, which will be used to purchase new beauty machines and ingredients. SEL Construction, on the other hand, would like to fund a $255,000 construction equipment upgrade. As you can see, the initial investments of the two companies differ. Loveflies' initial investment is greater than SEL Construction's initial investment. The significant disparity between the Net Present Values of Loveflies Co. and SEL Construction may be seen in this comparison diagram.
Even though their initial investments are different, both of their calculated net present values are positive. This means that the calculated net present values outweighed the funds invested. Similarly, it indicates that both firms should continue with their investments because both can generate large amounts of cash flow.
Similarly, from an NPV point of view, Loveflies Co. generated a more valuable result than Buds and Meadows. However, this result might be different from an IRR analysis. See here for more information about IRR.
The significant disparity between the Net Present Values of Loveflies Co. and SEL Construction may be seen in this comparison diagram.
Even though their initial investments are different, both of their calculated net present values are positive. This means that the calculated net present values outweighed the funds invested. Similarly, it indicates that both firms should continue with their investments because both can generate large amounts of cash flow.
Similarly, from an NPV point of view, Loveflies Co. generated a more valuable result than Buds and Meadows. However, this result might be different from an IRR analysis. See here for more information about IRR.
Net Present Value in a Nutshell
We already explained the concept of Net Present Value (NPV). It is one of the financial metrics that a firm or business used to gauge the feasibility of a project or business venture. It considers the value of investing money in the present rather than some time in the future. Because Net Present Value considers the time value of money, the measure also represents the analytics of cash flows, which can have a substantial impact on the present value of an investment. The calculation for Net Present Value is a well-known method in capital budgeting, especially for an organization or firm's expansion. Before investing in a project, a firm must make financial decisions to make or break its profitability. Nonetheless, we must be conscious of its limitations and utilize them in conjunction with other metrics and appraisal approaches.
You might also like: