
0 ITEMS
Sensitivity Analysis
Listed here are financial models with sensitivity analysis which allow to conduct sensitivity analysis in order to understand the effect on the company’s valuation or investment IRR by changing some of the main key assumptions of the company’s business plan.

Startup Company Financial Model – Dynamic 3 Statement Financial Projections up to 8-Years
Highly Dynamic and Easy-to-Navigate Excel Financial Projections Model that allows…

Advanced Financial Model – Dynamic 3 Statement 10-Year Financial Model with DCF Valuation
Advanced, Dynamic and Easy-to-Use Excel Financial Projections Model that allows…

Parcel Locker Network Business Financial Model (10+ Yrs. DCF and Valuation)
The Parcel Locker Network Business Financial Model is a comprehensive…

B2B SaaS FInancial Model & Valuation Template
Unlock your B2B SaaS venture's full potential with our B2B…

Biomethane Producer Financial Model (Renewable Natural Gas)
Create a detailed pro forma with this biogas financial model.…
Fintech Mobile App Financial Model
A comprehensive editable, MS Excel spreadsheet for tracking Fintech Mobile…

Animal Feed Mill – 10 Year Financial Model
Financial Model providing a dynamic up to 10-year financial forecast…

Broilers Poultry Farm – 10 Year Financial Model
Financial Model providing a dynamic up to 10-year financial forecast…
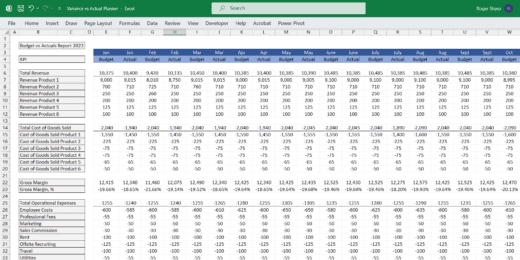
Budget vs Actual Forecasts 5 Years Excel Template
MS Excel spreadsheet for tracking budget finances. Can be used…

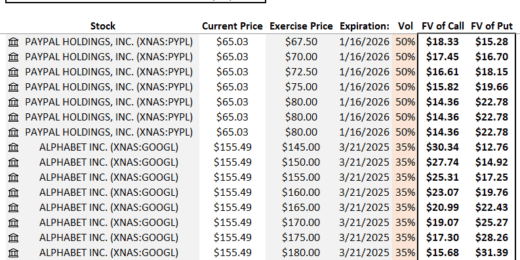
Equity Options Fair Value Calculator (Black-Scholes)
The Equity Options Fair Value Calculator (Black-Scholes) is your go-to…

Aesthetics & Dermatology Clinic – 5 Year Financial Model
Financial Model providing an advanced 5-year financial plan for a…


Construction Machinery Rental Company Financial Model
Discover the key to financial planning in the construction machinery…


Fruit Processing Facility – 10 Year Financial Model
Financial Model providing a dynamic up to 10-year financial forecast…


Auto Parts Store – 5 Year Financial Model
This Financial Model Template provides an advanced 5-year financial plan…


Surfboard Rental Business Financial Model
Surfing is not just a sport—it's a lifestyle booming globally.…

Real Estate – Multi Family Acquisition Pro-forma
This Excel template is an intuitive and comprehensive solution tailored…

AgroTech Services Financial Model (10+ Yrs. DCF and Valuation)
The AgroTech Services Financial Model with DCF (Discounted Cash Flow)…

Crypto Token Valuation Model
A cutting-edge crypto token valuation model, designed to provide comprehensive…

Complete Private Equity (LBO) Financial Model
This is a professional financial model which performs a thorough…


Urban Micro-Mobility Services Financial Model (10+ Yrs. DCF and Valuation)
The Urban Micro-Mobility Services Financial Model with DCF (Discounted Cash…

Trucking Company – 10 Year Financial Model
Financial Model providing a dynamic up to 10-year financial forecast…

Crane Truck Rental Company Financial Model
Step into the world of crane rental business success with…

Daycare Service Facility Financial Simulation – Up to 10 Year
Dynamic assumptions to create pro forma financial statements for a…


Cleaning Service Pro Forma Template (Commercial / Residential)
A pro forma template for any home service or general…

eCommerce | Online Retail Financial Model and Valuation
Discover the eCommerce - Online Retail Company Financial Model and…

Cocktail Bar – 5 Year Financial Model
Financial Model providing an advanced 5-year financial plan for a…

Truck Rental Company Financial Model
This detailed 10-year monthly Excel template is specifically designed to…

Private Aircraft Rental Company Financial Model
Embark on a journey to financial mastery with our Private…

Webinar Organizer Business Plan Template
Discover the key to financial success in your webinar ventures…

SaaS Company Financial Model and Valuation
Discover the SaaS Company Financial Model and Valuation, an essential…

Party Planning Business Financial Model
Introducing the Party Planning Business Financial Model – Your Ultimate…

Culinary Arts Academy – 10 Year Financial Model
Financial Model providing a dynamic up to 10-year financial forecast…

Zero Down Seller Financing Strategy for Real Estate Investment
A tool to estimate expected risk and cash flow of…
User Cohort Analysis | User Subscription Analysis
This meticulously crafted Excel model is designed for in-depth user…

Event Organizer Business Model Template
Elevate your event planning business to new heights with our…

Sky Diving Center – 5 Year Financial Model
Financial Model providing an advanced 5-year financial plan for a…

Function-as-a-Service (serverless computing) Financial Model
Create financial projections for a FaaS cloud computing services business.…


Crypto Trading Platform – 5 Year Financial Model
Financial Model presenting an advanced 5-year financial plan of a…
Data-as-a-Service Financial Feasibility Study
This model is built for data-as-a-service startups. If you have…

EV Battery Recycling Plant Financial Model (10+ Yrs DCF and Valuation)
The EV Battery Recycling Plant financial model is a comprehensive…

Events & Weddings Venue – 5 Year Financial Model
Financial Model providing an advanced 5-year financial plan for a…

Microfinance Platform – 5 Year Financial Model
Financial Model presenting an advanced 5-year financial plan for a…

Educational Courses: Financial Feasibility and Capacity Model
Model up to 3 course types that have scaling logic…


Tennis Club Financial Model – 5 Year Forecast
Financial Model providing an advanced 5-year financial plan for a…

Catering Services Business Financial Model (10+ Yrs DCF and Valuation)
The catering services business financial model is a comprehensive tool…


Moving Services Business Financial Model (10+ Yrs DCF and Valuation)
The moving services business financial model is a comprehensive tool…

Online Travel Agency Financial Feasibility Model
Create up to 72 months of financial projections based on…

Blue Ammonia using Natural Gas – 3 Statements, Cash Waterfall & NPV/IRR Analysis
An integrated and comprehensive Blue Ammonia Production Plant Model that…

Blue Hydrogen using Natural Gas – 3 Statements, Cash Waterfall & NPV/IRR Analysis
An integrated and comprehensive Blue Hydrogen Production Plant Model which…

Car Rental Business Financial Model
This Car Rental Business Financial Model Template in Excel offers…
Financial Planning and Analysis
Financial planning is one of the most crucial tasks whether when it comes to running a business, planning to start a business, or simply for personal circumstances, as to help to make sensible decisions about financing that can help reach the determined goals or objectives. Basically, by creating a financial plan, one can project or predict unknown variables that could affect the future key variables. These projected variables are then analyzed to determine what changes will happen to such results after considering different assumptions.
Financial planning and analysis is actually regarded as the budgeting, forecasting, and analytical processes that support an organizations’ financial health and business strategy. It depends heavily upon the analysis to measure and plan the business operations as well as forecasting their financial impact while considering a different set of assumptions.
Financial planning and analysis or FP&A experts are likely to monitor, analyze, and help manage the financing needed to meet certain obligations, tracking and analyzing cash flow, analyzing the financial statements along with other financial and operational data that are important and might be affected to certain changes in scenarios.
Identifying the Differences between Types of Analysis
Scenario analysis, sensitivity analysis, and what-if analysis are all very similar to each other. In fact, they’re really only slight variations of the same thing. Here’s a breakdown:
- What-if analysis: What-if analysis is the process of testing to see “what would happen if” you change something in the model.
- Sensitivity analysis: Sensitivity analysis is the process of tweaking one key input or driver in a financial model and seeing how sensitive the model output (e.g. the NPV or the IRR) is to the change in that variable.
- Scenario analysis: Scenario analysis is the process of tweaking a whole series of inputs or drivers in a financial model and seeing what happens with the models result.
In most cases, financial modelers consider building a sensitivity analysis better to determine and evaluate the extent to which changes in assumptions and inputs affect various outputs of interest, such as revenues, net income, free cash flows, and many more value key drivers. Here, we will focus on discussing more regarding Sensitivity Analysis and how to build a model that allows you to conduct a sensitivity analysis.
What is Sensitivity Analysis
Sensitivity analysis is a very useful tool to analyze the impact of any changes in key assumptions on the key output of the model, such as the NPV and IRR. It is also known as the “what-if” analysis since you have to go through a series of what-ifs to run different simulations and determine the impact of each assumption. By running a variable through different scenarios or circumstances, you’ll be able to determine how sensitive the output is and also find out how to keep the inputs constant. In other words, sensitivity analysis is the task of calculating the uncertainty of a financial model while considering different sources of inputs.
Once you have a working financial model, choosing the key value drivers as well as a series of inputs or outputs to use as the variables to conduct sensitivity analysis is an important challenge. It is so easy to do these in Excel that the tendency is to drown management with numbers. Instead of taking that easy way out, you need to devote some time to decide which sensitivity analysis will be most informative to look at.
In this case, the problem already specifies the tables to prepare. Data Table is the ideal tool for doing this analysis. Remember that it is easiest to create data tables in the same sheet that has the independent and dependent variables.
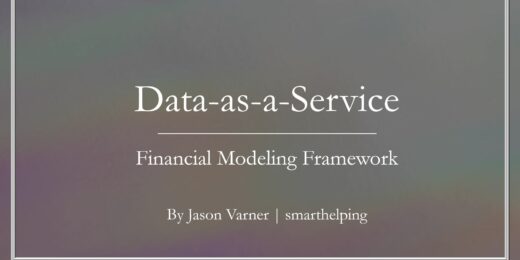
For example, we’ll use the Sensitivity Analysis Model of a Gas Station to check how a sensitivity analysis work:
Here, we are checking what will happen to the Unlevered Internal Rate of Return (IRR) by either increasing or decreasing the price.
Normally, the IRR should go up if you increase the prices but in this case, it’s not because this model is built on a different logic of a constant profit margin per gallon which means, that the percentage profit margin per gallon in relation to the gasoline sales price gets lower if the gasoline prices increases.
Now, it depends if reality is indeed is like this, if not, you will have to change the logic of your model. So, this sensitivity analysis can be a very useful tool to check if your model is working the way it should.
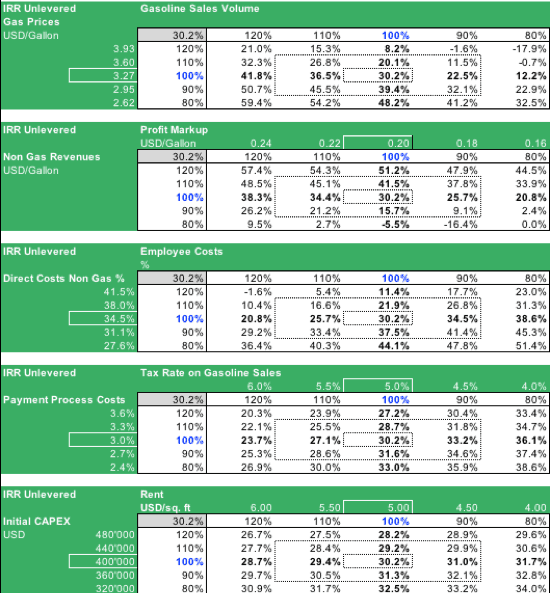
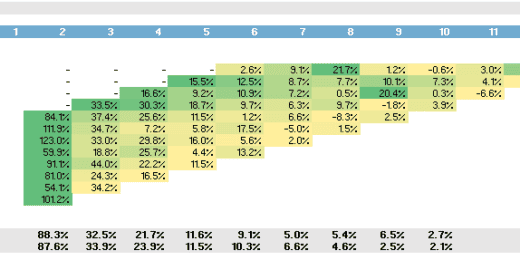
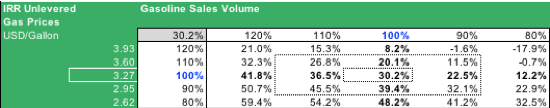
We then extended the sensitivity analysis instead of checking only two assumptions to ensure wider coverage. Meaning, we are checking the changes in 10 main assumptions for the effects on the key outputs which in this case is the unlevered IRR. As usual, each of these tables has 5 scenarios for two different key assumptions each (either increasing or decreasing).
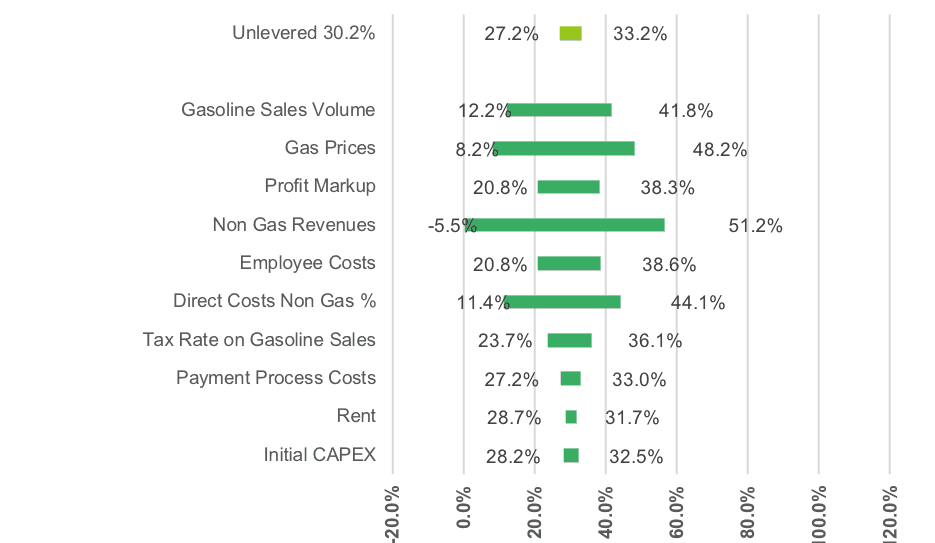
Using the tables’ data, we then built a Tornado Diagram to have an easier and understandable view to check what happens to the unlevered IRR if we change each assumption by 20% up or by 20% down. Basically, which assumption has the most effect, ergo, which is the most important assumption driving the value of your model, in the above case, surprisingly, the most important assumption is the related to the non-gas revenues since a gasoline station today makes its money by selling non-gas items and not by selling only gasoline anymore.
Steps Used to Conduct a Sensitivity Analysis
To analyze how sensitive the output is, you will need to run it through a sensitivity analysis which can be complex depending on what you’re trying to make a study out of. When planning to conduct a sensitivity analysis, one needs to note down these parameters:
- Basic structure – includes a combination of assumptions that are to be varied, ensuring which and how many assumptions are needed at a period, assigning values before the simulation, analyzing the correlations of the values, etc.
- What to vary – set of different assumptions that can be chosen to vary in the model, such as the number of activities, objective in relation to the risk assumed and the projected profits, technical ratios, number of constraints and limits, etc.
- What to observe – include the value of the variable as per the regular business plan, the value of the decision variables, and value of the variable after going through between two different strategies applied
To better understand the above-mentioned parameters applied in a model, here are the steps used to conduct a sensitivity analysis:
- Input the base case output to be put under sensitivity analysis. (e.g. V1)
- Calculate the new value of the input by measuring through the sensitivity test while all other inputs in the model are kept constant. (e.g. V2)
- Calculate the percentage change in the output and input respectively.
- The sensitivity is then calculated by dividing the percentage change in output by the percentage change in input.
The process is repeated to the rest of the inputs until the sensitivity figure for each of the inputs is fulfilled. Therefore, if you arrive at a higher sensitivity figure, the more sensitive your output is to any change that might occur in your business cycle. The same also applies vice versa.
Uses of a Sensitivity Analysis
One of the best uses for sensitivity analysis is for building a model for economic decision making. All the data provided will be a great reference to come up with the best decision and also can be fully utilized repeatedly to conduct a sensitivity analysis. The model will help the user to understand the risks and benefits, uncertainties, limitations, and scope of the model. Since most of all the decisions aren’t definite, to conduct a sensitivity analysis will be a great tool to test various assumptions in different simulations, arriving at the most optimal solution or answer about the uncertainties in decision making.
There are many more uses that a sensitivity analysis is built for, such as:
- Indicating the sensitivity of simulation to assumptions of the input values in a model
- Predicting the effects of different scenarios and decisions
- Testing the robustness of the values
- Assessing the risks of a strategy or the business plan
- Determining if the optimal value criteria are reached or still have space to grow
- Identifying the dependency of the outputs to certain inputs, whether it is helpful or risky
- Acting as an error checker of the model
- Building informed and appropriate decisions or strategy
- Removing redundancy in the model structure
- Representing as a tool to communicate between entities
- Etc.
Sensitivity Analysis Example Models
Building a sensitivity analysis model isn’t as simple as it sounds. It takes skill, experience, and the equivalent know-how to be able to fully utilize the usefulness of the model. If you are looking for sensitivity analysis example models, you can check out our list of financial model templates which included sensitivity analysis example models above. You will be able to see how they function and you will also learn how to build one for yourself. By using the template as your base model, you will be able to build a working financial model with a sensitivity analysis section included.
These financial model templates which included Sensitivity Analysis are ready-made by expert financial modelers that have substantial financial modeling experience and industry know-how, so you don’t have to hire a professional to build a fully customized model for you.
If you are in need of financial model templates for different use cases, you can simply go through our list of use cases which contains several financial model templates according to their uses. These templates are also downloaded by users from all over the globe such as the USA, Canada, Japan, France, Singapore, and many more who are in need of help when it comes to their financial modeling tasks.