
0 ITEMS

IRR (Internal Rate of Return)
Internal rate of return (IRR) analysis allows to compare and investment projects vs. their cost of capital. Here, we listed all financial model templates with the calculation of IRR included or other use cases where the analysis and calculation of IRR are projected. Below the list, we added information about what is IRR, what are its uses and significance, as well as explaining how to calculate IRR.


Production-ready Excel financial model for standalone utility-scale BESS projects, bundled…


Excel model to analyze real estate investment deals — NOI,…


An institutional, lender grade Excel model for a temperature controlled…

An institutional, lender grade Excel model for a concrete block…

An institutional, lender grade Excel model for a seawater reverse…

An institutional, lender grade Excel model for an urban bus…


A financial model built specifically for whole-body cryotherapy and recovery…


🔥 Premium AI / LLM Company Valuation Financial Model A…
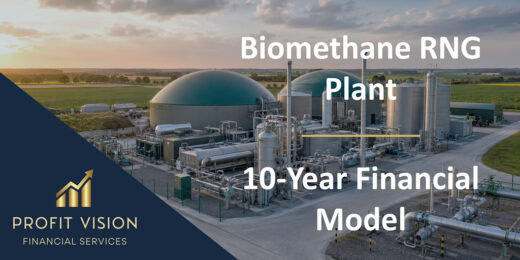

10-year financial model for a biomethane RNG plant providing forecasts,…

15-year financial model for a rice farm providing forecasts, profitability…


Small Hydropower Bankable Financial Model — Summary This is a…



Underwrite a mobile home park deal in minutes: a model…


Plan and forecast your film production business with a ready…


An integrated three-statement operating model valued three ways: discounted cash…

A 30-module editable Excel model for multinational Pillar Two analysis,…


Underwrite multifamily deals the way institutional buyers do — without…


Whether you're launching a startup, planning business expansion, preparing for…

Download a ready-to-use Tennis Club Financial Model Template built for…

Premium Private School & University Financial Model designed for integrated…

Premium 30-year Oil & Gas Upstream and Downstream Financial Model…

Premium TCFD / ISSB Physical Climate Risk Financial Model designed…

🔥 Premium Tokenomics & Web3 Token Launch Financial Model A…

Premium Green Hydrogen Production Levelized Cost of Hydrogen model for…

🚀 Premium eVTOL / Urban Air Mobility Financial Model A…

A premium Nuclear Fusion Project Finance Model designed for evaluating…

🚘 Premium Autonomous Vehicle / Robotaxi Fleet Operations Financial Model…


A 26-tab capital allocation system: 20 projects over 25 years,…

Evaluate a Buy Now Pay Later platform from transaction growth…

10-year financial model for a meat processing facility providing forecasts,…

10-year financial model for a farmland investment fund providing forecasts,…

10-year financial model for a Yacht & Sailing club providing…

A specialized Excel valuation model for longevity and anti-aging biotechnology…


Download our fully automated 2026 Semiconductor fab Excel model. Includes…

An integrated IFRS 16 lessee model for lease-level measurement, portfolio…

An integrated 10-year real estate portfolio model for underwriting and…

An institutional-style, fully editable model for probability-adjusted pharmaceutical valuation, commercial…

A decision-ready U.S. clean-energy tax-credit model for evaluating post-OBBBA §48E…

Build, compare and stress-test five major Sukuk structures in one…


A professional Excel and Google Sheets financial model for battery…


The Hotel Development & Acquisition Model Pro is an institutional-grade…


A Solar + BESS template is a pre-built Excel financial…


This financial model provides a complete investment framework for a…

FinModelAI Multifamily Development Model Pro is an institutional-grade Excel template…

10-year financial model for a ski resort development providing forecasts,…

10-year financial model for a surf club providing forecasts, profitability…

15-year financial model for a cassava farm and processing plant…

Professional oil and gas modeling bundle with two fully editable…

A professional Excel financial model for residential building development projects…

The Data Center Development Financial Model by PDMM is a…

🏦 Leveraged Buyout Financial Model Bundle — Lite + Pro…

🚀 A professional Private Equity Buy-and-Build Roll-Up M&A Financial Model…

This Excel model is built for a hybrid P2P +…

A complete, editable Veterinary Clinic Financial Model Pro built for…

Plan, forecast and value a full-service events company with this…


This Excel-based 10-Project Financial Modeling Platform is designed as a…

FinModelAI Solar + BESS Project Finance Model Pro is an…

Very comprehensive 20 Year 169-tab Excel template for a Battery…

A professional Excel and Google Sheets financial model built for…


Fin-Wiser’s Solar Off-Grid Hybrid & BESS Financial Model helps users…
How to Calculate the Internal Rate of Return for Investments

The internal rate of return, also known as the IRR is the interest rate at which the net present value (NPV) of all the cash flows from a project equal zero. The term internal was derived from the fact that it excludes external factors such as inflation, cost of capital, or other various financial risks. In other words, the internal rate of return is the expected rate of return that will be earned on a project. It is usually used to evaluate if the project or investment is attractive. Basically, if the IRR of a new project exceeds a company’s required rate of return then that project is desirable, otherwise, the project is not worth it.
Another way of calling the internal rate of return of a project or investment is the “annualized effective compounded return rate” which sets the NPV of all cash flows, both positive and negative, from the project equal to zero. Therefore, it is the interest rate at which the NPV of the forecasted cash flows is equal to the initial investment and also it can be the discount rate at which the total present value of expenses (costs) equals to the total present value of the positive cash flows. Basically, the IRR is designed to account for the time preference of money and investments since a given ROI (return on investment) is worth more at a given time compared to the same amount of return received at a much later time.
In conclusion to what is IRR is that it is the discount rate which enables the present value of the expected cash inflows (after tax) equal to the present value of the estimated cash outflows of the project. If the IRR is greater than the required rate of return, then accept the project. On the other hand, if the IRR is less than the required rate of return, reject the project.
Defining IRR and Its Significance in Financial Analysis
The Internal Rate of Return (IRR) is a fundamental metric in financial analysis, often used to evaluate the profitability of potential investments. At its core, IRR represents the discount rate that makes the net present value (NPV) of all cash flows from a particular project equal to zero. In simpler terms, it’s the rate at which an investment breaks even in terms of NPV. The IRR is expressed as a percentage, and a higher IRR indicates a more profitable investment opportunity. Given its emphasis on cash flow over time, IRR provides a dynamic measure of an investment’s potential profitability, accounting for the time value of money.The significance of IRR in financial analysis is manifold. Firstly, it enables investors and business managers to compare and rank multiple investment opportunities. By calculating the IRR for different projects, decision-makers can identify which projects are expected to yield the highest returns. Furthermore, IRR is crucial for capital budgeting, helping companies allocate their limited resources to the most promising ventures. It is particularly valuable when assessing long-term projects where the timing and magnitude of cash flows are uncertain. Thus, IRR serves not just as a profitability metric but as a comprehensive tool for evaluating and benchmarking investment performance. Its ability to offer a clear depiction of potential returns makes it an indispensable component of financial analysis and strategic decision-making.
Why IRR is a Crucial Metric for Evaluating the Profitability of Investments

The Internal Rate of Return (IRR) is a cornerstone metric in financial analysis owing to its ability to precisely gauge the profitability of potential investments. At its core, IRR represents the discount rate that makes the net present value (NPV) of all cash flows from an investment equal to zero. This makes it incredibly valuable for investors, as it encapsulates the time value of money—an essential principle that acknowledges that a dollar today is worth more than a dollar tomorrow. In simpler terms, IRR allows investors to determine the annualized rate of return on an investment, factoring in both the magnitude and timing of each cash flow. This offers a holistic view of projected profitability, which is critical for making informed investment decisions.
One major reason why IRR is such a crucial metric is its utility in comparing diverse investment opportunities. By providing a single percentage figure representing the expected annual yield, IRR offers a straightforward way to rank multiple projects or assets. For instance, if an investor is considering several different ventures—ranging from real estate developments to stock market investments—the IRR enables an apples-to-apples comparison. This is particularly valuable when capital budgeting is concerned, as it assists businesses in prioritizing projects that promise the highest returns relative to their cost of capital. In essence, ventures with an IRR exceeding the required rate of return are considered viable, while those falling below this threshold are typically set aside, thereby streamlining the decision-making process.
From a practical standpoint, IRR’s ability to simplify complex financial evaluations cannot be overstated. Entrepreneurs and business managers leverage IRR to forecast project viability and secure funding from investors and banks. For instance, in real estate, developers might use IRR to assess the profitability of a new building project, weighing the anticipated income from rents against the construction and maintenance costs over time. Similarly, corporate finance teams deploy IRR in mergers and acquisitions to determine whether the prospective returns justify the investment, thus playing a vital role in strategic planning.
Furthermore, IRR aids in scenario analysis, allowing stakeholders to project the impact of various financial conditions on an investment’s performance. By tweaking input variables such as cash flow estimates or timelines, decision-makers can explore different outcomes and their associated IRRs, offering a robust framework for risk assessment. This adaptability makes IRR a versatile tool across a myriad of sectors, reinforcing its status as an indispensable metric in investment appraisal.
Types of IRR for Different Types of Cash Flows

The internal rate of return is a time value of money metric which represents the true annual rate of earnings on an investment. Depending on the type of cash flow of a project, there are different types of IRR that can be calculated, such as:
- Unlevered IRR – also known as the unleveraged IRR or Project IRR, is the internal rate of return of a string of cash flows without financing or the Free Cash Flow to Firm (FCFF). It takes its inflows that are needed to fund the project without accounting any debt or funding used for the project. Before accounting any funding from the outside sources, it is better to evaluate the project’s own feasibility by calculating the unlevered IRR. Therefore, it is usually recommended to determine the Unlevered IRR before proceeding with Levered IRR to check if the project is financially healthy or not.
- Levered IRR – also known as the leveraged IRR or Equity IRR, is the internal rate of return of a string of cash flows with financing included or the Free Cash Flow to Equity (FCFE) which means cash flows available for equity holders. Instead of using its inflows as funding, it takes account the debt or the funding to use for the project. The outflows are considered as cash flows from the project minus any interest and debt repayments. Basically, it is a case where the project is funded by a mix of debt and equity.
- Investor IRR – also known as the Cash in / Cash out to investor where the cash in represents the investment provided and the cash out represents the dividends or the sale of the investment. The investor IRR is basically exclusive for investors to calculate the share they’ll get according to the amount of investment they poured into the project.
Uses of Internal Rate of Return
The internal rate of return is a popular profitability measure because, as a percentage, it is easy to understand and easy to compare to the required return. It is a metric used in capital budgeting to help determine the profitability of potential investments. There are many uses of the internal rate of return, such as the following:- Determining the Profitability of a Project or an Investment. Usually, IRR is used in capital budgeting for corporations to compare the profitability of capital projects. To evaluate if a certain project will yield more than the costs of running the project, or to determine which project will yield more based on the IRR. To ensure maximizing the returns, the higher a project’s IRR is, the more attractive it is to proceed with the project. In cases where there are multiple projects, the ones with the highest IRR will be considered first.
- To Maximize the Net Present Value as an indication of profitability, efficiency, quality, or yield of an investment. Though there are similarities between the IRR and NPV, the latter is more of an indicator of the net value added by making an investment. By applying the IRR method, any investment would be accepted because if the IRR exceeds the cost of capital represents that the project or investment has a positive net present value.
- To Calculate the Fixed Income (calculating yield to maturity and yield to call).
- Measuring new debt in terms of yield to maturity which often is used when a company raises a new debt for funding new projects. Since both IRR and NPV are applicable to liabilities as well as investments, in this case, the lower the IRR is, the more preferable it is for the company.
- Evaluating share issues and stock buyback programs for corporations. This is in case the company wants to proceed with repurchasing their stocks and if the returning capital to the shareholders has a higher IRR that the candidate capital investment projects.
- Used for Private Equity from the limited partner’s perspective, to measure the general partner’s performance as an investment manager. The IRR is used since it’s the general partner that controls the cash flows including the draw-downs of committed capital.
- Analyzing projects or investments for private equity and venture capital which involves multiple investments over the life of a business and cash flow at the end through the sale of the business.
- Determining the returns of the projects or investments and to compare or rank multiple projects based on their expected yield to prefer the ones with a resulting higher IRR.
- To better understand and know of any user’s risk tolerance, investment needs, avoiding risky investments/projects, etc.
In conclusion, the calculation of IRR and its analysis can help determine which potential projects are worth investing for. But, it is only as accurate as the assumptions that drive it and that a higher percentage doesn’t always mean that it is the most feasible due to the timing and size of cash flows, leverage used, and differences in the return assumptions.
How to Calculate the Internal Rate of Return
There isn’t really a concrete way on how to calculate irr but there are two ways which could help you by simply using a tool such as Excel. The first way to calculate the IRR in Excel is making use of its built-in functions. The Excel IRR function is one of the financial function available in Excel that helps calculate the IRR. It returns the irr for a series of cash flows that occur at regular intervals. Syntax / Function Formula: =IRR (values, [guess]) Where: Values - represents an array or reference to cells that contain values and represent the series of cash flows which include investment and net income values. It is required to input such data for the function to work. Guess - an estimate for expected IRR or the number assumed by the user that is close to the expected irr. It is optional to input since the function can simply take a default value of 10%. Below is a simple example which shows how IRR function is used. As shown above, the initial investment is negative since it is considered as an outgoing payment. The values after that represent the cash inflows which comes in the form of positive values. By simply using the IRR function in Excel, the calculation of the IRR became easier. The only downfall about this function is that it is not designed to calculate compound growth rate so when calculating the data with different cash inflows, you will have to change it such as below:

To understand how the IRR with a compound growth is calculated using the Excel IRR Function, let us do a reverse check to see if the resulting value is right. This can be simply done by using the following formula which is usually used to calculate compounded annual growth rate or CAGR. CAGR = (End Value / Start Value) ^ (1 / Periods) – 1 We will then apply the same formula to manually calculate the IRR which is shown below:
 Now that you know the first way on how to calculate irr, the second way is to break out all the component cash flows as you calculate each step individually, then using the resulting values as inputs for the IRR formula. Basically, to calculate the internal rate of return, the expected cash flows of a project must be provided and the NPV must equal to zero. The formula below shows how to calculate IRR:

For example: A company is deciding whether to purchase an equipment for $400,000. The equipment would only last for 3 years but it is expected to generate annual profit for $200,000. After the equipment reaches its end, the company plan to salvage it and expects to receive about $20,000. By using IRR, the company can determine whether to make use of its own cash rather than go for investment options, which should return about 10%. Here is how the IRR calculation looks like according to the drawn scenario above: 0 = -$400,000 + ($200,000) / (1 + r) + ($200000) / (1 + r)^ 2 + ($200,000) / (1 + r)^3 + $50000 / (1 + r)^4 The investment’s IRR will serve as the rate that makes the present value of an investment’s cash flows equal to zero. If the resulting rate is greater than the expected 10% then it can be said that the investment is feasible.
Importance of IRR in Finance

The Internal Rate of Return (IRR) holds substantial importance in the realm of finance, primarily for its role in investment decision-making. One of the foundational concepts behind IRR is the time value of money, which dictates that a sum of money today is worth more than the same sum at a future date due to its earning potential. By calculating the IRR, financial analysts can determine the discount rate that sets the net present value (NPV) of all cash flows (both inflow and outflow) from an investment to zero. This computation provides a pivotal insight into the efficiency, quality, and yield of an investment.
Understanding the relationship between IRR and the required rate of return is crucial for making informed decisions. The required rate of return is the minimum return that an investor expects to receive from an investment, accounting for its risk profile and the opportunity cost of capital. When the IRR is higher than the required rate of return, it signals a desirable investment as it promises to generate returns above the minimum threshold. Conversely, an IRR lower than the required rate suggests that the investment might not meet the investor's expectations, prompting a re-evaluation of other investment opportunities. This relationship underscores IRR's utility in screening and selecting projects that contribute to maximizing shareholder wealth.
Moreover, the IRR is instrumental in comparing multiple investment opportunities. It provides a common metric across different projects, allowing investors to measure and rank projects based on their potential profitability. For capital budgeting, where companies decide how to allocate their limited capital among various projects, IRR serves as a critical tool. By evaluating the IRR of each project, businesses can prioritize investments that yield the highest returns, thus optimizing their capital expenditure and fostering growth. The capacity to influence strategic decisions underpins the significance of IRR in finance, making it an indispensable metric for both investors and financial managers.
In essence, mastering the concept of IRR enables stakeholders to gauge the profitability of investments more accurately, ensuring informed and rational investment decisions that align with their financial goals and risk tolerance. This comprehension of IRR enhances the strategic allocation of capital, thereby driving more efficient and effective financial management.
Time Value of Money in IRR Calculations
The principle of the time value of money (TVM) is a cornerstone of financial analysis and is fundamental to understanding Internal Rate of Return (IRR) calculations. TVM posits that a dollar today is worth more than a dollar in the future due to its potential earning capacity. This core concept is what underpins the calculations of IRR, guiding investors in determining the value of future cash flows in present terms. When calculating IRR, the focus is on identifying the discount rate that equates the net present value (NPV) of all cash flows associated with an investment to zero. Essentially, IRR internalizes the time value of money by providing a metric to gauge an investment's profitability over time, considering both the amount and the timing of each cash flow.In practical terms, when you calculate the internal rate of return, each future cash flow is discounted back to its present value at the IRR rate. This represents the rate at which an investment's future cash flows can be discounted to match the initial investment outlay. For instance, if an investor puts $1,000 into a project and expects to receive $1,200 after one year, the time value of money helps determine if the investment is worthwhile by comparing the future cash inflow to the initial investment, considering the potential earnings if the money were invested elsewhere. By understanding IRR alongside TVM, investors can make informed capital allocation decisions, ensuring that the funds are invested in projects yielding the highest returns while considering the value of time.
The Relationship of IRR and Required Rate of Return
The relationship between the Internal Rate of Return (IRR) and the required rate of return (also known as the hurdle rate) is central to investment decision-making. IRR is the discount rate that makes the net present value (NPV) of all cash flows from a particular project equal to zero. In other words, it’s the break-even interest rate that an investment is expected to generate. The required rate of return, on the other hand, is the minimum return that investors expect to achieve from an investment, considering its risk and opportunity cost. The interplay between these two rates determines the attractiveness of an investment.When evaluating the profitability of a project, comparing the IRR to the required rate of return offers valuable insights. If the IRR exceeds the required rate of return, it suggests that the project is likely to yield a return greater than the minimum acceptable to the investors, making it a favorable investment. Conversely, if the IRR falls below the required rate of return, the project is likely deemed unattractive as it doesn't meet the investors' threshold for acceptable risk and reward. For example, if a project has an IRR of 12% but the required rate of return is 15%, this implies the project may not compensate adequately for its risk profile, and investors might reject it despite its potential profitability.
Understanding the relationship between IRR and the required rate of return helps stakeholders make informed capital allocation decisions. For instance, a real estate developer might use IRR to evaluate whether a new property development will meet the desired financial returns compared to alternative investment opportunities. By assessing whether the IRR surpasses the required rate of return, the developer can determine if the project aligns with financial goals and risk tolerance.
In corporate finance, this relationship plays a crucial role during the budgeting process. Companies often have multiple projects competing for limited resources. By calculating IRR for each project and comparing it to a predetermined hurdle rate, managers can prioritize projects that offer the highest potential returns, thereby optimizing capital allocation. Moreover, venture capitalists and private equity investors extensively use this comparison to evaluate startup investments, where the required rate of return often factors in significant risks and expected high rewards.
In conclusion, the dynamic between IRR and the required rate of return is a critical metric that influences investment decisions. It ensures that only projects that meet or exceed the risk-adjusted benchmarks advance, thereby aligning project selection with strategic financial objectives. Understanding and leveraging this relationship equips investors, managers, and financial analysts to make well-informed, prudent investment choices.
How IRR Influences Investment Choices and Capital Budgeting Decisions
The Internal Rate of Return (IRR) is a pivotal metric in the realm of finance, serving as a crucial determinant for making informed investment choices and capital allocation decisions. Essentially, IRR represents the discount rate that makes the net present value (NPV) of all cash flows from a prospective investment equal to zero. In simpler terms, it reflects the expected annualized rate of return on an investment, considering both the initial outlay and subsequent cash inflows over time. This makes IRR a fundamental tool for comparing the profitability and feasibility of various investment opportunities, endowing financial analysts and business leaders with the clarity needed to prioritize projects that maximize value.One of the most compelling reasons why IRR holds such sway in investment choices and capital budgeting is its ability to compare disparate projects on a uniform basis. For instance, when a company faces multiple investment options, each with different cash flow profiles, IRR offers a single metric to gauge potential returns. Firms typically set a "hurdle rate" or a minimum required rate of return based on their cost of capital or other strategic considerations. Projects with an IRR that exceeds this hurdle rate are generally considered favorable, while those falling below are either shelved or re-evaluated for risk, feasibility, or strategic alignment. This simplified yet rigorous approach not only aids in optimizing capital allocation but also ensures that investments contribute positively to the company's value in the long term.
Moreover, IRR's role is equally significant within the broader framework of capital budgeting. This process involves deciding how to deploy financial resources among various long-term projects or assets to maximize shareholder value. By focusing on the IRR, decision-makers can better understand the efficiency and expected profitability of each investment option. For example, in industries with cyclical revenue streams such as real estate development or energy projects, the IRR provides a clear picture of future returns adjusted for the timing and risk of cash flows. This assists in balancing the portfolio, mitigating risks, and securing optimal growth paths. Beyond sheer numbers, IRR also incorporates the concept of the time value of money, thereby reinforcing prudent financial planning and reinforcing the strategic vision of the business.
In conclusion, the IRR is more than just a figure; it’s a comprehensive indicator of an investment's potential to enhance business value. Its ability to provide a standardized measure for evaluating diverse investment opportunities makes it indispensable in investment planning and capital budgeting. By adopting IRR, businesses can prioritize high-yield projects, ensure efficient capital usage, and ultimately drive sustainable financial growth.
Conclusion
Calculating the IRR can be a time-consuming task, hence, instead of manually doing it, you can simply take advantage of today’s tools such as a financial model template that includes the calculation of the IRR. This is a much preferable option since a financial model is flexible, detailed, easy to audit and edit, as well as transparent.If you are looking for a financial model template with IRR calculation, simply check out our list up top. There, you will find industry-specific financial model templates as well as for different use cases. The templates are ready-made by financial modeling professionals with substantial experience and a wide range of know-how which most users are badly in need of.
You can also get different kinds of financial model templates in Excel here at eFinancialModels. These templates are available for download by any kind of users from different countries such as in the USA, Germany, Switzerland, Japan, Saudi Arabia, Egypt, and many more who are in need of help when it comes to their financial modeling tasks.
You might also like:
- How to Calculate Net Present Value (NPV)?
- Leveraged vs. Unleveraged IRR: What You Need to Know
- IRR vs NPV in the Context of Financial Decision-Making
- 10 Main Elements of a Business Plan
- Understanding the Debt Service Coverage Ratio: An Essential Metric for Financial Analysis
- How to Make Smart Decisions with 6 Key Financial Metrics?
- How to Calculate the Compound Annual Growth Rate (CAGR)
- 5 Best Practices for Managing Days Receivables
- 5 Practical Tips to Help Raise Funds For Startups
- Investment
- Financial Planning Retirement Tips
- Top 5 Tips For a Good Financial Due Diligence
- Examples of Result-Oriented Financial Modeling in Excel
- Cash Flow Analysis in Excel
- Financial Ratios Analysis and Its Importance
- Understanding the Levelized Cost of Energy Formula
- Financial Modeling using Excel
- Financial Model
- Understanding What is Yield to Maturity and Why It Matters
- Business Valuation