
0 ITEMS

Fintech Mobile App Financial Model
A comprehensive editable, 3-statement MS Excel spreadsheet for tracking Fintech Mobile App finances. Income Statements, Balance Sheets, & Cash Flow Statements, provide a comprehensive view of financial performance.


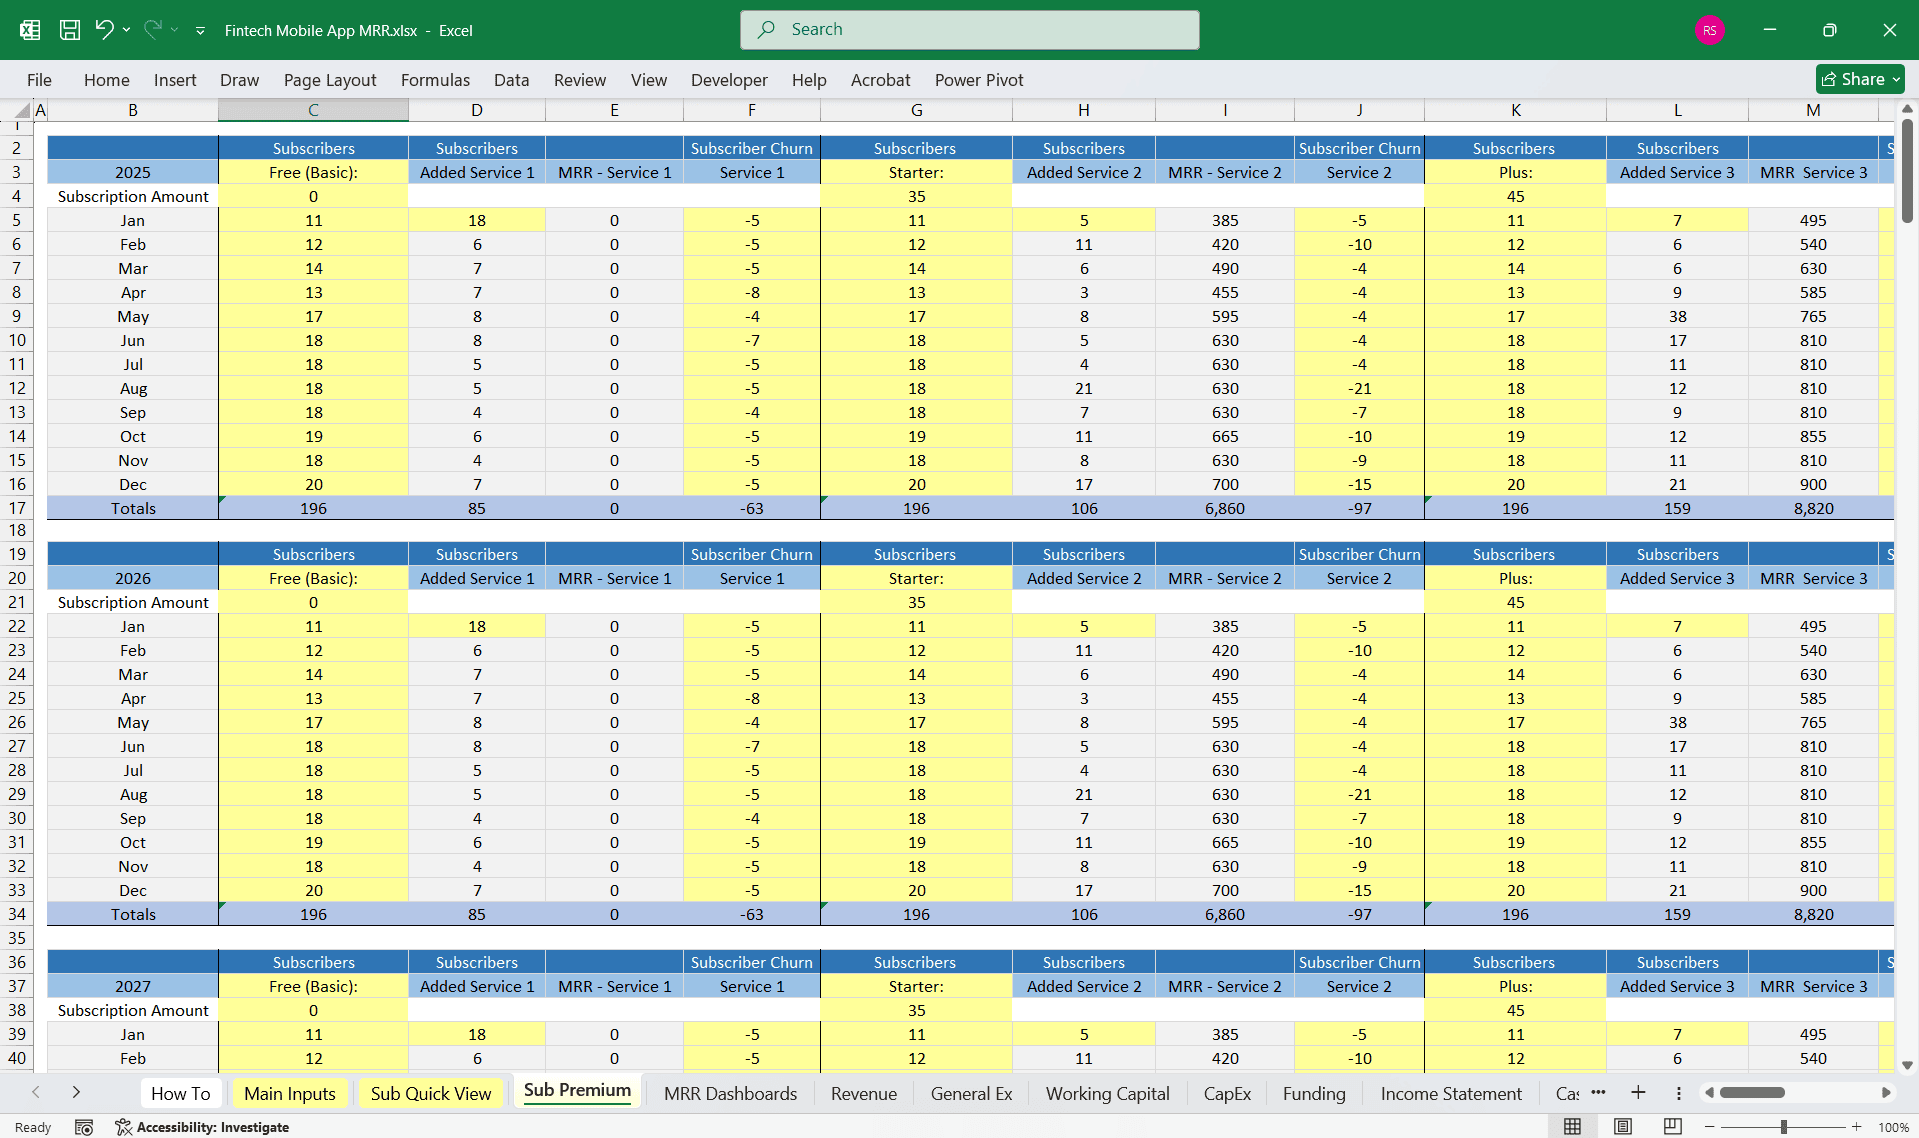


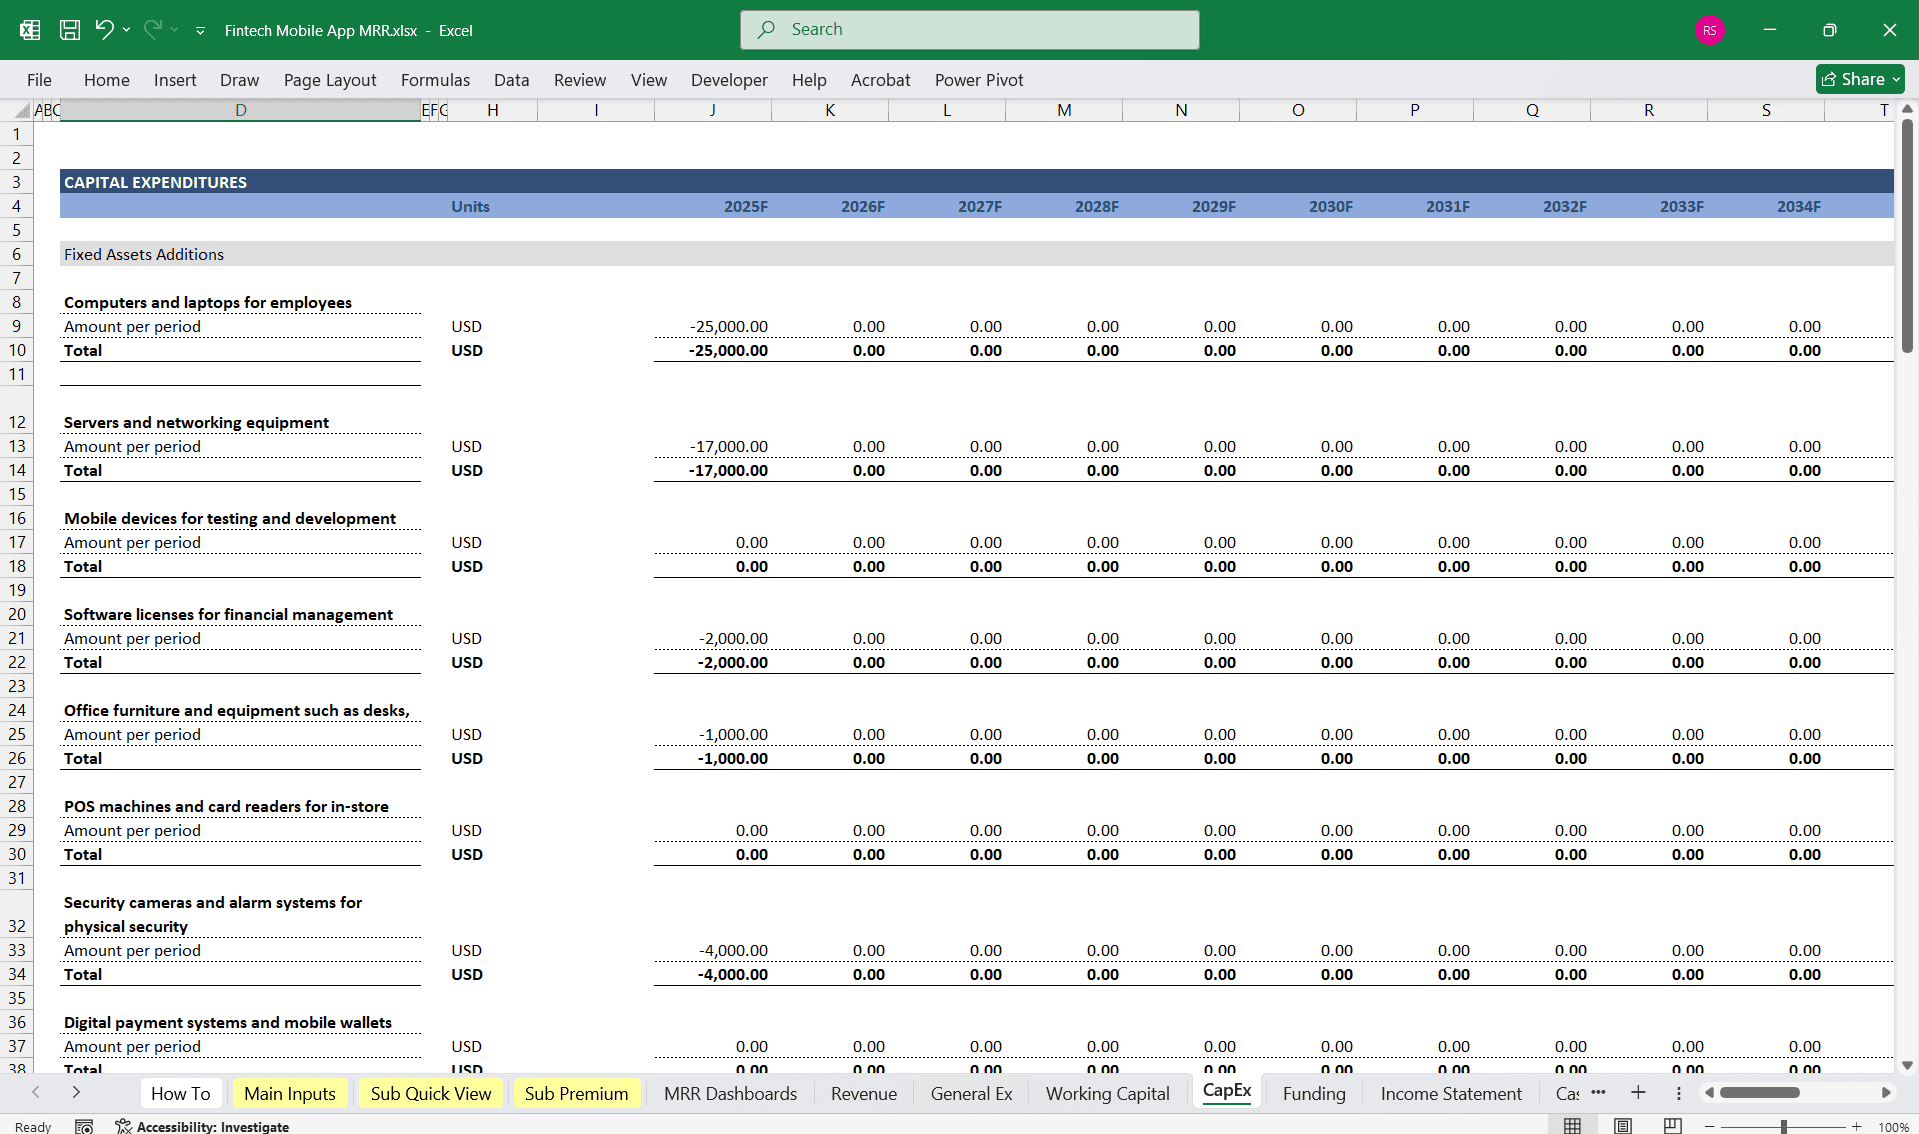


A 3-Statement Financial Model for a Fintech App that covers the Income Statement, Cash Flow Statement, and Balance Sheet while incorporating multiple revenue streams.
Here’s a structured 6-tier subscription model for your Fintech Mobile App, designed to cater to different customer needs:
1. Free Tier (Basic)
– Features:
– View account balances
– Transaction history (last 30 days)
– Basic budgeting tools
– Limited customer support (email only)
– Ads displayed
– Target Audience: Casual users, students, or those exploring the app.
2. Starter Tier
– Everything in Free Tier +
– Unlimited transaction history
– Custom budget categories
– Basic financial insights & alerts
– Priority email support
– Remove ads
– Target Audience:** Individuals looking for basic money management tools.
3. Plus Tier
– Everything in Starter Tier +
– AI-powered financial insights
– Credit score tracking
– Bill reminders & automated savings suggestions
– Limited investment tracking
– Chat-based customer support
– Target Audience:** Users seeking a more advanced personal finance experience.
4. Premium Tier
– Everything in Plus Tier +
– Advanced investment tracking (stocks, crypto, real estate)
– Multi-account aggregation (connect multiple banks, PayPal, etc.)
– Fraud detection & alerts
– Smart financial goal-setting tools
– Phone support with financial advisors (limited to 2 sessions/month)
– Target Audience:** Serious budgeters & early investors.
5. Pro Tier
– Everything in Premium Tier +
– Personalized AI-driven investment recommendations
– Tax optimization insights
– Advanced credit analysis & improvement tips
– International currency tracking
– Unlimited access to financial advisors (via chat & phone)
– Target Audience:** High-income professionals & investors.
6. Elite Tier
– Everything in Pro Tier +
– Dedicated financial advisor (1:1 support)
– Exclusive investment opportunities (private equity, pre-IPOs, etc.)
– Advanced tax planning with CPA integration
– Custom financial reports & wealth management tools
– Priority 24/7 concierge support
– Target Audience:** High-net-worth individuals & financial power users.
1. Income Statement
The income statement outlines the company’s financial performance, focusing on revenue, expenses, and profitability.
Revenue Streams
- Subscription Fees – Recurring revenue from users subscribing to the app for premium features or access.
- Transaction Revenue Sharing – A percentage of fees from financial transactions processed through the platform.
- Advertising Revenue – Income from ads displayed within the app (e.g., banners, sponsored content).
- Partnerships & Sponsorships – Revenue from collaborations with financial institutions, brands, or other fintech firms.
- Data Monetization – Revenue from anonymized user data insights sold to third parties.
- Affiliate Marketing – Commissions earned by directing users to partner financial products (e.g., credit cards, loans).
- White-Label Solutions – Revenue from selling the app’s technology to other businesses under a different brand.
Revenue Section
Total Revenue = Sum of all revenue streams
Operating Expenses
- Cost of Goods Sold (COGS) – Direct costs related to payment processing and third-party API fees.
- Sales & Marketing Expenses – User acquisition costs, advertising, influencer partnerships.
- Research & Development (R&D) – Software development, AI enhancements, security improvements.
- General & Administrative (G&A) – Salaries, office expenses, legal, compliance costs.
- Technology & Infrastructure – Cloud hosting, data storage, cybersecurity costs.
- Customer Support & Compliance – Call centers, regulatory compliance team expenses.
Operating Profit (EBITDA) = Total Revenue – Total Operating Expenses
Non-Operating Items
- Depreciation & Amortization – Software development cost amortization.
- Interest Expenses – Loans or financing costs.
- Taxes – Corporate income tax.
Net Income = Operating Profit – (D&A + Interest + Taxes)
2. Cash Flow Statement
The cash flow statement categorizes cash movements into operating, investing, and financing activities.
Operating Cash Flow
- Cash Receipts from Revenue Streams (subscriptions, transactions, ads, partnerships).
- Cash Payments for Operating Expenses (marketing, salaries, infrastructure).
- Adjustments for Non-Cash Items (depreciation, stock-based compensation).
Net Operating Cash Flow = (Cash Inflows – Cash Outflows)
Investing Cash Flow
- Capital Expenditures (CapEx) – Development of app features, and security enhancements.
- Acquisitions or Investments – Purchasing complementary fintech startups or assets.
- Investment in R&D – AI-powered features, fraud detection.
Net Investing Cash Flow = (Investment Inflows – Investment Outflows)
Financing Cash Flow
- Equity Financing – Funds raised from investors.
- Debt Financing – Loans or credit lines.
- Dividends/Buybacks – Payments to shareholders if applicable.
Net Financing Cash Flow = (Funds Raised – Debt Repayments – Dividends)
Ending Cash Balance = Net Operating Cash Flow + Net Investing Cash Flow + Net Financing Cash Flow + Beginning Cash Balance
3. Balance Sheet
The balance sheet provides a snapshot of the company’s financial position.
Assets Current Assets
- Cash & Cash Equivalents – Money in the bank.
- Accounts Receivable – Outstanding revenue from partnerships and subscriptions.
- Prepaid Expenses – Paid but not yet incurred costs (e.g., prepaid software licenses).
Non-Current Assets
- Intangible Assets – Software development costs, patents.
- Property, Plant & Equipment (PP&E) – Server infrastructure, office equipment.
Liabilities Current Liabilities
- Accounts Payable – Unpaid operating expenses.
- Deferred Revenue – Subscription fees received in advance.
- Short-Term Debt – Loan repayments due within 12 months.
Non-Current Liabilities
- Long-Term Debt – Loans or bonds payable beyond one year.
Equity
- Common Stock – Investor funding.
- Retained Earnings – Profits reinvested into the business.
Balance Sheet Equation:
Assets = Liabilities + Equity
Key Takeaways
- The Income Statement shows revenue growth and profitability.
- The Cash Flow Statement tracks liquidity and cash movements.
- The Balance Sheet reflects financial health and company value.
Similar ProductsOther customers were also interested in...



 Giorgos
Buy Now Pay Later (BNPL) Platform – 5 Year F...
Financial Model presenting an advanced 5-year financial plan for a startup BNPL Platform which provi... Read more

Fintech Financial Models Bundle
Financial technology (better known as fintech) is used to describe new technology that seeks to impr... Read more
 Eastwich Advisors
Debt Fund Excel Model
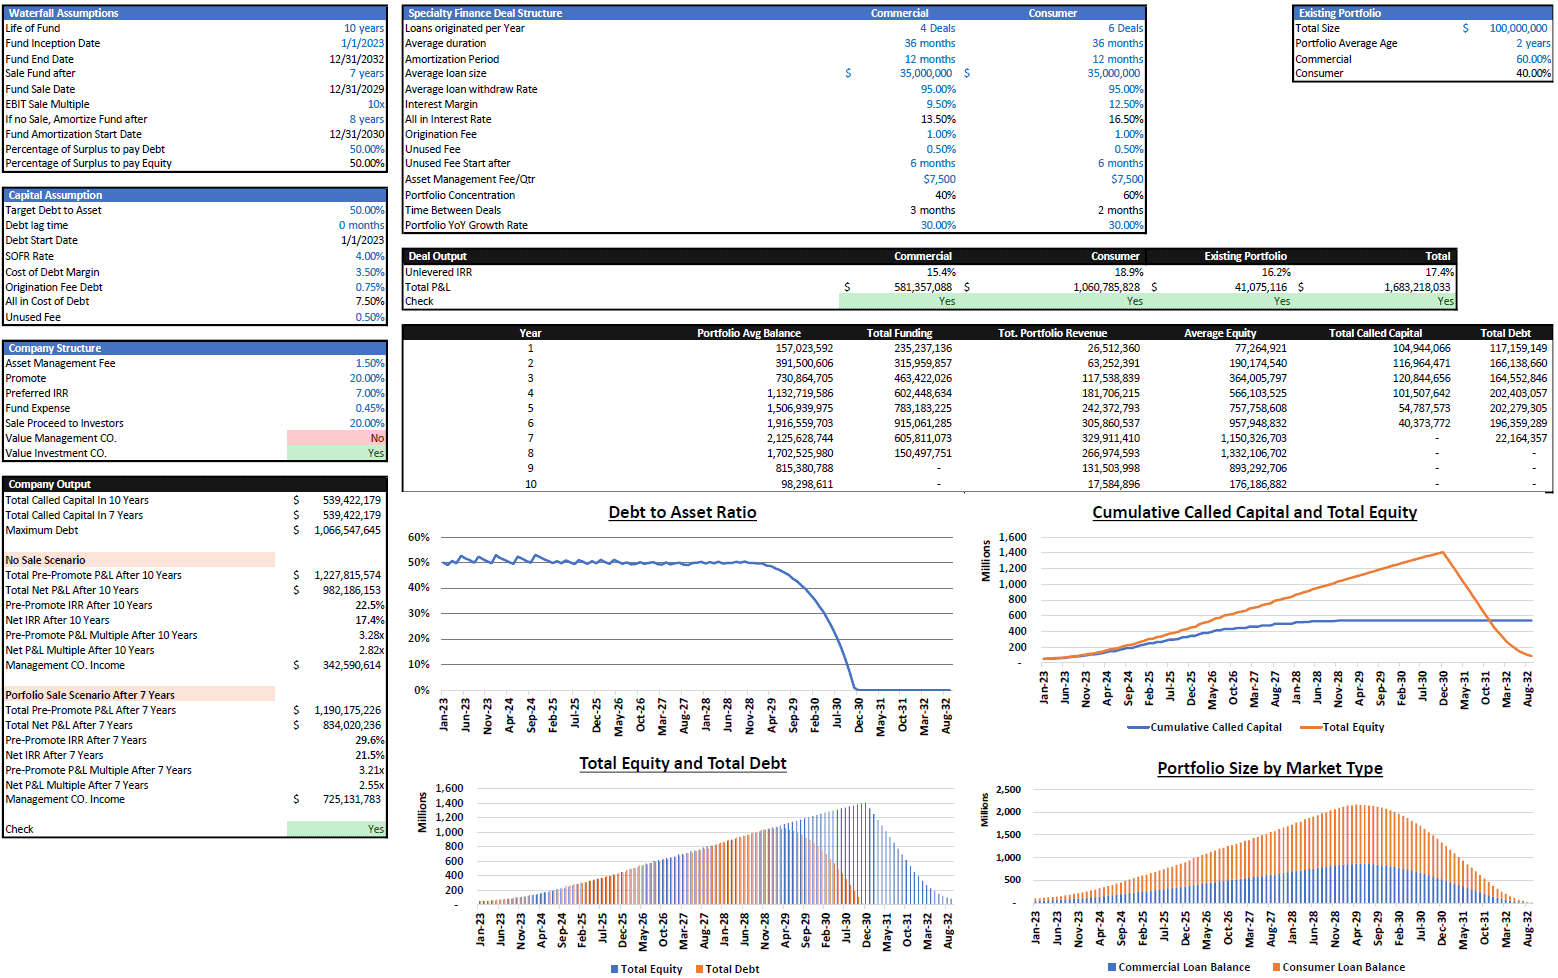
Explore the Debt Fund Excel Model, a comprehensive tool for evaluating new credit fund opportunities... Read more
 anthony
Bundle – Business Financial Forecasting Mode...
The purpose of this Bundle of Business Forecasting and Financial Models is to assist Business Owners... Read more

Online Payments Platform – 5 Year Financial Mode...
Financial Model providing an advanced 5-year financial plan for a startup Online Payments Platform p... Read more

Crowdlending (P2P) Platform – 5 Year Financi...
Financial Model providing an advanced 5-year financial plan for a startup Crowdlending (Peer-to-Peer... Read more

Microfinance Platform – 5 Year Financial Model
Financial Model presenting an advanced 5-year financial plan for a Microfinance Lending Platform pro... Read more

 Andreas
Buy Now Pay Later DCF Model & Valuation (10 Ye...
The Buy Now Pay Later (BNPL) Company financial model is a comprehensive tool designed to analyze the... Read more
You must log in to submit a review.