
0 ITEMS

Cash Flow Analysis
Cash flow analysis is a critical financial exercise that examines the inflow and outflow of cash within a business over a specific period. It provides insights into a company's liquidity, solvency, and overall financial health. By analyzing cash flows, businesses can identify patterns, anticipate future cash needs, and ensure they maintain adequate reserves for operations and investments.
Our financial model templates include comprehensive tools for cash flow analysis, breaking down cash flows into operating, investing, and financing activities. These tools allow users to forecast cash flow trends, assess the impact of business decisions on cash reserves, and ensure that the business remains cash-positive. Whether you're a small business monitoring daily cash operations or a larger enterprise evaluating long-term cash flow strategies, our templates offer a structured approach to cash flow analysis, ensuring informed and proactive financial management. The analysis of the reasons for a change in cash is normally done by analysing a company's cash flow statement.


Buy-side underwriting for a US utility-scale solar plant that is…

Days sales outstanding is the number every trade business quotes…

Find out which assets in your hire fleet actually earn…
The 13-week cash flow is the standard instrument of a…
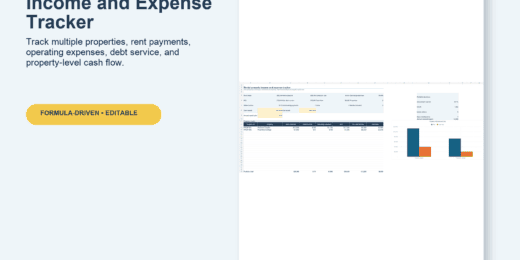

A ready-to-use, multi-format rental property tracking workbook for landlords and…
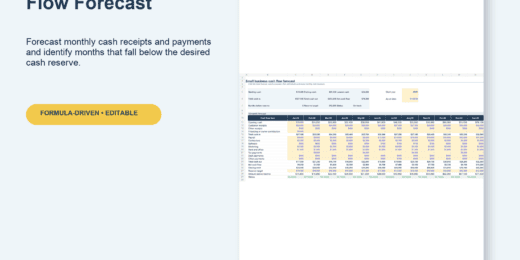
A ready-to-use, multi-format cash flow forecasting workbook for small businesses.…


Bankable Financial Model for Utility-Scale Solar PV Project Finance This…


EU Battery Passport, Recycled Content & Compliance Economics Model 🔋…

AI Data Center Power Procurement & Behind-the-Meter Generation Model ⚡…

⚡ Model the grid-connection decision before delay, network upgrades, deposits,…
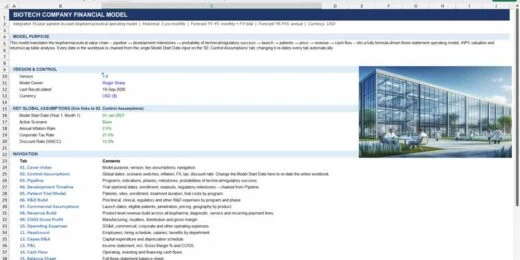

Model the entire drug development lifecycle, from preclinical research through…


Excel model for startup financial planning: revenue projections, cap table,…

Excel model to analyze real estate investment deals — NOI,…

Excel system for agencies and consultants: client profitability, team utilization,…

🔥 Premium AI / LLM Company Valuation Financial Model A…
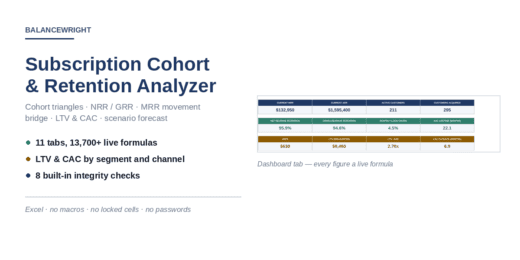

Give this workbook one row per customer per month and…
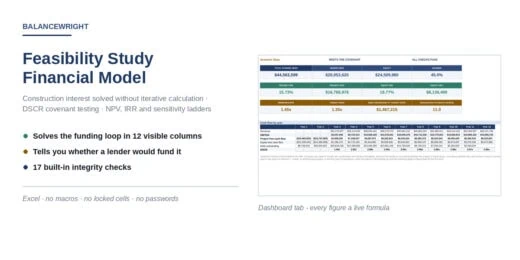
A feasibility study exists to answer two questions, and most…

This comprehensive workbook models the intricate flow of funds unique…


10-year financial model for a biomethane RNG plant providing forecasts,…

15-year financial model for a rice farm providing forecasts, profitability…



A ready-to-use Battery as a Service (BaaS) Financial Model Template…

Small Hydropower Bankable Financial Model — Summary This is a…
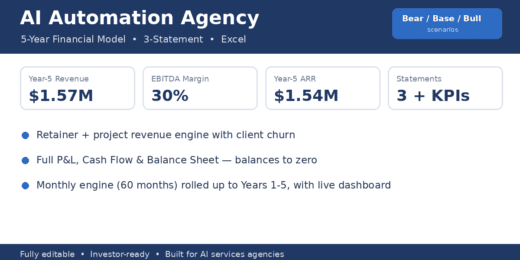

A 5-year, fully editable Excel model built specifically for AI…


Underwrite a mobile home park deal in minutes: a model…

Plan and forecast your film production business with a ready…
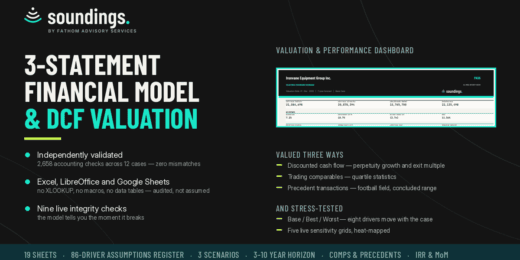

An integrated three-statement operating model valued three ways: discounted cash…

A 30-module editable Excel model for multinational Pillar Two analysis,…

A 32-sheet editable Excel decision model for EU CBAM importers…

Evaluate a vending-machine business from individual machine economics to location…


Underwrite multifamily deals the way institutional buyers do — without…


A rolling 13-week cash flow forecast with weekly buffer alerts,…


Whether you're launching a startup, planning business expansion, preparing for…

Premium 30-year Oil & Gas Upstream and Downstream Financial Model…

Premium TCFD / ISSB Physical Climate Risk Financial Model designed…

🔥 Premium Tokenomics & Web3 Token Launch Financial Model A…

Premium Green Hydrogen Production Levelized Cost of Hydrogen model for…

🚀 Premium eVTOL / Urban Air Mobility Financial Model A…

A premium Nuclear Fusion Project Finance Model designed for evaluating…

🚘 Premium Autonomous Vehicle / Robotaxi Fleet Operations Financial Model…
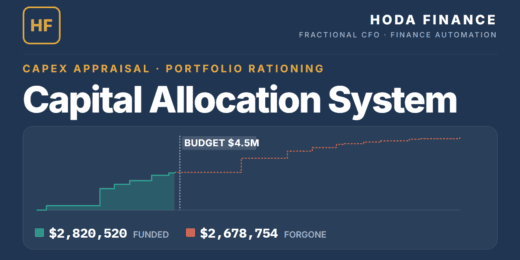

A 26-tab capital allocation system: 20 projects over 25 years,…

Evaluate a Buy Now Pay Later platform from transaction growth…

10-year financial model for a meat processing facility providing forecasts,…

10-year financial model for a farmland investment fund providing forecasts,…

10-year financial model for a Yacht & Sailing club providing…

A specialized Excel valuation model for longevity and anti-aging biotechnology…

Download our fully automated 2026 Semiconductor fab Excel model. Includes…

An integrated IFRS 16 lessee model for lease-level measurement, portfolio…

An integrated 10-year real estate portfolio model for underwriting and…

An institutional-style, fully editable model for probability-adjusted pharmaceutical valuation, commercial…

A decision-ready U.S. clean-energy tax-credit model for evaluating post-OBBBA §48E…

Build, compare and stress-test five major Sukuk structures in one…


Restaurant Menu Engineering & Financial Optimizer is a professional Excel…

Build accurate, bank-ready financial projections for your Mining Company. Download…

10-year financial model for a ski resort development providing forecasts,…

10-year financial model for a surf club providing forecasts, profitability…

15-year financial model for a cassava farm and processing plant…

Professional oil and gas modeling bundle with two fully editable…

A professional Excel financial model for residential building development projects…

The Data Center Development Financial Model by PDMM is a…
How to Do a Cash Flow Analysis

Cash flow analysis is a fundamental tool in sound financial management, offering a clear perspective on a company’s liquidity, solvency, and overall operational health. Without it, businesses risk making uninformed decisions, overlooking potential shortfalls, and failing to allocate resources efficiently. In contrast, conducting a thorough cash flow analysis enables decision-makers to anticipate financial challenges, manage working capital strategically, and support long-term planning.
This article outlines how to do a cash flow analysis and highlights the significant distinctions between businesses prioritizing this practice and those not. We will show you:
- What is cash flow analysis?
- Why does it provide a clearer picture of your business’s liquidity than profit statements?
- Why does cash flow analysis matter?
- Step-by-step guidance on performing a proper cash flow analysis—from gathering financial statements to assessing the results.
- How do you calculate key cash flow metrics? -and-
- How to simplify a cash flow analysis using an Excel template?
Stay on top of your business’s financial performance by mastering effective cash flow analysis steps and metrics!
What is Cash Flow Analysis?
What is cash flow analysis? It's checking how money moves in and out of a business. It helps see if your company earns enough to cover bills, invest, or grow. You get a clear picture of your financial health by tracking cash from operations, investments, and financing. What is cash flow analysis shows when cash runs low or when extra funds are available. Businesses use it to plan, avoid shortages, and make smart decisions.Simply put, what is cash flow analysis means keeping your business financially strong and prepared. Unlike accrual accounting, which can obscure actual liquidity, cash flow analysis provides a direct view of how money moves—ensuring that a business has enough cash to meet its obligations. It is a critical component of financial planning that focuses on the inflow and outflow of cash within a business. It provides insights into the company's liquidity position and ability to meet its financial obligations while supporting strategic decision-making. Understanding how cash flows in and out can help businesses better manage their financial resources and ensure operational efficiency.

Importance of Cash Flow Analysis
While profitability is often seen as the gold standard for success, cash flow keeps the lights on. You might have millions in sales, but if your money is tied up in unpaid invoices or excessive days inventory, you could still be unable to pay your bills. This is where cash flow analysis comes into play. Let's dive into the top 5 reasons why cash flow analysis is essential for any business, regardless of size or industry.- Ensures Liquidity and Solvency: Many businesses fail not because they aren't profitable but because they run out of cash. Cash flow analysis is understanding whether your business can meet its short-term obligations. It clearly shows your cash position—what's coming in, going out, and when. Regular analysis helps ensure you have enough liquid assets to cover rent, payroll, supplier invoices, and tax obligations. Without this insight, even the most promising business can quickly spiral into insolvency.
- Supports Financial Planning: Cash flow projections are a cornerstone of strategic financial planning. Analyzing past trends and anticipating future cash flows allows you to forecast when you'll have cash surpluses or shortfalls. This foresight enables smarter budgeting and better preparation for seasonal highs and lows. Such projections are also critical for startups and growing businesses when presenting business plans to investors or lenders.
- Identifies Operational Efficiency: Your cash flow statement reveals much more than just money movement—it reflects the efficiency of your operations. For example, strong cash flow from operations indicates that your business model is working well and generating enough cash from core activities. On the other hand, negative operating cash flow—even if you're showing a profit on your income statement—can signal issues like bloated inventory, delayed collections, or underpriced services. Regular analysis helps pinpoint these red flags early.
- Improves Investment Decisions: Whether you’re considering a new investment, expansion, or debt repayment strategy, cash flow analysis offers the clarity you need. It helps you understand whether your business can support new initiatives without compromising financial stability. Lenders and investors also heavily rely on cash flow metrics when evaluating your company. A healthy, consistent cash flow can make the difference in securing financing, negotiating better terms, or attracting potential buyers or partners.
- Enhances Risk Management: Business is full of uncertainties—market shifts, customer defaults, and supply chain disruptions. Cash flow analysis allows you to build contingency plans based on actual cash behavior. By monitoring and understanding trends, you can proactively manage risks, reduce reliance on credit, tighten up on late receivables, and avoid surprise cash crunches. This preparedness can be the key to weathering economic downturns or industry-specific disruptions.

Cash flow isn’t just a line item on a financial report—it’s the pulse of your business. Regular cash flow analysis helps you make smarter, faster, and more confident decisions. It bridges the gap between profitability and practicality, giving you the clarity needed to grow sustainably and avoid financial pitfalls.
Steps in Cash Flow Analysis
Understanding how to do a cash flow analysis is key to keeping your business healthy. It helps you see where your money comes from and where it goes. This insight lets you spot problems early, plan better, and make smarter decisions. Whether you're a startup or an established company, mastering how to do a cash flow analysis gives you more control and confidence in every financial move.Step 1: Gather Financial Statements
The first step on how to do a cash flow analysis is to gather the three main financial statements—income statement, balance sheet, and cash flow statement. These documents give a complete view of how money moves in and out of the business. Make sure the data is current and accurate. Without these statements, you can't track cash sources or spending. This step sets the foundation for your analysis.For a proper cash flow analysis, use monthly, quarterly, or yearly financial statements for the same period. Make sure all three cover the exact dates so your analysis stays accurate. Use the most recent versions to reflect your current cash position. If you're tracking trends, gather statements from several past periods. Consistent timeframes help you spot patterns and changes clearly.
Step 2: Calculate Key Cash Flow Metrics
The second step is to calculate key cash flow metrics. Focus on simple but powerful financial metrics like the operating cash flow ratio, free cash flow, and cash flow margin. These numbers show how well your business turns sales into cash and covers its debts. Use them to spot strengths or weaknesses quickly. Clear ratios make it easier to judge cash flow health and guide smart decisions.Key Cash Flow Metrics
Calculating key cash flow metrics helps you understand your company’s financial health. These numbers show if your business generates enough cash to cover costs, pay debts, and invest in growth. They reveal how efficiently you turn sales into cash. Quickly calculated and easy to track, they highlight strengths and warn you of potential cash problems before they grow.- Free Cash Flow to Firm (FCFF) shows how much cash a business generates for both lenders and owners after covering its core costs, taxes, and reinvestments. It focuses on the company's ability to create value before debt payments. Analysts use FCFF to check if the business makes enough cash to grow, pay down debt, or attract investors. It's a clear sign of financial strength and a top tool in cash flow analysis.
Use this formula to calculate the free cash flow to firm:
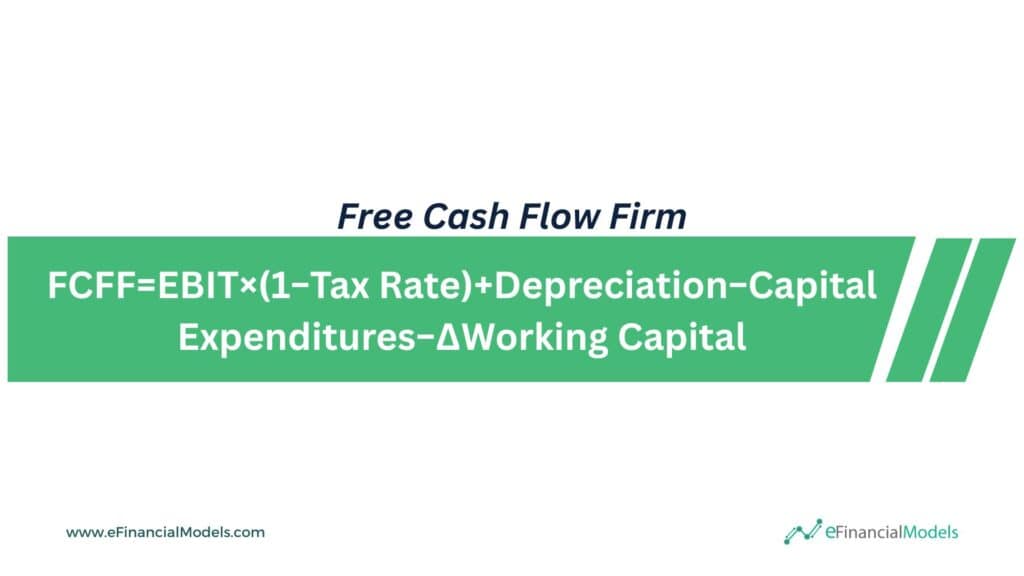
Where:
- EBIT (Earnings Before Interest and Taxes): The company profits from operations before deducting interest and taxes. It reflects core operating performance.
- Tax Rate: The effective tax rate applied to EBIT to calculate the actual tax outflow.
- Depreciation: A non-cash expense added back because it reduces EBIT but doesn't use cash. It accounts for asset wear and tear.
- Capital Expenditures (CapEx): The cash spent acquiring or upgrading fixed assets like property, equipment, or technology.
- Δ Working Capital (Change in Net Working Capital): The change in current assets minus current liabilities. If working capital increases, more cash is tied up in operations, reducing free cash flow.
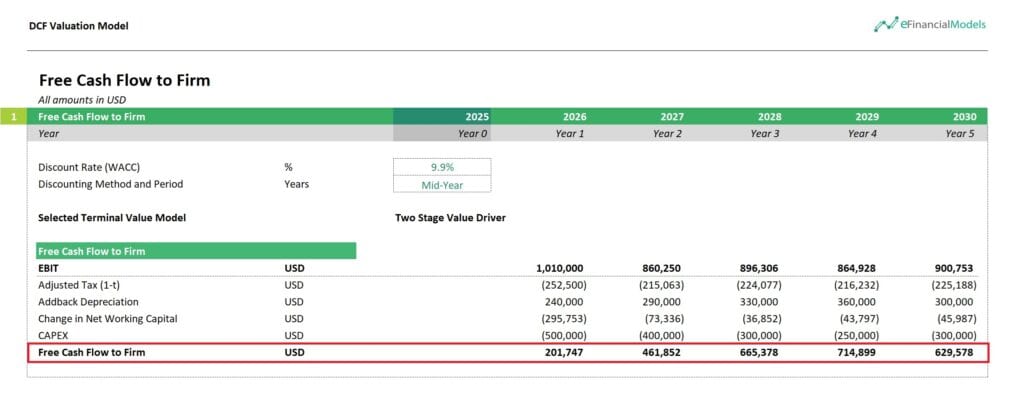
The example of Free Cash Flow to Firm (FCFF) above is from our Discounted Cash Flow Valuation Model. The forecast spans 2025 to 2030 and reflects cash available before any financing decisions are made. Despite rising EBIT and depreciation over the years, consistent positive FCFF values suggest the business is profitable and can generate cash independently. The trend of increasing FCFF from 2025 to 2029 reflects operational growth. Higher FCFF over time signals that the business is expanding and can reinvest in operations or distribute value to investors.
- Operating Cash Flow, also known as Cash Flow from Operations, shows how much cash a company generates from its core business activities. It excludes income from investments or financing. This metric tells if the business can cover expenses and grow without outside help. It’s key for judging financial health because it focuses only on real cash—not profits on paper. The business is likely stable and self-sustaining if operating cash flow is strong.
The formula to calculate operating cash flow is:

Where:
- Net Income: The company's total profit after deducting all expenses, taxes, and costs from revenue. It comes from the income statement.
- Non-Cash Expenses: Costs that reduce net income but don't involve actual cash outflows. Common examples include depreciation and amortization.
- Changes in Working Capital: Adjustments based on current assets and liabilities. It includes changes in receivables, payables, inventory, other current assets, and liabilities.

The example above shows how Cash Flow from Operations tracks real cash from running the business. In 2026, the company started with a net income of $729,750. It added back $240,000 in depreciation—a non-cash expense. Then, it adjusted for changes in working capital: it lost cash from rising receivables and inventory but gained some from higher payables. The result was an OCF of $673,997. Each year, this number reflects how much cash operations actually generate, separate from loans or investments. It tells us if the business can fund itself and grow using only the cash it brings from daily activities.
- Cash Flow Margin shows how much cash a company keeps from each dollar of sales. It measures the percentage of operating cash flow compared to revenue. A high margin means the business turns more sales into cash, which helps pay bills, invest, or grow. A low margin signals trouble managing expenses or collecting payments. This metric is key in cash flow analysis because it reveals how well a company turns income into real, usable cash.
The formula to calculate the cash flow margin is:

Where:
- Operating Cash Flow (OCF): The cash a company generates from its core business operations. It excludes cash from investments or financing. You can find it on the cash flow statement, usually under "Cash Flows from Operating Activities."
- Net Sales (or Revenue): This is the business's total income from selling goods or services after deducting returns, allowances, and discounts. It appears on the income statement.
- Multiplying by 100: This converts the ratio into a percentage, making it easier to compare across companies or time periods.

The Cash Flow Margin above tracks how well the company converts its sales into cash across the years. For example, in 2023 the margin is 29.1%, meaning the company turned 29 cents of every dollar in revenue into cash from operations. This ratio drops to 17.5% by 2030, showing a downward trend. That signals less cash is being squeezed out of sales over time, which could raise concerns about efficiency or rising costs. As a cash flow metric, it helps identify whether growth in revenue actually improves liquidity—or adds pressure.
In addition to operational metrics, businesses should also pay attention to key performance indicators (KPIs) like:
- Days Sales Outstanding (DSO), which measures the average number of days it takes to collect payment after a sale;
- Days Payable Outstanding (DPO), which assesses how long it takes a company to pay its suppliers
- Days Inventory Outstanding (DIO), which tracks the average number of days inventory remains in stock before being sold, shedding light on inventory management efficiency.
Together, these KPIs form the Cash Conversion Cycle (CCC)—a crucial measure of how quickly a business can convert its investments in inventory and other resources into cash. Understanding these metrics helps maintain liquidity and ensure that the company operates with optimal financial agility.
Step 3: Evaluate Cash Flow Trends
The third step in cash flow analysis is to evaluate cash flow trends. Look at the company’s monthly, quarterly, or yearly cash inflows and outflows over time. Spot patterns based on the key cash flow ratios:- Are operating cash flows growing or shrinking?
- Is the business spending more than it earns?
Compare your company’s key cash flow ratios with similar firms in your industry. Check if your business generates more or less cash than competitors. Look for major gaps. Stronger performance shows financial health. Weaker numbers may signal problems. This comparison highlights where you lead—or where you need to improve.
Step 4: Assess Results
The fourth step in cash flow analysis is to assess the results. At this stage, you look at the numbers to see if your business generates enough cash to cover expenses, grow, or invest. Check for trends like rising expenses or falling cash inflows. Compare actual cash flow with past periods or your forecasts. If there's a shortfall, find the cause—maybe late payments or high costs. Decide whether to save, pay off debt, or invest if there's a surplus. This step helps you make smart financial decisions based on real cash performance.It is essential to draw clear conclusions from the data. Look at liquidity to see if your cash covers short-term needs. Check solvency to judge if the business can survive long-term. Measure investment capacity by spotting leftover cash for growth or expansion. Review if there's enough to pay down debts on time. Finally, evaluate how smoothly operations generate cash. These insights help you act fast, fix issues, or plan smart moves.
Simplify Forecasting with a Cash Flow Analysis Excel Template
How to do a cash flow analysis starts by gathering key financial statements. Use these to calculate critical cash flow metrics. Once calculated, review how cash moves in and out of the business over time. It is also essential to look for patterns, spikes, or drops that may signal strong performance or trouble spots. Finally, assess the results to understand if your business generates enough cash to sustain operations, invest, and pay debts. This simple yet powerful process helps you stay in control of your business’s financial health.
To understand your cash flow health, track key metrics and compare them with industry benchmarks. Start with Free Cash Flow to Firm to see how much cash is left for growth after expenses. Check Cash Flow from Operations to measure core business strength. Use Cash Flow Margin to track how well sales turn into cash. Monitor Days Sales Outstanding (DSO) to see how quickly you collect payments. Watch Days Payable Outstanding (DPO) to learn how long it takes to pay bills. Monitor Days Inventory Outstanding (DIO) to track how fast you sell stock.
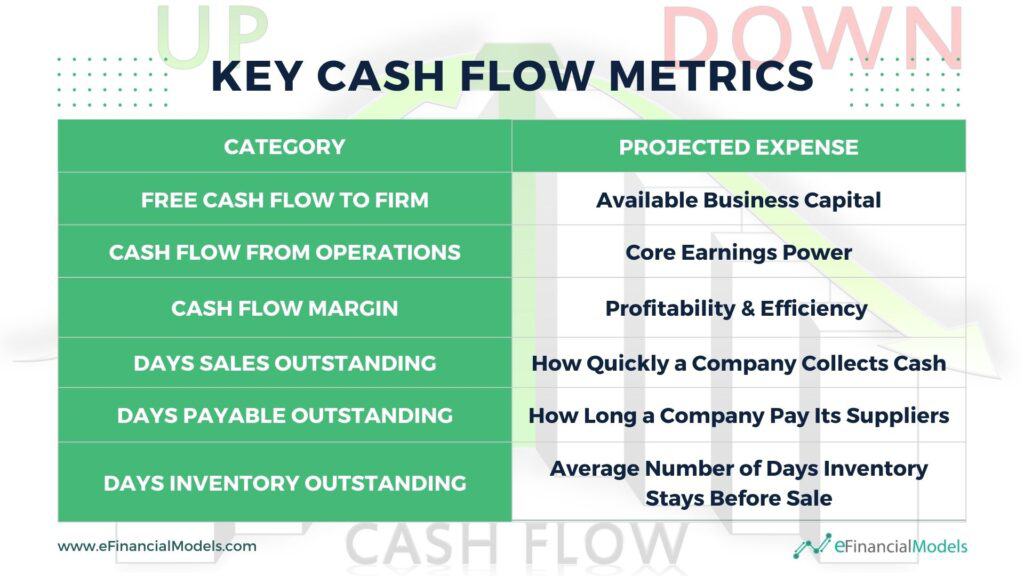
Simplify your forecasting by using a cash flow analysis Excel template. It helps you quickly organize data, track cash movements, and spot trends. You can easily plug in numbers, update them, and see real-time insights. This saves time and cuts errors. The template also makes it simple to test different scenarios and plan confidently. You can focus on decisions instead of calculations with clear visuals and built-in formulas.
Our cash flow analysis Excel template at eFinancialModels makes forecasting fast and easy. It's built to help you track inflows and outflows, calculate key metrics, and visualize trends clearly. With ready-made formulas and structured layouts, you save time and reduce errors. You can test different scenarios, plan ahead, and stay in control of your finances. Whether a startup or an established business, this tool gives you the clarity and confidence to make smart decisions.
You might also like:
- 10-Step Financial Planning Checklist for Smart Executives
- 10 Ideas to Increase Average Revenue Per User
- 5 Practical Tips to Help Raise Funds For Startups
- Financial Model Templates Easy to Use
- Financial Planning for Startups and Small Businesses
- Scenario Analysis
- Cash Flow Analysis in Excel
- Financial Statements – Definition, Uses, Contents and Templates
- Building a Monthly Budget – Using Monthly Budget Templates
- How to Build a Capitalization Table
- Understanding the Debt Service Coverage Ratio: An Essential Metric for Financial Analysis
- Business Valuation
- 5 Steps to Create a Drop Down List Using Data Validation in Excel
- Financial Modeling with Excel: Fundraising Plan Tactics
- Mastering the Art of IRR Calculation: A Comprehensive Guide for Investors
- Business Model Templates - Using Business Models as Examples
- Investment
- Why Financial Forecasting Models Are Vital for Your Business
- Fundraising
- Financial Ratios Analysis and Its Importance