Leveraged vs. Unleveraged IRR: What You Need to Know

A young investor wants to maximize his financial growth. He’s been reading up on investment strategies and recently stumbled upon Leveraged vs. Unleveraged IRR. He realized he needed to catch up on a crucial distinction between financial strategies. He had always assumed that more leverage meant more gains, but the guide opened his eyes to the complexities of investment returns. Discover the pivotal distinction between financial strategies with our comprehensive Leveraged vs. Unleveraged IRR guide. Delve into the intricate world of investment returns, uncovering the nuanced impact of leveraging on the Internal Rate of Return (IRR). Gain insight into the contrasting dynamics and unlock each approach’s strategic advantages in maximizing your financial growth.
Investors considering investing in a new private equity investment project will typically carefully evaluate any unique investment proposition in light of their merits and risks. For many private equity funding investors in real estate or privately held companies, investments will be made and held over a couple of years until they will be exited again. In such cases, most investors will want to calculate how much return their investment is expected to make and compare it with other alternative investment options. To answer this question, investors must determine the levered vs. unlevered IRR.
Many investors are using bank financing for their investments, and they primarily think about how much equity will be needed and at which price they can exit their equity stake again. They will most likely base their investment decision on the levered IRR formula, which, in many cases, is heavily influenced by financial engineering techniques. In this article, based on the internal rate of return, we want to show that to understand the Leveraged vs. Unleveraged IRR.
Financial Debt: The Difference Between Levered vs. Unlevered IRR
The internal rate of return (IRR) calculation is based on projected free cash flows. The IRR is equal to the discount rate, which leads to a zero Net Present Value (NPV) of those cash flows. Therefore, the definition of free cash flows is essential. There are two main types of free cash flows which can be referred to:
- Unlevered free cash flows or free cash flows to firm: EBIT * (1-tax rate) – CAPEX + Addback Depreciation – Change in Net Working Capital
- Levered free cash flows or free cash flows to equity shareholders: Unlevered free cash flows + change in financial debt – interest + correction for effective taxes paid
Where:
EBIT = Earnings before Interest and Taxes
CAPEX = Capital Expenditures
While unlevered free cash flows refer to the cash flows generated by the company without considering its financing structure, levered free cash flows are impacted by the amount of financial debt used. As such, the main difference between Leveraged vs. Unleveraged IRR is financial debt.
Using financial debt – especially in low-interest-rate environments – is much cheaper than financing solely with equity and allows businesses to enhance the returns on their investment. It is called “financial leverage, “gearing,” or “financial engineering.” The resulting levered vs. unlevered IRR calculations can now be differentiated as follows:
- IRR Unlevered uses the unlevered free cash flows and is subject to the operating risks of the company. The unlevered IRR is not supposed to be affected by any company financing structure change. The IRR Unlevered is often also called the “Project IRR.”.
- The Leveraged IRR formula is calculated based on the levered free cash flows (another variation is to use a cash-in / cash-out consideration based on the initial equity investment made, dividends, and exit proceeds). Leveraged IRR includes operating risk and financial risks (due to the use of debt financing). If the financing structure or interest rate changes, the IRR levered will also change (whereas the IRR unlevered stays the same). The leveraged IRR is also known as the “Levered Equity IRR.”
Calculating and understanding the Leveraged vs. Unleveraged IRR can be tricky. Therefore, let us review an example of an internal rate of return calculated in Excel for two different investment cases. Both investment projects, A and B, show similar operating risks and require a 10% opportunity cost on invested capital to compensate investors for the operational risks.
Internal Rate of Return Example
Project A
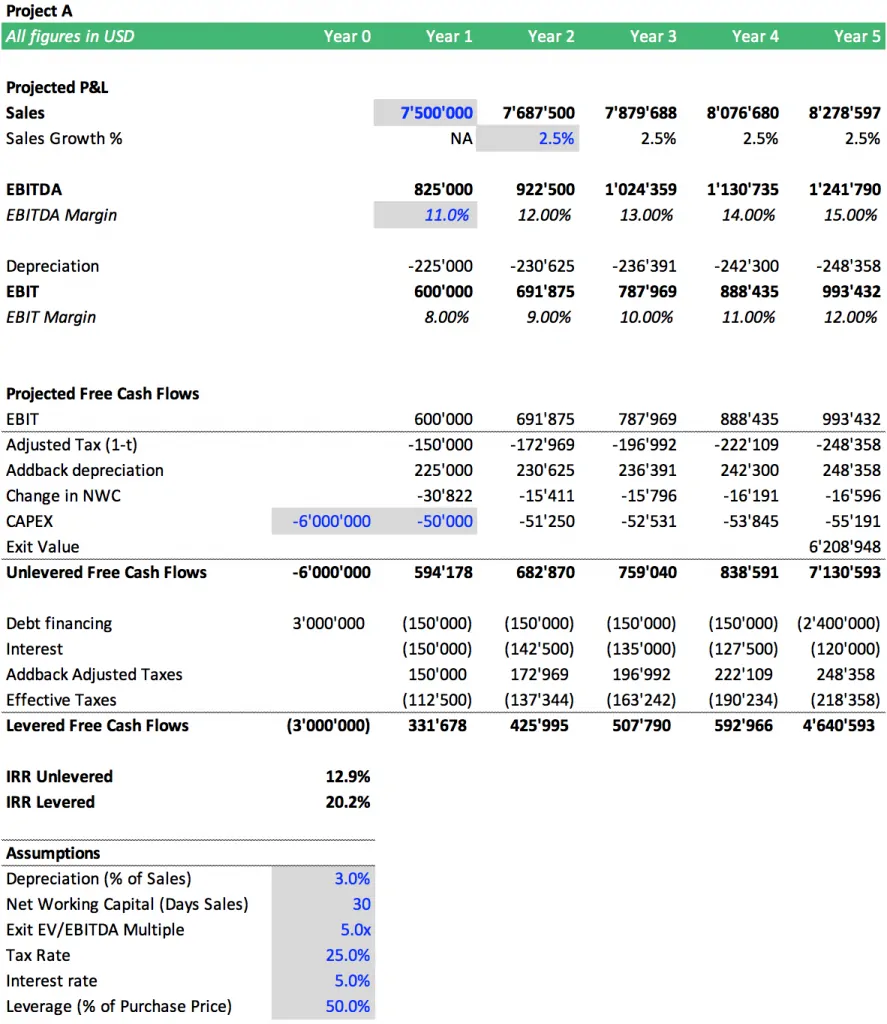
Project A has a proposed private equity funding in a manufacturing company. The investment is expected to be exited within 5 years. The company of Project A has $7.5m in sales, and a $6m acquisition price is requested. 50% of the acquisition price can be financed through debt, which results in a $3m equity investment required. See the projected financials for Project A below.
Project B
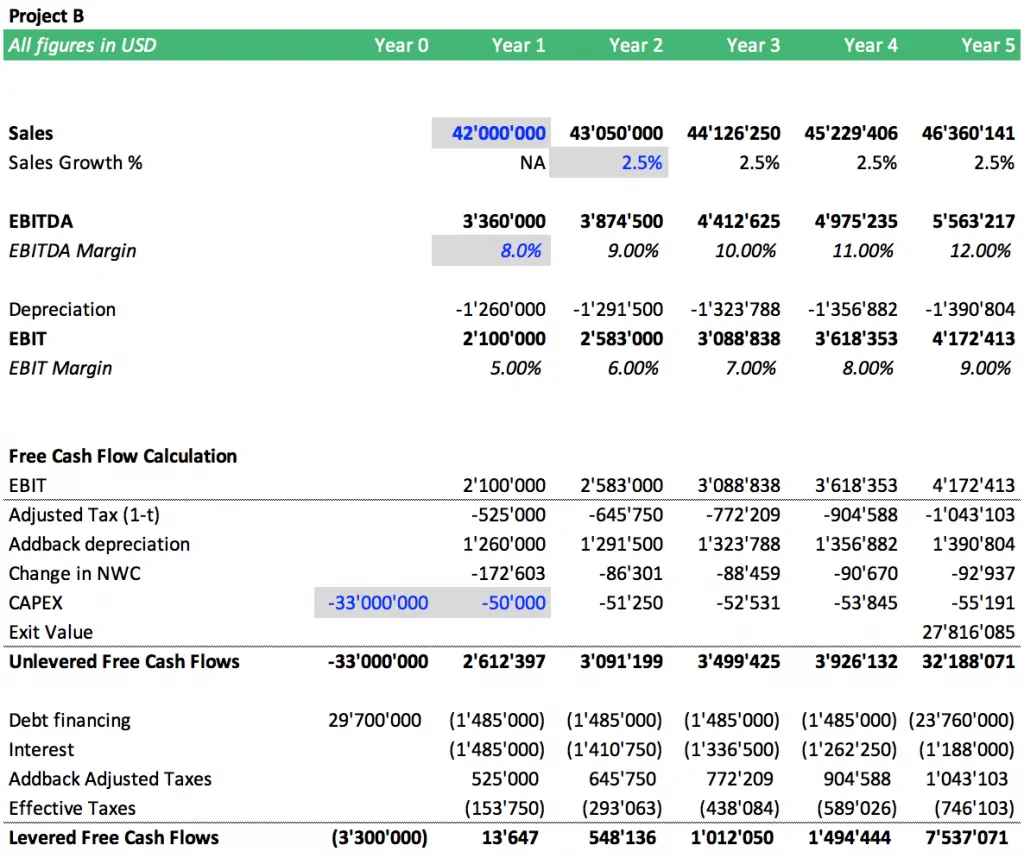
Project B is a bit bigger and requires a $33m initial investment while showing $42m in annual sales. Project B offers that up to 90% of the initial investment price can be financed through financial debt, requiring $3.3m in equity investment. See the projected financials for Project B below.
Comparing the Levered IRR Formula
Available investor funds are limited and are only sufficient to be invested in Project A or Project B. Therefore, we use IRR analysis to determine which investment project should be pursued: A or B. We start our IRR analysis by using the levered IRR formula based on the levered free cash flows. We then compare the levered IRR in private equity between Project A and Project B:

Based on our comparison table and our internal rate of return example calculation of levered IRR in private equity above, it seems that Project B is better since it requires almost the same amount of investment as Project A while offering 30% instead of 20% IRR levered. On first glance this looks great but on second thought we would base our investment decision solely on the IRR levered without actually understanding why IRR levered is higher for Project A than for Project B. Now let us dig a bit deeper into the IRR analysis, as we need to understand why project B is offering us nearly 1.5x the IRR levered compared to Project A.
Understanding Leveraged vs. Unleveraged IRR by Analyzing the Effect of Financial Leverage
We are widening our IRR analysis by comparing the two investment projects: levered vs. unlevered IRR. Please find the updated comparison table below.

We find that IRR unlevered is better for Project A than for Project B. The company’s weighted average cost of capital (WACC) lies at 10%, which means without using financial leverage Project B’s IRR unlevered (7.7%) is insufficient to pay for its cost of capital. For Project A, IRR unlevered (12.9%) exceeds the company’s WACC (10%). It means that Project A is better than Project B since it offers excess returns beyond the company’s cost of capital without any financial engineering.
Leveraged IRR is higher for Project B than Project A because Project B benefits from 90% bank financing, which increases returns up to 30.4%. The return is heavily driven by financial engineering. Project A also benefits from financial engineering but only up to 20% levered IRR as only 50% of the project is financed with debt.
In the above internal rate of return example, many investors will still argue that receiving a 30% return is better than receiving a 20% return. The problem is that they must pay more attention to the financial risks involved. They must also realize it before exchanging a good project for a bad one. Suddenly, they will take on much more risk as the financial risk increases.
It is important to note that Project B’s investment proposition has a very different risk profile than Project A. Suppose something goes wrong. The project cannot be exited at the intended exit valuation. In that case, Project B’s equity portion will have to absorb a possible hit on the exit valuation, and the equity value is in danger of being completely wiped out since only 10% of the initial project value is financed through equity. Suppose you compare this to a worst-case scenario for Project A, where the equity portion is 50% of the initial investment. In that case, there is more equity buffer to absorb a possible hit on the exit valuation. Project B becomes riskier due to the high financial leverage (90%) used.
In addition, Project B needs to be higher quality than Project A. In case the project performs worse than the anticipated unlevered IRR (7.7%), there is less buffer compared to the IRR unlevered of Project A (12.9%), and Project B’s unlevered IRR in the worst case is more likely to become negative than Project A’s.
Comparing Apples with Apples
To neutralize the effect of financial engineering, it is better to compare apples with apples. Therefore, we must compare the two investment projects with the same financial leverage. It means we must change the 90% debt financing used for Project B to 50% (the same as for Project A). Our Project B (90% debt financing) now becomes Project C (50% debt financing) and shows the following cash flows:
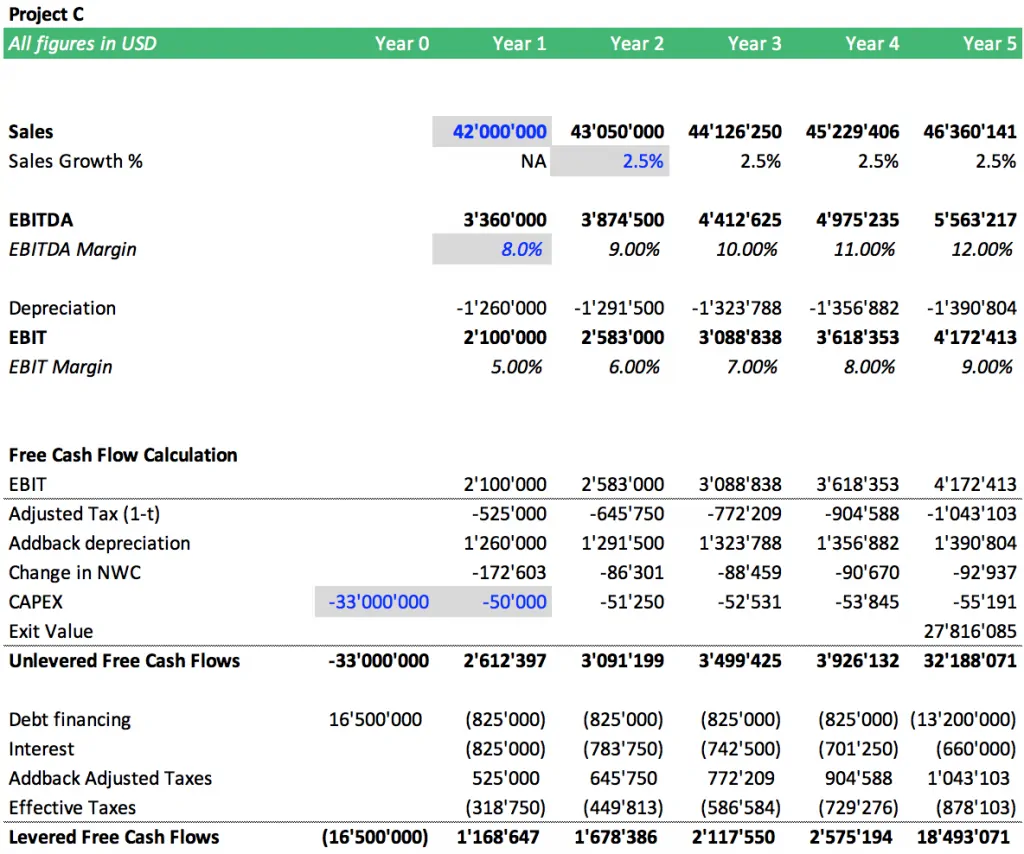
Our comparison table can now be updated. Project C is the same as Project B, except we use a 50% financial leverage (and not 90% anymore).

While the equity investment now is significantly higher, we exclude this fact for the moment as we only want to base our decision-making process on IRR analysis. Now, we are comparing the two projects with the same degree of financial leverage. The analysis of Leveraged vs. Unleveraged IRR shows that Project A (20.2%) outperforms Project C (11.2%). It means with Project A, we get more return for the risk we take compared to Project B; ergo, Project A is a more efficient investment proposition in terms of risk. For decision-making purposes, this is the type of analysis to perform.
Conclusion – IRR Levered Requires an Understanding of IRR Unlevered
Whenever we are confronted with IRR analysis, it is important to understand Leveraged vs. Unleveraged IRR calculation.
When we calculate the IRR levered, as our internal rate of return example shows, we should also calculate the IRR unlevered. We should only enter into investment projects where we are compensated for the risk which in this case means, that our investment from an IRR perspective needs to fulfill two conditions:
- IRR unlevered to exceed the WACC (to ensure the project generates an excess return and does not destroy value)
- IRR levered to meet our own specific return target
By adhering to this rule, we can ensure that we carefully pay attention to the risk of investment projects we enter and do not unnecessarily select only bad projects with excessive risks.
Whenever we need to compare investment projects with different degrees of financial leverage used, we can neutralize the effect from financial engineering when comparing the projects “as if” they would use the same degree of financial leverage. It also allows us to compare leveraged IRR, as now we compare apples with apples.
The internal rate of return examples above shows what type of analysis is needed to better understand the effects from financial leverage on IRR and avoid a costly mistake when not getting enough return for the (operating and financial) risks involved.
To help you realize the logic behind IRR Levered calculation, please feel free to download our general and industry-specific financial model templates with IRR calculation included, especially ready-made by experts/professionals with a wide range of know-how and experience in financial modeling below:
These templates are available for download to users worldwide, such as the USA, Australia, Canada, Japan, Germany, and many more!
Frequently Asked Questions
What Is Leveraged vs. Unleveraged IRR?
Leveraged IRR considers the impact of debt or leverage on investment, while unleveraged IRR does not assume any borrowing or debt in the calculation.
Which is Higher Between Levered vs. Unlevered IRR?
In most cases, the leveraged IRR tends to be higher than the unleveraged IRR due to the influence of borrowed capital, which amplifies returns. Financial debt boosts the investor’s returns, especially when the cost of borrowing is lower than the returns generated from the investment. This magnification effect causes the leveraged IRR to appear higher than the unleveraged IRR, reflecting the increased risk and potential gains from leveraging the investment with borrowed funds.
Which is Better, Between Leveraged vs. Unleveraged IRR?
The better option between leveraged and unleveraged IRR depends on the investor’s risk tolerance, financing costs, and investment objectives. Leveraged IRR can offer higher returns but typically involves higher risk due to debt.
What is a Good IRR for an Acquisition?
A “good” IRR for an acquisition can vary based on industry, market conditions, and risk appetite. Generally, a double-digit IRR (above 10%) might be considered good, but what’s considered acceptable can differ significantly depending on the specific circumstances.
What is a Good IRR for a Merger?
Similar to acquisitions, what constitutes a good IRR for a merger can be context-dependent. It can vary based on the companies involved, market conditions, synergy potential, and the risk associated with the merger. Typically, a robust IRR for a merger might also be in the double-digit range, but the specific benchmark can differ.







OK presentation but stumbles on a few variables. CapEx is for all projects set far too low and equal to that of Project A, despite Depreciation changing significantly in B and C. Also, setting the first’s year change in net working capital to 2x next year’s level is at best random for a growing business. Finally, introducing the important concept of WACC by just throwing in a level of 10% for “the company” with no reference to project nor how it will change with increase in leverage, is poor form. As an aside, Proj B sells for an exit value way less than entry for what is and better run company margin-wise. Odd.