IRR vs ROI Analysis – Which one should you choose when?

Evaluating new investment projects in business requires a solid analysis in order to create a basis for financial decision making. Especially in Financial Planning/Budgeting in business one has to decide on which financial return metrics to rely on.
The implications of selecting and relying on the best return metric are crucial in business since a lot of funds are at stake. For investment projects, e.g. a new capital expenditures, an investment in a property a company or in an advertisement campaign, management needs to figure out which projects are the most profitable ones before making the decision how to proceed. Normally either the Return on Investment (ROI) or the Internal Rate of Return (IRR) are the financial return metrics which will be considered for decision-making. A frequent discussion among management, therefore, is the interpretation of the results, especially when the conclusion based on one analysis differs vs. the conclusion made when looking into the other analysis. An important discussion we, therefore, like to clarify in this article is how to compare IRR vs ROI, and which one should be used when and how?
Making the right investment-decision is very important in business as normally company owners want to maximize their returns, a company needs to make a profit to survive in the long-term and capital is costly, therefore needs to be allocated wisely.
IRR Analysis: Mostly used for capital intense investments
The Internal Rate of Return (IRR) is a financial return metric used in the evaluation of new investment projects. The definition of IRR is that the Internal Rate of Return is the required discount rate that makes the net present values (NPVs) of all cash flows from a particular project equal to zero. IRR takes into account the expected cash flows during the whole project life and translates them into a return metric which can be compared among projects.
Once the internal rate of return of a project is determined, it will be compared to the company’s hurdle rate. Normally a company’s minimal hurdle rate will be its cost of capital but many companies will actually even set the bar higher to ensure they can create excess value for the company. It is very important that the IRR should be higher than the hurdle rate in order that a project makes financial sense to invest in. If the IRR is greater than or equal to the hurdle rate, then it is a good investment and the project is good to go. Likewise, if the IRR is lower than the hurdle rate, then it does not meet the specified return requirements and the funds should not be invested. If you have a number of competing projects which show a return above the company’s hurdle rate, then from a financial perspective you should invest in the projects with the highest IRR as you want to maximize the return on your investment.
How do you calculate the IRR?
The traditional way to calculate IRR uses an iterative trial and error approach to find the discount rates which makes NPV equal to zero. In a simpler way, the initial cash investment for the beginning period will be equal to the present value of the future cash flows of that investment. Now what you need to do is to prepare an NPV calculation where the discount rate is an input and you can simulate the effect on the NPV by varying the discount rate until the resulting Net Present Value returns zero.
The modern way, of course, is to use a spreadsheet program such as Excel or Google Sheets and simply insert the IRR formula which will do this calculation for you. Nevertheless, we would like to show you the traditional way how to calculate the IRR in order to provide you with a solid understanding of how IRR calculation works.
Example IRR Calculation for New Equipment or Company Expansion Projects
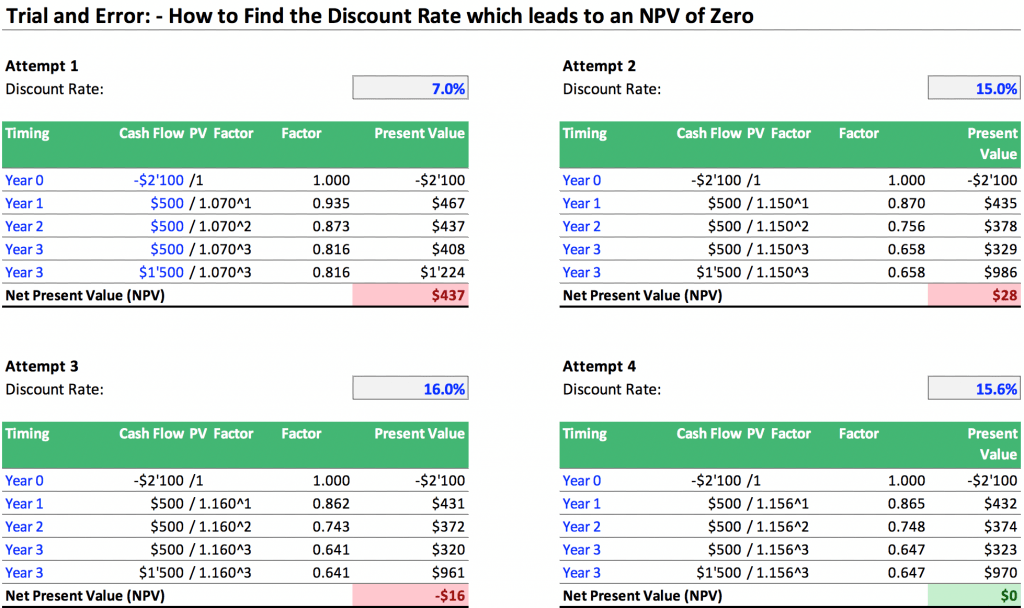
Below we present a simple example of how to find the Internal Rate of Return which leads to an NPV of zero: ABC Company is deciding whether to purchase new equipment that costs $2,100. We call this Project A. Management estimates the life of the new equipment to be three years and expects it to generate $500 of annual profits until the equipment will be sold at its salvage value of $1,500 in year 3.
What needs to be done here is to prepare a small NPV model in Excel or any other spreadsheet program. In the below picture, the inputs are marked in blue font color while the outputs (calculations) are in shown in black font color. We then test if the NPV is equal to zero. If it’s equal to zero, the cell will show a green background, if the result is not equal to zero it will show a red background.
So we start our test by inserting the company’s cost of capital of 7.0% as the discount rate. What you can see in attempt 1 is that the result is a positive NPV. This means we get a positive value which actually is quite far away from zero, ergo the discount rate which makes an NPV zero must be substantially higher. We then check in attempt 2 with a discount rate of 15.0% but we still get a small positive NPV. We, therefore, retry in attempt 3 what happens if we just slightly increase the discount rate by 1.0% to 16.0% and now we get a negative NPV. Therefore, the discount rate which makes NPV equal to zero needs to be between 15.0% and 16.0%. In attempt 4 we use the goal seek function in MS Excel to iteratively find the discount rate which balances NPV at zero and we find it at 15.6%. As this now fulfills our conditions of making the NPV equal to zero, we conclude that the IRR of Project A is 15.6%.
Comparing the IRRs of two Competing Projects
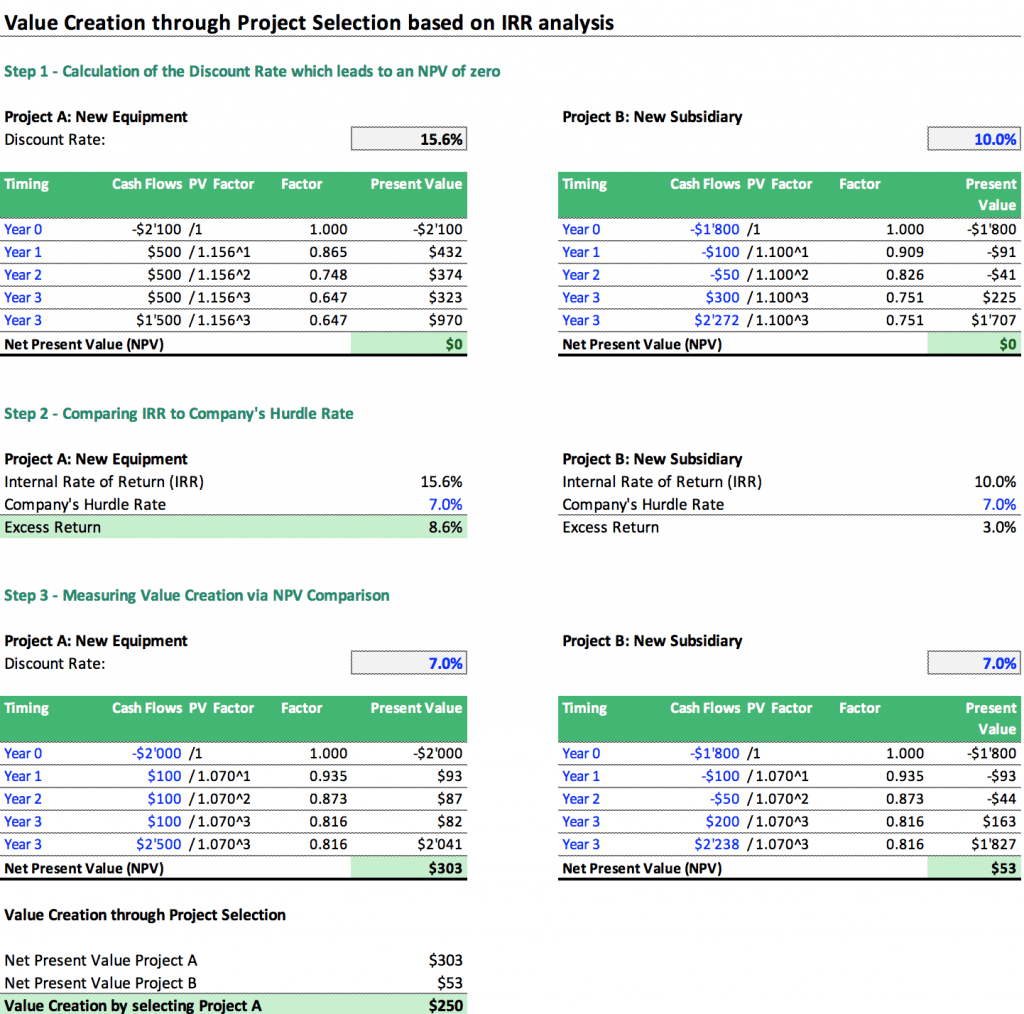
Meanwhile, another similar investment project, Project B, foresees to open a new subsidiary abroad. Setup and marketing costs will lead to a negative Cash Flow of $-1’800 at the start and during the first two years, the company will have to expect losses of -$100 and -$50 until in year 3 the new subsidiary will start generating money with annual cash flows of $300. The plan would foresee to sell the subsidiary at the end of year 3 with $2’272 net exit cash proceeds. By using our trial and error method, we determine that Project B has an IRR of 10.0%.
So let’s assume we are short in cash and our liquidity situation only allows us to invest in one of the two projects, either Project A or Project B. Which one shall we choose?
In Step 1 below we compare once more the IRR calculations of both projects. In Step 2, we need to compare the IRRs with the company’s hurdle rate. Both Project’s IRR lies above the company’s hurdle rate of 7.0%. However, the main difference is that Project A has a higher IRR and therefore offers us a better return on our investment than when investing in Project B.
In Step 3, we undertake another check as we want to know how much excess value can be created when investing in Project A. Therefore, we discount both project’s cash flows at the company’s hurdle rate to understand the NPV impact of both projects on our company. As Project A’s NPV impact is also much higher than Project B, we, therefore, can generate $250 in value when selecting Project A instead of Project B. Please note, this value is generated purely by making the right decision. Therefore, it really pays off to take some time to perform this analysis properly as the result translates in significant value for the company.
The importance of IRR analysis in financial decision-making
IRR analysis offers a solid tool for making informed financial decisions which aim to maximize returns and value creation. In most cases, a company will have a list of investment projects and needs to decide which ones to execute and which ones to delay. IRR analysis evaluates the attractiveness of an investment project and allows us to compare one project versus another one. From a financial point of view, the highest IRR projects should be executed as they will help to maximize the returns and the value creation for this company. However, there needs to be a proper check to understand if the IRR of an investment opportunity exceeds the company’s hurdle rate (minimum its cost of capital). Projects which show an IRR below the hurdle rate should not be invested in as their opportunity cost is higher than the return they can offer. They are so-called value destructive projects and should not be executed from a financial point of view. Projects with IRRs higher than the company’s hurdle rate indicate the financial feasibility of such projects provided they can be funded. IRR analysis, therefore, is a truly useful financial metric to consider whenever you need to decide which investment project you like to give preference.
ROI Analysis – a Simple Alternative
Return on Investment ROI is a financial metric of profitability that is widely used to measure the return or gain from an investment. ROI is a simple ratio of the gain from an investment relative to its investment cost. It is as useful in evaluating the potential return from a stand-alone investment over a short period of time.
In business case analysis, ROI is one of the key metrics—along with other cash flow measures such as Internal Rate of Return (IRR) and Net Present Value (NPV)—used to evaluate and rank the attractiveness of a number of different investment alternatives. ROI is generally expressed as a percentage rather than as a ratio. For some companies, they opt to use the ROI metric because it helps the investors or the management to have a quick check on the prospective investment. They want to find ensure that no time and money will be put into waste. It also helps the business decision to explore the potential returns of different investment opportunities. It is the simplest measurement for an investor but is not suitable in all situations since it does not take into account (unlike IRR) the length of the project life.
How do you calculate the ROI?
The calculation of ROI is very simple. You simply divide the profit of a project by its investment cost:
ROI = Profit / Cost of the investment
Example ROI Calculation: Property Flipping
ABC Company plans to buy a commercial property for $5min 2017 (Project A) and immediately starts renovation works with total costs of $1.5m. In 2018, the property was sold to XYZ Company for $8m. What will be the ROI of ABC Company?
Our calculation goes as follow: Step 1 we calculate the profit of this deal which basically is the difference between the sales price of $8m and the all-in investment cost of $6.5m resulting in a profit of $1.5m. In Step 2, ROI is determined through a simple calculation by dividing the profit by the initial investment costs which lead to an ROI of 23%.
Now the company can also invest in Property B, an industrial single-tenant building. Here the purchase price is lower tat $3m but renovation costs are higher at $3m. Same as Property A also one year will be required from start to finish this project since with both properties interested buyers are already lined up.
By performing also an ROI calculation for Property B, we calculate that Property B will offer us an ROI of 33%.

So which property should we invest now? – From a financial point of view, Property B offers the highest ROI and we, therefore, will decide to invest in Property B.
Example: ROI Calculation for Advertisement Campaigns
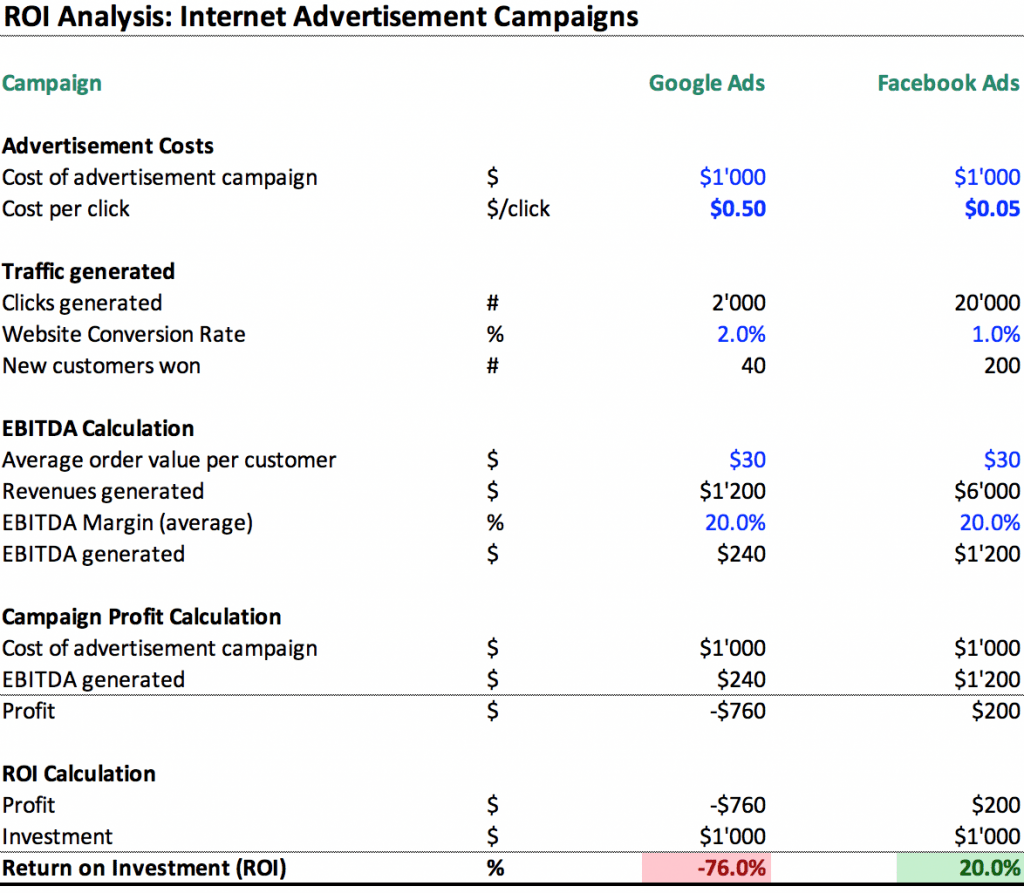
In this example, we want to use ROI calculation for evaluating two alternative internet advertisement campaigns, either via Google ads or via Facebook ads. We expect to run the ads for ca. 1 month and expect immediate orders out of this.
So we will calculate the expected ROI for both campaigns to figure out which one is more profitable.
Google Ad campaigns cost $0.50 per click and offer to obtain highly targeted visitors which convert very well on our website in paying customers at 2.0%. This means we should get 40 paying customers. Each visitor on average we expect to place an order of $30 which translates in $1’200 revenues out of this campaign. On average our EBITDA (Earnings before Interest, Taxes, Depreciation, and Amortization) profit margins lies at 20%, therefore we can generate $240 with this campaign. Now, as the campaign costs are $1’000, we actually make a loss on this campaign of -$760, our ROI is even negative.
Therefore, we need to search for alternative advertisement opportunities. Let’s consider e.g. a Facebook Ad campaign. Here we can get one click for only $0.05 when creating a really great ad. However, conversion rate might be less compared to the traffic we could get on Google, as on Facebook the expected visitors might be more diverse. So we expect only a 1% conversion rate. This means we get 20’000 visitors but which at a 1% conversion rate into paying customers to lead to 200 customers. Now we get a revenue of $6’000 out of this campaign and an EBITDA of $1’200. Since the profit is the obtained EBITDA of $1’200 less the initial costs of $1’000 we actually generate $200 profit with this campaign. This translates into a 20% ROI.
Therefore with ROI analysis, we are able to quickly figure out which campaign we should run to ensure we are making profits and not losses with internet marketing.
The Importance of ROI Analysis
ROI calculates the investment return over a set time frame. The use of ROI can be more accurate if it is used over a short period of time. The reason why many companies use ROI analysis is that it is simple to use, compute and understand. In some cases, where the investment period is short (as e.g. in cases of property flipping, advertisement campaigns, etc.) a simple ROI analysis will do the job of coming up with a pretty solid basis for financial decision-making.
The downside of an ROI analysis is that it neglects the time required to generate the return. So if e.g. above project would take 100 years to generate this return, ROI would still be 20%.
Comparing the results of IRR vs ROI analysis
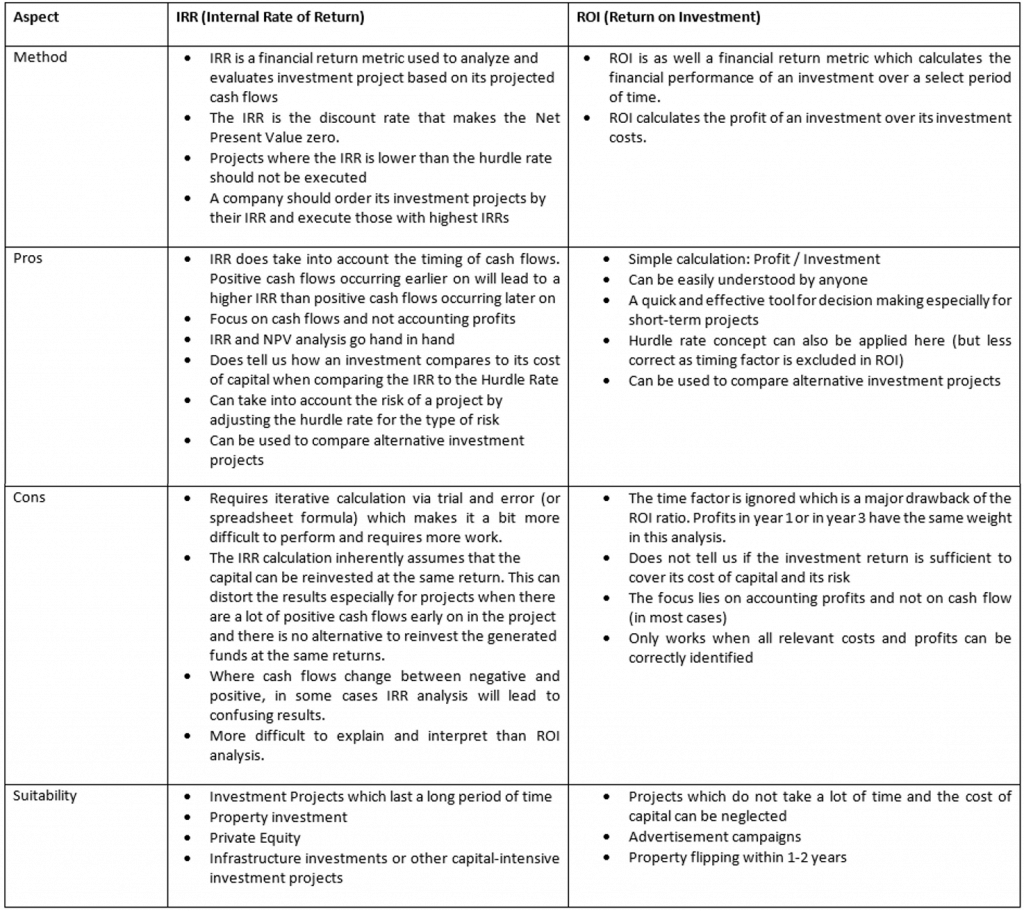
Below we prepared a table to compare the main differences when comparing IRR vs ROI
Conclusion: Which financial metric to use when – ROI or IRR?
In business, it pays off to know the main arguments of the IRR vs ROI discussion.
IRR analysis should be done whenever we talk about a longer investment horizon and mostly for capital intense investment projects with longer-term cash flow impacts. However, the calculation is more complex to perform and understand. Apart from some special cases, IRR provides a solid analysis tool which also takes into account the required time and – by comparing to the hurdle rate – the risk of the opportunity. It’s not surprising that many professional investors such as Real Estate Investors or Private Equity Investors use IRR analysis in their decision making.
An ROI analysis can be advantageous in some cases because the calculation is one of the simplest calculations to perform and can be understood easily. ROI analysis is especially useful where the timing factor is less important, e.g. for short-term investment projects such as property flipping or advertisement campaigns. However, the catch here is to be mindful to include all the expected costs or expenses.
Anyway, two of the most popular ways to measure investment performance are Return on Investment (ROI) and Internal Rate of Return (IRR). For some people, ROI might be more common than IRR, while for others they deal with IRR on a daily basis for financial decision-making. To see the total picture and the different scenarios, why not use both whenever you can for the next time?
Feel free to check out some of our financial model templates related to IRR and ROI analysis. We have customers from all parts of the world, from USA, UK, Australia, New Zealand, Asia, Africa, Latin America and many other countries which use our financial model templates for their financial decision-making.

