
0 ITEMS
Excel
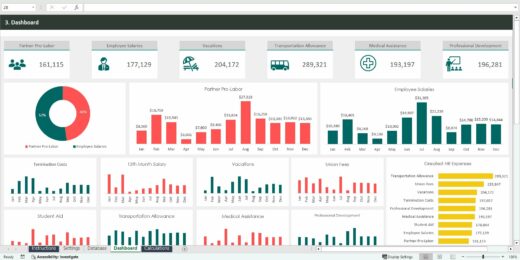
Elevate your financial decision-making with our Excel Spreadsheets with Formulas, a meticulously engineered tool designed for the ambitious entrepreneur and astute finance professional. Immerse yourself in a world where complex calculations become effortless, insights become more apparent, and strategies are refined with precision. This spreadsheet isn't just about numbers; it's about transforming data into potential, allowing you to analyze, forecast, and plan with confidence and sophistication. Join the ranks of top-tier analysts and let our Excel Spreadsheets with Formulas catalyze your next big financial breakthrough.

Manufacturing KPI Management Excel Dashboard
A manufacturing key performance indicator (KPI) is a clearly defined…
Multifamily Rehab Model (Includes Investor Returns Waterfall)
Introducing the Multifamily Rehab Flip Model with Investor Returns Waterfall…

EV Charging Station Finance Model
Provides a comprehensive analysis of the financial viability and potential…

Project Finance Excel Model – 10 Year Projection
The template creates a financial model for your individual project…

Startup Company Financial Model – Dynamic 3 Statement Financial Projections up to 8-Years
Highly Dynamic and Easy-to-Navigate Excel Financial Projections Model that allows…

Advanced Financial Model – Dynamic 3 Statement 10-Year Financial Model with DCF Valuation
Advanced, Dynamic and Easy-to-Use Excel Financial Projections Model that allows…

Veterinary Imaging Center Financial Model
The Veterinary Imaging Center financial model is designed to analyze…

Custom Financial Model Design Service
Unlock the power of strategic financial planning with The Company…

Parcel Locker Network Business Financial Model (10+ Yrs. DCF and Valuation)
The Parcel Locker Network Business Financial Model is a comprehensive…

Supply Chain Management Dashboard Excel Template
Our Supply Chain Management Dashboard is a comprehensive tool that…

Sales and Revenue Dashboard Excel Template
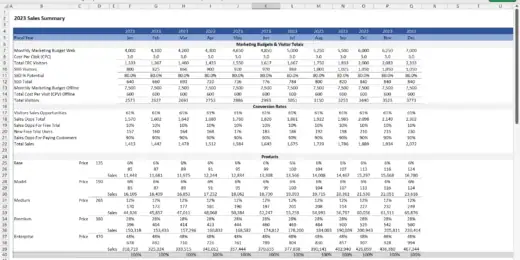
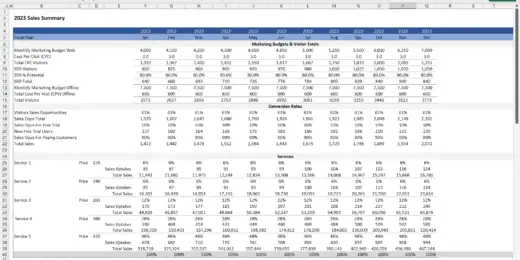
Empowers your business with real-time revenue and profit insights to…

Online Store Sales Dashboard Excel Template
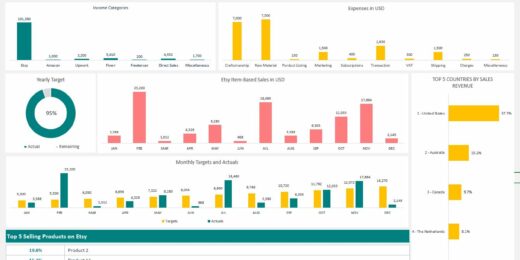
Equips businesses with actionable insights for optimizing sales strategies tailored…

CEO Dashboard KPI Excel Template
Our CEO Dashboard Excel Template provides a comprehensive overview of…


Mobile Imaging Center Financial Model
This Excel model facilitates mobile imaging services by providing equipment…

Radiology Center Financial Model
The Radiology Center financial model is a comprehensive and versatile…

Accounts Receivable Dashboard Excel Template
Accounts Receivable Dashboard: Tracking Key Metrics and Payments Effectiveness.

Biomethane Producer Financial Model (Renewable Natural Gas)
Create a detailed pro forma with this biogas financial model.…

Beginner Commercial Property Modelling Tool
"Beginners Commercial Property Modelling Tool," a resource for developers embarking…
Fintech Mobile App Financial Model
A comprehensive editable, MS Excel spreadsheet for tracking Fintech Mobile…

Indoor Golf Centre Finance Model
A comprehensive editable, MS Excel spreadsheet for tracking Indoor Golf…

Project Management Office PMO Dashboard Excel Template
1. Provides a framework for a Project Management office fitting…
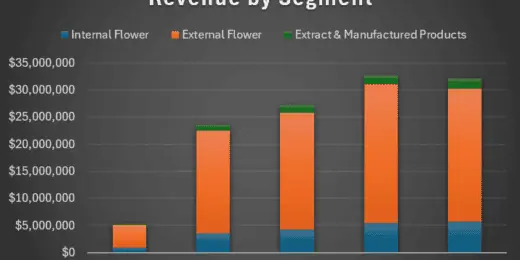
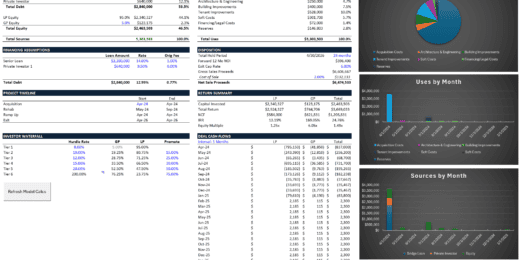
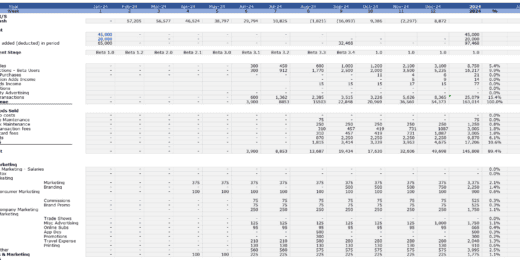
Cannabis Grow and Dispensary Pro-Forma Model
The Cannabis Grow and Dispensary Pro-Forma Model is a comprehensive…

Animal Feed Mill – 10 Year Financial Model
Financial Model providing a dynamic up to 10-year financial forecast…
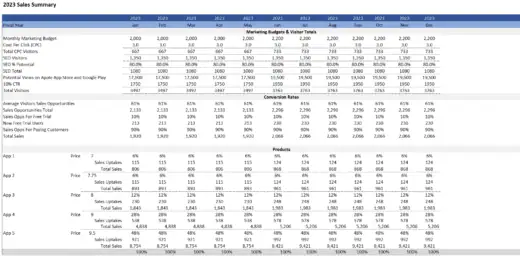
Mobile App Development Financial Model
A comprehensive editable, MS Excel spreadsheet for tracking Mobile App…

Bookkeeping Agency Finance Model Excel Template
A comprehensive editable, MS Excel spreadsheet for tracking Bookkeeping services…

Manufacturing Start up Feasibility Finance Model Excel Template
A comprehensive editable, MS Excel spreadsheet for forecasting and tracking…
Start Up Company Finance Model 5 Year 3 Statement
A comprehensive editable, MS Excel spreadsheet for tracking start-up company…

Employee Retention Dashboard Excel Template
Tool for tracking and analyzing employee retention rates within your…

Recruitment Management Excel Template
Recruitment Management Excel Template, designed to streamline recruiting processes, e.g.,…

Broilers Poultry Farm – 10 Year Financial Model
Financial Model providing a dynamic up to 10-year financial forecast…
B2B Services Company Finance Model 5 Year 3 Statement
A comprehensive editable, MS Excel spreadsheet for tracking B2B Services…

Medical Spa (MediSpa) Finance Model 5 Year 3 Statement
A comprehensive editable, MS Excel spreadsheet for tracking Medical Spa…

Medical Clinic Finance Model 5 Year 3 Statement
A comprehensive editable, MS Excel spreadsheet for tracking private Medical…

Physiotherapy Clinic Finance Model 5 Year 3 Statement
A comprehensive editable, MS Excel spreadsheet for tracking Physiotherapy Clinic…

Food Bar Financial Model 5 year 3 Statement
A comprehensive editable, MS Excel spreadsheet for tracking Food Bar…

Restaurant Finance Model 5 Year 3 Statement
A comprehensive editable, MS Excel spreadsheet for tracking Restaurant finances,…

Virtual Reality Software Company Finance Model 5 Year 3 Statement
A comprehensive editable, MS Excel spreadsheet for tracking Virtual Reality…
Budget vs Actual Forecasts 5 Years Excel Template
MS Excel spreadsheet for tracking budget finances. Can be used…

Social Media Marketing Agency Finance Model 5 Year 3 Statement
A comprehensive editable, MS Excel spreadsheet for tracking Social Media…
Affiliate Marketing Agency Finance Model 5 Year 3 Statement
A comprehensive editable, MS Excel spreadsheet for tracking Affiliate Marketing…

Web Hosting Company Finance Model 5 Year 3 Statement
A comprehensive editable, MS Excel spreadsheet for tracking web hosting…
HR Expense Control Excel Template and Dashboard
Human Resources Expenses spreadsheet is a vital tool for effectively…

Human Resource Performance Metrics Template
This template offers an in-depth overview of key performance indicators…
5 Year 3 Statement Recycling Centre Finance Model Excel Template
A comprehensive editable, MS Excel spreadsheet for tracking Recycling Centre…
5 Year 3 Statement Construction Company Finance Model
A comprehensive editable, MS Excel spreadsheet for tracking construction company…
5 Year 3 Statement Solar Energy Solutions Company Finance Model
A comprehensive editable, MS Excel spreadsheet for tracking Solar Energy…
Digital Advertising Agency Finance Model Excel Template
A comprehensive editable 5 Year 3 Statement, MS Excel spreadsheet…

5 Year 3 Statement Virtualization Software Company Finance Model Excel Template
A comprehensive editable, MS Excel spreadsheet for tracking Virtualization Software…
Etsy Seller Excel Template
Excel Bookkeeping Template for Etsy Shop Owners: Efficiently Monitor and…

Real Estate Industrial Acquisition Model Single Tenant
This Excel-based tool is tailored for the nuanced analysis of…
5 Year 3 Statement Cyber Security Software Company Finance Model Excel Template
A comprehensive editable, MS Excel spreadsheet for tracking Cyber Security…

Graphic Design Company Finance Model Excel Spreadsheet
A comprehensive editable, MS Excel spreadsheet for tracking Graphic Design…

Private Equity Fund Financial Projection Model with Distribution Waterfall
Highly versatile private equity fund financial projection model with calculations…
5 Year 3 Statement Private Mental Health Care Centre Finance Model Excel Template
A comprehensive editable, MS Excel spreadsheet for tracking private Mental…


5 Year 3 Statement Architect Company Finance Model Excel Template
A comprehensive 5 Year 3 Statement editable, MS Excel spreadsheet…
Swimming School Finance Model Excel Template
A comprehensive editable, MS Excel spreadsheet for tracking Swimming School…

Why Use Excel Spreadsheets with Formulas?

"Excel: where data, analysis, and magic meet." The quote highlights Excel spreadsheets with formulas' dynamic and robust capabilities in managing and interpreting data, offering resolutions and understanding for a broad spectrum of audiences. Excel's ability to turn complex tasks into manageable ones has indeed felt like magic to many who rely on its robust functionality for their daily operations and strategic decision-making.
Embark on a journey of financial mastery with our Excel spreadsheets with formulas. These meticulously crafted templates are the cornerstone for any astute entrepreneur or finance professional looking to inject precision and efficiency into their financial modeling. With a robust range of functionalities, our spreadsheets facilitate detailed analysis, scenario planning, and decision-making. Dive into a world where numbers meet strategy, and let our Excel tools empower you to forecast, evaluate, and thrive in your financial endeavors.
What is an Excel Spreadsheet?
An Excel spreadsheet is a digital worksheet or grid that allows users to organize, calculate, analyze, and visualize data. It's part of the leading software program within the Microsoft Office suite. Excel spreadsheets are known for their cells, where data is entered and stored. Each cell can contain text, a number, or a formula, which can perform calculations using the data in other cells. The intersection of rows and columns creates cells, and this structure helps in systematic data organization.
Microsoft Excel has its roots dating back to 1985 when the first version was released for the Apple Macintosh. However, it gained significant popularity with its release for Windows in 1987, known as Excel 2.0. Over the years, it has evolved dramatically, incorporating various features and capabilities that cater to users' needs, from basic data entry to complex financial modeling and analysis.
As a Microsoft program, Excel is a powerful data processing and analysis tool. It offers a user-friendly interface, with tools and features accessible via ribbons at the top of the application window. Users can perform data sorting, filtering, chart creation, and pivot table generation tasks. Excel's functionality extends with its support for Visual Basic for Applications (VBA), a programming language that allows users to create custom functions and automate tasks.
Excel files are typically saved in the .xls or .xlsx format. The .xls format was the default for Excel 2003 and earlier versions. It's a binary file format called Binary Interchange File Format (BIFF). With the release of Excel 2007, Microsoft introduced the .xlsx format, which is based on the Office Open XML format. The .xlsx files are smaller, more robust, and can support additional features like larger sheet sizes and integration with other data sources. Both formats are widely used and supported by various other spreadsheet programs, ensuring compatibility across different platforms and software.
Common Uses of Excel for Financial Modeling
The powerful features of an Excel spreadsheet with formulas such as complex formulas and pivot tables and the ability to handle large datasets make it indispensable for tasks like budgeting, project valuation, scenario analysis, and other financial assessments critical to business success. Here's how it's commonly used across various financial tasks:
- Account Management: Excel helps track and manage financial transactions, customer information, and account balances, streamlining the process of monitoring financial activities and resources.
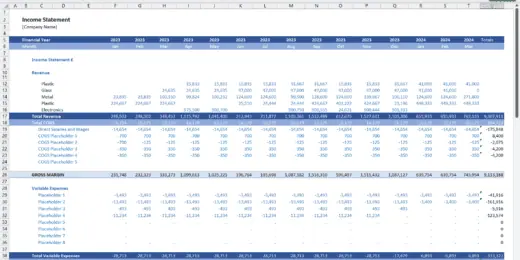
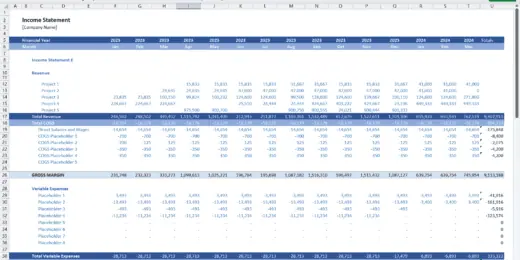
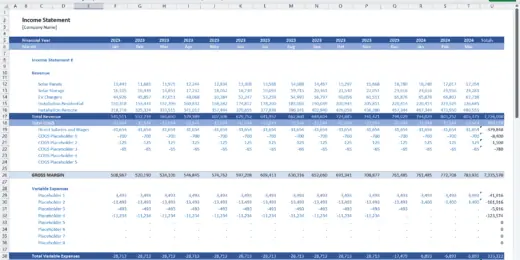
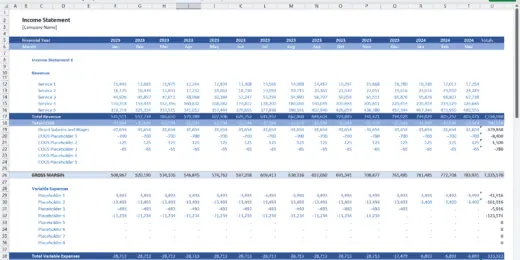
- Accounting: It's extensively used for recording financial transactions and preparing balance sheets, income statements, and cash flow statements, thereby facilitating the entire accounting cycle.
- Budgeting: Excel aids in creating detailed budgets, forecasting future financial positions, and tracking actual versus budgeted figures, making it essential for financial planning and control.
- Collection & Verification of Data: It is a reliable platform for collecting various forms of data, verifying their accuracy, and ensuring that the information used in financial models is correct and up-to-date.
- Data Entry and Storage: With its grid format and extensive storage capacity, Excel is ideal for entering and storing large volumes of financial data, making it easily accessible for analysis and reporting.
- Data Analysis: Excel's advanced formulas, pivot tables, and charting tools enable professionals to analyze complex data, uncover insights, and support decision-making processes.
- Performance Reporting: It's used to compile and present financial and operational data in a structured manner, helping stakeholders understand performance metrics and make informed decisions.
- Project Management: Excel assists in tracking project timelines, budgets, resources, and progress, providing a comprehensive view of project health and facilitating effective management.
- Strategic Analysis: Tools like scenario managers and data tables in Excel allow for strategic analysis and forecasting, helping businesses assess potential outcomes and plan strategies accordingly.
- Valuation: Financial professionals rely on Excel to perform company valuations, investment analyses, and risk assessments, using various techniques like discounted cash flow (DCF) analysis and comparable company analysis.
Excel's ability to handle complex calculations, its extensive functionality, and its familiarity with many users make it an essential tool in the financial modeling and analysis arsenal in each of these applications.

List of Basic Formulas in Excel
Excel, a powerful financial analysis and decision-making tool, offers a range of formulas essential for professionals in fields like finance, accounting, and economics. Here's a detailed look at a list of basic formulas in Excel:
- Array Formulas: Array formulas are designed to execute multiple computations on one or more elements within an array. They can return either single or multiple results. Array formulas are powerful tools that allow for complex calculations. For example, they can sum the values of numerous cells, calculate the product of array elements, or even perform more advanced operations like matrix multiplication.
- Data Formatting: While not a formula, data formatting in Excel is crucial for presenting data clearly and professionally. It involves changing the appearance of data without altering the data itself. You can format data as currency, percentages, dates, and more. Conditional formatting, a powerful feature, allows you to automatically format cells based on their values, making it easier to analyze large data sets visually.
- IF and OR Functions: The IF function under the list of basic formulas in Excel makes decisions based on certain conditions. It evaluates whether a criterion is satisfied and delivers one value if it is true, and an alternative value if it is false.. For instance, =IF(A1>100, "Above 100", "100 or Less") will check if the value in cell A1 is more significant than 100 and return "Above 100" if true, or "100 or Less" if false. The OR function under the list of basic formulas in Excel is used within the IF function to test multiple conditions. It returns TRUE if any conditions are true and FALSE if all conditions are false. For example, =IF(OR(A1>100, B1<50), "True Condition," "False Condition") will return "True Condition" if either A1 is more significant than 100 or B1 is less than 50.
- Reference Functions: Reference functions in Excel refer to cells or ranges of cells. Some standard reference functions include:
- VLOOKUP: Searches for a value in the first column of a table and returns a value in the same row from a specified column.
- HLOOKUP: Similar to VLOOKUP, but searches for a value in the first row.
- INDEX: Returns the value of a cell in a table based on row and column number.
- MATCH: Searches for a specified item in a range of cells and then returns the relative position of that item.
- SUM, ADD, AVERAGE, COUNT, POWER, etc.:
- SUM: Adds all the numbers in a range of cells. For example, =SUM(A1:A10) adds all the numbers in cells A1 through A10.
- AVERAGE: Calculates the average of the numbers in a range of cells. It sums the numbers and then divides them by the count of numbers.
- COUNT: Counts the number of cells that contain numbers in a range.
- POWER: Raises a number to the power of another number. For example, =POWER(2,3) calculates 2 raised to the power of 3.
- ADD: While there's no specific "ADD" function, addition is a fundamental operation in Excel performed using the plus sign (+). For instance, =A1+B1 adds the values in cells A1 and B1.
Understanding the list of basic formulas in Excel is crucial for anyone using Excel for financial analysis, budgeting, or general data management. They provide the foundation for more complex operations and are indispensable for making informed financial decisions and conducting sophisticated analyses. An Excel spreadsheet with formulas' versatility and depth makes it an invaluable asset for professionals aiming to present data effectively, draw meaningful conclusions, and drive strategic decisions.

Benefits of Using Excel Spreadsheets with Formulas
Using Excel spreadsheets with formulas offer a multitude of benefits, especially for professionals engaged in financial analysis, business planning, and decision-making. Here's a detailed look at how Excel's formula feature enhances performance and productivity:
- Analysis: Formulas allow for complex data analysis, from basic computations like sums and averages to more sophisticated financial and statistical operations. It means you can derive insights and understand patterns or trends within the data, which are crucial for making informed decisions. As data changes, an Excel spreadsheet with formulas updates automatically, providing real-time analysis. This dynamic nature ensures that your analysis remains relevant and accurate, enabling immediate response to new information.
- Complex Calculation: An Excel spreadsheet with formulas is designed to handle complex calculations precisely. Financial models often require intricate formulas that consider multiple variables and scenarios. Excel ensures these calculations are performed accurately, reducing the risk of errors that could occur with manual calculations. Excel also provides a wide array of advanced functions (like NPV, IRR, and various statistical functions) that can perform rigorous, complex calculations necessary for in-depth financial analysis and forecasting.
- Consistency: Using formulas ensures consistency in how calculations are performed. It is essential when comparing different datasets or when multiple users work on the same file. It ensures everyone is basing decisions on the same methodology. Once a formula is created, it can be reused across different datasets or periods. It ensures consistency and saves time and effort in the long run.
- Flexibility: An Excel spreadsheet with formulas can easily adjust for new conditions or scenarios. This flexibility is vital in financial modeling, where assumptions often change, requiring quick updates to forecasts and valuations. As your analysis or business grows, an Excel spreadsheet with formulas can be expanded or adapted to accommodate increased data or more complex models without starting from scratch.
- Time Savings: Formulas automate calculations that would otherwise be done manually, significantly speeding up the data processing time. It allows professionals to focus more on analysis and decision-making than on calculation mechanics. When assumptions or input data change, formulas update the entire model instantly. It allows for rapid iterations and scenario analysis without manually recalculating every aspect.
Excel spreadsheets with formulas is not just a convenience; it's a powerful tool that enhances analytical capabilities, ensures accuracy and consistency, and saves time. Whether for financial modeling, budgeting, forecasting, or any other type of financial analysis, the ability to efficiently handle complex calculations and data analysis is crucial. Excel's formulas provide the flexibility and functionality needed to make informed, data-driven decisions, making it an indispensable tool for anyone looking to perform sophisticated and reliable financial analysis.

Streamline Analysis with Excel's Dynamic Formulas
In conclusion, Excel spreadsheets with formulas are indispensable financial analysis and decision-making tools. It offers flexibility, accuracy, and efficiency, enabling users to perform complex calculations, analyze data, and visualize trends efficiently. By automating repetitive tasks and ensuring consistency in calculations, Excel, with its dynamic formulas, saves time and reduces errors, making it an invaluable asset for entrepreneurs, investors, and financial professionals.
eFinancialModels.com is a premier marketplace for these sophisticated Excel spreadsheet templates, each embedded with expertly crafted formulas. Our platform caters specifically to the needs of entrepreneurs, startup founders, and finance professionals, offering a wide array of industry-specific templates. Our commitment is to provide tools that streamline your financial tasks and elevate your strategic planning to new heights. Explore, Analyze, and Excel today!