
0 ITEMS

Human Resource Performance Metrics Template
This template offers an in-depth overview of key performance indicators (KPIs) in Human Resource Management. It facilitates salary calculations and headcount track.
| All Industries, General Excel Financial Models, Human Resources & Headhunting |
| Dashboard, Excel, Forecasting, Human Resources (HR), Management |


1. Employee Database: Use this sheet to maintain a comprehensive record of all relevant employee information, including salary details, hiring dates, and eligibility for bonuses.
2. Headcount Overview: Keep this sheet updated to monitor the number of active employees in your workforce. A “1” indicates active employees, while a “0” indicates former employees. Employee retention rates are automatically calculated on a monthly basis.
3. Raw Data: This sheet is intended for monthly entry of employee data, including the month, employee names, and recorded sales revenue. Other calculations will be generated based on the Employee Database.
4. Payroll: This sheet automatically calculates the monthly compensation for each employee, taking into account bonus and commission eligibility. The timeline tool at the top can be used to obtain a more detailed breakdown of salary components.
How to Customize:
1. Update all relevant information in the “Employee Database” sheet. All white cells can be edited.
2. For new entries, follow the guide arrows for assistance.
3. Once the Employee Database is updated, proceed to the next step.
4. On the “Raw Data” sheet, input your monthly data for each employee.
5. Use the “mm/yyyy” format to record the date.
6. Choose the employee from the drop-down list.
7. For each employee, indicate their department and record the revenue generated by the employee.
8. Follow the guide arrows to add new records.
9. Only enter data in white cells; gray cells are not meant for inputting data.
10. On the “Payroll” sheet, you can find a detailed breakdown of each employee’s salary. You can use the drop-down list for a monthly breakdown.
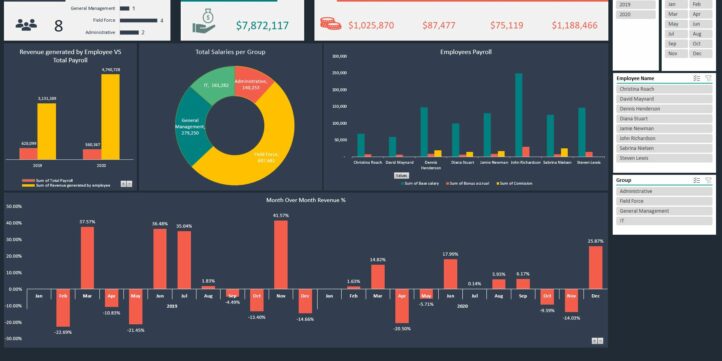
11. The “Dashboard” sheet provides a dynamic summary of all employee data, which can be easily manipulated using slicers. This supports top management in decision-making.
12. The “Month Over Month” chart illustrates the monthly revenue growth, displaying the difference between the current and previous month.
Similar ProductsOther customers were also interested in...



 Anuj
Anuj
Private Equity Fund Model (Investor Cashflows)
The Private Equity Fund Cashflows Model helps LPs and GPs analyze fund cash flows, returns, and dist... Read more

 Giorgos
Advanced Financial Model with DCF and Valuation
Dynamic 10-Year Financial Model, suitable for any type of business, supporting strategic planning, i... Read more
 Pierre-AlexandreHeur...
Due Diligence P&L – Exhaustive Revenue a...
Model for in depth understanding of high level profit and loss and revenue analysis. Big-4 like chec... Read more

Startup Company Financial Model – 5 Year Fin...
Highly-sophisticated and user-friendly financial model for Startup Companies providing a 5-Year adva... Read more

Budgeting & Forecasting Model Template
Budgeting & Forecasting Template suitable for either a Trade or Service company in any type of i... Read more

 eFinancialModels
Waterfall Profit Distribution Model (up to 4 Tiers...
We are introducing our 4-Tier Waterfall Profit Distribution Model. The waterfall profit distribution... Read more

Investment Financial Models – All-in-One Bundle ...
A collection of templates suitable for investment decisions in various types of businesses/industrie... Read more
Price Volume Mix Charts and Analysis – On re...
Best practice model for a complete Price Volume Mix (PVM) analysis on revenue and on gross profit by... Read more
 ECF Consultancy
Corporate Finance Toolkit – 30 Financial Mod...
The toolkit is an essential resource for any organization, providing a comprehensive collection of t... Read more
You must log in to submit a review.