
0 ITEMS
WACC (Weighted Average Cost of Capital)
Engage with the pivotal core of financial analysis using our Weighted Average Cost of Capital (WACC) financial model templates, meticulously designed for entrepreneurs, startup founders, and finance professionals. Navigate the complexities of assessing your company's cost of capital with precision and depth. Our templates, crafted in MS Excel and Google Sheets, integrate industry-specific variables, offering a dynamic tool for evaluating investment opportunities, funding strategies, and strategic decisions.
Unlock the potential to make informed, data-driven decisions. Whether you're analyzing new ventures, valuing acquisitions, or exploring growth strategies, our WACC models provide a comprehensive foundation to quantify the trade-offs between risk and return. They are not just spreadsheets but a beacon guiding you through the financial fog, helping illuminate the path to enhanced value creation and robust financial health. Dive into a realm of clarity and sophistication with our WACC templates and pave the way for sound financial planning and heightened business acumen.
Unlock the potential to make informed, data-driven decisions. Whether you're analyzing new ventures, valuing acquisitions, or exploring growth strategies, our WACC models provide a comprehensive foundation to quantify the trade-offs between risk and return. They are not just spreadsheets but a beacon guiding you through the financial fog, helping illuminate the path to enhanced value creation and robust financial health. Dive into a realm of clarity and sophistication with our WACC templates and pave the way for sound financial planning and heightened business acumen.
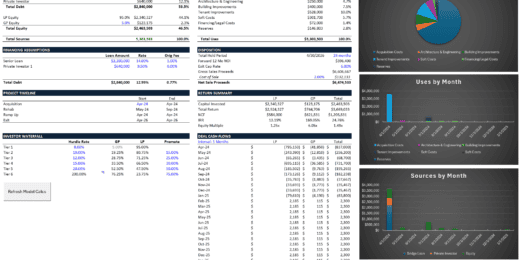
Multifamily Rehab Model (Includes Investor Returns Waterfall)
Introducing the Multifamily Rehab Flip Model with Investor Returns Waterfall…

Startup Company Financial Model – Dynamic 3 Statement Financial Projections up to 8-Years
Highly Dynamic and Easy-to-Navigate Excel Financial Projections Model that allows…

Advanced Financial Model – Dynamic 3 Statement 10-Year Financial Model with DCF Valuation
Advanced, Dynamic and Easy-to-Use Excel Financial Projections Model that allows…

Veterinary Imaging Center Financial Model
The Veterinary Imaging Center financial model is designed to analyze…

Parcel Locker Network Business Financial Model (10+ Yrs. DCF and Valuation)
The Parcel Locker Network Business Financial Model is a comprehensive…

Dental Imaging Center Financial Model
The Dental Imaging Center financial model is a comprehensive tool…

Diagnostic and Analysis Center Financial Model
It is excel financial model for financial forecasting of a…

Diagnostic Collection Center Financial Model
It is financial model for diagnostic collection center whose phlebotomists…

Mobile Imaging Center Financial Model
This Excel model facilitates mobile imaging services by providing equipment…

Private Aircraft Rental Business Financial Model
"The Private Aircraft Rental business financial model is a versatile…

B2B SaaS FInancial Model & Valuation Template
Unlock your B2B SaaS venture's full potential with our B2B…

VC Startup Portfolio Financial Forecasting Model
Elevate your venture capital strategy with the VC Startup Portfolio…

Food Truck Monthly Financial Model Template
The Food Truck Financial Model Template is a comprehensive solution…
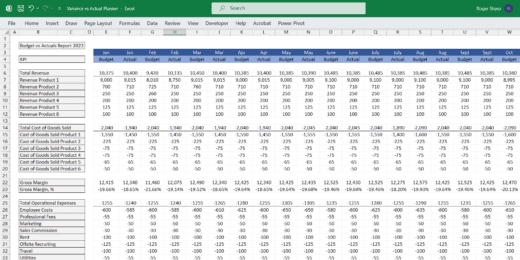
Budget vs Actual Forecasts 5 Years Excel Template
MS Excel spreadsheet for tracking budget finances. Can be used…

Car Dealership Financial Model and Valuation – Financial Projections
Welcome to the Car Dealership Company Financial Model and Valuation,…

Hospitality (Hotel) Financial Model and Valuation – 10-year Projections
Welcome to the Hospitality (Hotel) Company Financial Model and Valuation,…

B2C eCommerce Financial Model & Valuation Model
Tailored ecommerce financial model Model for startups. Forecast revenue, integrate…

Carbon Capture and Sequestration Project Analysis
The Carbon Capture and Sequestration (CCS) Project Analysis Template is…

Fruit Processing Facility – 10 Year Financial Model
Financial Model providing a dynamic up to 10-year financial forecast…

Business Valuation Spreadsheet
This file enables you to effortlessly compute the Estimated Business…

Brewery Financial Model and Budget Control
This Excel model is an advanced, user-friendly financial planning tool…

Healthcare – Hospital – Financial Model and Valuation (10-year Forecast)
Welcome to the Healthcare (Hospital) Company Financial Model and Valuation,…

AgroTech Services Financial Model (10+ Yrs. DCF and Valuation)
The AgroTech Services Financial Model with DCF (Discounted Cash Flow)…

Complete Private Equity (LBO) Financial Model
This is a professional financial model which performs a thorough…


Urban Micro-Mobility Services Financial Model (10+ Yrs. DCF and Valuation)
The Urban Micro-Mobility Services Financial Model with DCF (Discounted Cash…

Coffee Shop Financial Plan and Budget Control
This Excel model is a highly adaptable and user-friendly tool…

Trucking Company – 10 Year Financial Model
Financial Model providing a dynamic up to 10-year financial forecast…

Telehealth Services Company Financial Model (10+ Yrs. DCF and Valuation)
The Telehealth Services Company Financial Model with a 10+ Years…

Ship Management Business 5-Year 3 Statement Financial Projection Model
5 year rolling financial projection Excel model for a startup…

Online Tutoring Services Financial Model (10+ Yrs DCF and Valuation)
The Online Tutoring Services Financial Model is a comprehensive tool…

Pro Financial Forecast – Dynamic and Advanced Financial Projections
Unleash the power of precise, customizable forecasting with Pro Financial…

Industrial Warehouse Business 10-Year 3 Statement Financial Projection Model
10 year rolling financial projection Excel model for a startup…

Oil & Gas Financial Model – DCF and NAV Valuation (5+ Yrs.)
The Oil and Gas financial model with DCF (Discounted Cash…

CPG Company Financial Model and Valuation
Discover the CPG Company Financial Model and Valuation, an essential…

eCommerce | Online Retail Financial Model and Valuation
Discover the eCommerce - Online Retail Company Financial Model and…

Self Storage Business 10-Year 3 Statement Financial Projection Model
10 year rolling financial projection Excel model for a startup…

Culinary Arts Academy – 10 Year Financial Model
Financial Model providing a dynamic up to 10-year financial forecast…

Dog Grooming Services Financial Model (10+ Yrs DCF and Valuation)
The Dog Grooming Services financial model is a comprehensive tool…

Ship-to-Ship Fuel Bunkering 5-Year 3 Statement Financial Projection Model
5-year rolling 3 statement financial projection with a monthly timeline…

Student Accommodation Business 10-Year 3 Statement Financial Projection Model
10 year rolling financial projection Excel model for a startup…

Buy Now Pay Later DCF Model & Valuation (10 Year DCF Model)
The Buy Now Pay Later (BNPL) Company financial model is…

Care Home Business 10-Year 3 Statement Financial Projection Model
10 year rolling financial projection Excel model for a multi…

Sailboat Rental Business Financial Model
This comprehensive 10-year monthly Excel template offers an ideal basis…

Hotel Complex – Financial Model (5 Yrs. DCF and Valuation)
The Hotel Complex financial model is a comprehensive tool designed…

Comprehensive Oil & Gas Financial Model
Comprehensive financial model for an oil & gas company. Flexible…

Leasing Company 5-Year Financial Projection Model
5 year rolling financial projection Excel model for a leasing…

Weighted Average Cost of Capital (WACC) Calculator
This Excel template has a comprehensive WACC calculator. It allows…

Start-up Manufacturing Financial Projection and Budget Control – Excel & Google Sheets
The financial model is an essential tool that enables owners…

Financial Modeling Mastery Bundle: Diverse Insights for Informed Decision-Making
Unlock financial expertise with our 'Diverse Insights Bundle.' Seven meticulously…

Crypto Trading Platform – 5 Year Financial Model
Financial Model presenting an advanced 5-year financial plan of a…

EV Battery Recycling Plant Financial Model (10+ Yrs DCF and Valuation)
The EV Battery Recycling Plant financial model is a comprehensive…

Microfinance Platform – 5 Year Financial Model
Financial Model presenting an advanced 5-year financial plan for a…

Film Production 10-Year 3 Statement Financial Projection Model
10 year rolling financial projection Excel model for a new…


Catering Services Business Financial Model (10+ Yrs DCF and Valuation)
The catering services business financial model is a comprehensive tool…

Moving Services Business Financial Model (10+ Yrs DCF and Valuation)
The moving services business financial model is a comprehensive tool…

Blue Ammonia using Natural Gas – 3 Statements, Cash Waterfall & NPV/IRR Analysis
An integrated and comprehensive Blue Ammonia Production Plant Model that…

Blue Hydrogen using Natural Gas – 3 Statements, Cash Waterfall & NPV/IRR Analysis
An integrated and comprehensive Blue Hydrogen Production Plant Model which…

Wellness Centre 5-Year 3 Statement Financial Projection Model
5 year rolling financial projection Excel model for a wellness…
Why is WACC Important in Decision Making?
Have you ever read the book Barbarians at the Gate by Bryan Burrough? It was the story of the famous RJR Nabisco leveraged buyout, the largest in American history. The story is a classic example of the importance of WACC in decision-making. Almost every firm on Wall Street took a bid. The bidders, including the management team and private equity firms, used the weighted average cost of capital equation to estimate the fair value of RJR Nabisco. In the end, KKR & Co. Inc. won the bid.
The Weighted Average Cost of Capital (WACC) is a crucial concept in finance and investment decision-making, serving as a critical indicator for determining the minimum acceptable return on a company or project. It's a strategic tool. Understanding the cost of capital helps managers and investors make informed decisions about acquisitions, investments, and financing strategies. Let's explore how understanding and effectively utilizing the weighted average cost of capital equation can drive informed investment choices and enhance stakeholder value.
What Is the Weighted Average Cost of Capital?
The Weighted Average Cost of Capital (WACC) is a fundamental financial metric used to assess the average cost a company incurs to finance its assets through both debt and equity. The weighted average cost of capital equation represents the required rate of return equation a company must earn on its existing asset base to satisfy its capital providers, creditors, and owners. WACC calculates a company's cost of capital by proportionately weighing its use of debt and equity financing. WACC integrates the costs associated with each financing source and weights them proportionately to their presence in the company's capital structure.
The desired level of WACC can vary by industry. Companies in stable industries like utilities might have lower WACCs than those in volatile technology sectors. Growth-stage companies might have a higher WACC due to perceived risk, whereas mature companies might enjoy a lower WACC due to stable earnings and a solid track record. Furthermore, prevailing interest rates and market conditions can impact the cost of debt and equity, affecting a company's WACC. Companies should strive for an optimal WACC that aligns with their financial strategy, operational needs, and industry standards, ensuring they can fund their operations effectively while delivering value to their stakeholders.
Should WACC Be High or Low?
Understanding whether a high or low WACC is desirable requires appreciating its role in strategic and financial planning. It is often used as a hurdle rate for the required rate of return equation, the minimum return a company must earn on its existing asset base to satisfy its investors or creditors.
A low WACC indicates that a company can fund its operations and growth cheaply. It is often a sign of a low risk associated with the firm's operations and a stable cash flow. Lower financing costs mean more of the company's operational earnings contribute to growth and value creation. It can also mean the company is in a solid position to undertake new projects or acquisitions, as the threshold for investment returns is relatively low.
A high WACC suggests that a company has higher risk and must offer higher returns to attract investors. It could be due to factors like unstable cash flows, a high debt load, or a risky industry. With a high WACC, new investments need to generate higher returns to be considered viable, which might limit the number of projects that meet these criteria. It can also strain the company's finances if the cost of capital is significantly high.
Generally, a lower WACC is seen as better because the company needs to generate lower returns to satisfy its investors, making it easier to pursue and finance new projects. While generally seen as a negative, a high WACC can also reflect a strategic lever for companies to reassess their operations, investment strategies, and capital structure to optimize and reduce their cost of capital.
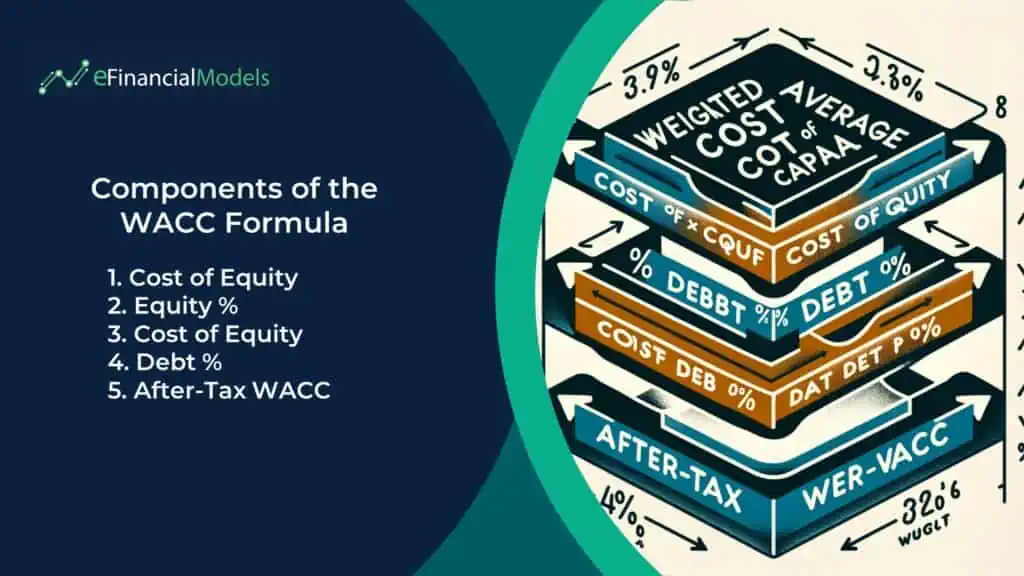
How WACC Is Calculated
The weighted average cost of capital equation is calculated by multiplying the cost of each capital component (debt and equity) by its proportional weight and then summing up the results. Here's the WACC formula presented in a simplified manner:

1. Cost of Equity
The cost of equity is the return required by equity investors for an investment in a company. It signifies the remuneration the market requires for holding the asset and assuming the ownership risk. Standard methods to calculate the cost of equity include the Capital Asset Pricing Model (CAPM), which assesses risk and expected returns, and the Dividend Discount Model (DDM), which considers future dividends and growth rates.
2. Equity Capitalization Ratio
The equity capitalization ratio indicates the proportion of equity in the company's total capital structure. It reflects the market's valuation of a company's equity relative to its total capital (equity + debt). To calculate the equity capitalization ratio, divide the market value of the equity capital by the total capitalization (equity plus debt at market values).
3. Cost of Debt
Debts can include bonds, loans, and other borrowed funds. The cost of debt is the effective rate a company pays on its borrowed funds. It's often calculated as the interest rate paid on the debt, adjusted for the tax savings due to interest expense deductions (as interest payments are tax-deductible).
4. Debt-to-Total Capitalization Ratio
Like the equity capitalization ratio, the debt-to-total capitalization ratio measures the proportion of debt in the company's total capital structure. It helps understand the degree of leverage and financial risk the company is undertaking. To calculate the debt-to-total capitalization ratio, divide the market value of the debt capital by the total capitalization (equity plus debt at market values).
5. After-tax Weighted Average Cost of Capital
In reality, we calculate the after-tax weighted average cost of capital. It is more precise as interest on debt is tax-deductible. Since interest payments on debt are generally tax-deductible, the tax rate can significantly lower the net cost of debt. To calculate the after-tax weighted average cost of capital, multiply the total debt and equity capital cost by (1 – the corporate tax rate). The corporate tax rate is the percentage of corporate profits paid to the government as tax. It is typically found in the company's annual report or 10-K filings.
Interpreting WACC for Decision Making
Unlock the power of financial insights with the Weighted Average Cost of Capital (WACC). This key indicator blends the cost of equity and debt to reveal the minimum acceptable return on investment. Understanding WACC sharpens your strategic decision-making, illuminating pathways to value creation and optimal capital structuring.
Investment Decisions
- Benchmark for NPV: WACC is the discount rate for calculating the Net Present Value(NPV) of future cash flows from potential projects. If the NPV is positive when discounted at the WACC, the project is expected to generate value beyond the cost of capital.
- Project Evaluation: Compare the rate of return of potential projects against the WACC. Projects with returns above the WACC will typically add value to the company.
Performance Measurement
- Economic Profit Calculation: WACC is used in economic profit calculation, the surplus value created above the required return of the company's capital. A positive EVA indicates that the company is generating returns above its cost of capital.
Risk Assessment
- Indicator of Risk: A higher WACC indicates higher risk associated with the firm's operations and future cash flows. It reflects the investor's required return for bearing this risk.
- Sector Comparison: Comparing WACC across firms or industries can signal different risk profiles and expectations. In sector comparisons, a lower WACC often indicates a sector or company can afford to take on more debt at a lower cost, potentially boosting returns on new investments. It's also a critical component in discounted cash flow(DCF) analysis, used to estimate a company's value by projecting its future cash flows and discounting them back to their present value using the WACC.
Strategy and Valuation
- Mergers and Acquisitions: WACC can be the hurdle rate for mergers and acquisitions. Acquiring or merging with companies with lower WACC than the target can reduce the combined WACC, creating value.
- Corporate Finance Strategy: Understanding the WACC helps in structuring the capital in a way that minimizes the cost of capital, potentially through debt refinancing, issuing new equity, or altering the capital structure.

Empower Your Financial Strategy with our Weighted Average Cost of Capital Formula Calculator
In conclusion, when correctly interpreted and applied, WACC is a fundamental measure in finance that can significantly enhance the quality of financial decisions regarding investments, performance evaluation, corporate strategy, and risk assessment. It's essential to understand its power and limitations and use it as part of a broader set of tools for making informed, strategic decisions.
Unleash the full potential of your investments and strategic decisions with precise insights from our advanced weighted average cost of capital formula calculator. A weighted average cost of capital formula calculator provides a clear, quantitative insight into a firm's cost of capital. It delineates the proportionate costs of equity and debt, offering a comprehensive numeric view of a firm's cost of capital and its impact on investment valuations and returns. Start navigating your financial future with confidence today!