
0 ITEMS
KPIs (Key Performance Indicators)
In today's dynamic business environment, staying ahead means keeping pace with change and anticipating it. At eFinancialModels.com, we understand that Key Performance Indicators (KPIs) are the compass guiding your journey to corporate success. Our financial model templates are meticulously designed to turn complex data into actionable insights, empowering you to make data-driven decisions confidently.
Our templates are not one-size-fits-all. We recognize the unique challenges and opportunities in various industries. Our models are crafted with specific sectors in mind, ensuring relevancy and precision in your analysis. With our tools, you're not just analyzing data but gaining insights. Our models enable you to identify trends, uncover inefficiencies, and recognize opportunities, leading to more informed, strategic decisions.
At eFinancialModels.com, we are committed to empowering you with the tools and knowledge to thrive in the ever-evolving business landscape. Explore our KPI-focused financial models today and start transforming data into decisions.

Manufacturing KPI Management Excel Dashboard
A manufacturing key performance indicator (KPI) is a clearly defined…
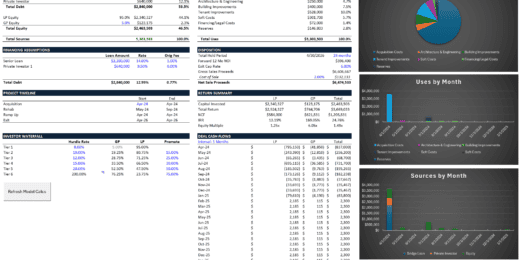
Multifamily Rehab Model (Includes Investor Returns Waterfall)
Introducing the Multifamily Rehab Flip Model with Investor Returns Waterfall…

Architecture Firm Management Dashboard Excel Template (6 Month)
Our Excel dashboard and template streamline small and medium architecture…

Parcel Locker Network Business Financial Model (10+ Yrs. DCF and Valuation)
The Parcel Locker Network Business Financial Model is a comprehensive…

Supply Chain Management Dashboard Excel Template
Our Supply Chain Management Dashboard is a comprehensive tool that…

Sales and Revenue Dashboard Excel Template
Empowers your business with real-time revenue and profit insights to…

Online Store Sales Dashboard Excel Template
Equips businesses with actionable insights for optimizing sales strategies tailored…

CEO Dashboard KPI Excel Template
Our CEO Dashboard Excel Template provides a comprehensive overview of…

Dental Imaging Center Financial Model
The Dental Imaging Center financial model is a comprehensive tool…

B2B SaaS FInancial Model & Valuation Template
Unlock your B2B SaaS venture's full potential with our B2B…

Biomethane Producer Financial Model (Renewable Natural Gas)
Create a detailed pro forma with this biogas financial model.…

Project Management Office PMO Dashboard Excel Template
1. Provides a framework for a Project Management office fitting…

Animal Feed Mill – 10 Year Financial Model
Financial Model providing a dynamic up to 10-year financial forecast…
Mobile App Development Financial Model
A comprehensive editable, MS Excel spreadsheet for tracking Mobile App…

Bookkeeping Agency Finance Model Excel Template
A comprehensive editable, MS Excel spreadsheet for tracking Bookkeeping services…

Employee Retention Dashboard Excel Template
Tool for tracking and analyzing employee retention rates within your…

Broilers Poultry Farm – 10 Year Financial Model
Financial Model providing a dynamic up to 10-year financial forecast…

Physiotherapy Clinic Finance Model 5 Year 3 Statement
A comprehensive editable, MS Excel spreadsheet for tracking Physiotherapy Clinic…

Food Bar Financial Model 5 year 3 Statement
A comprehensive editable, MS Excel spreadsheet for tracking Food Bar…
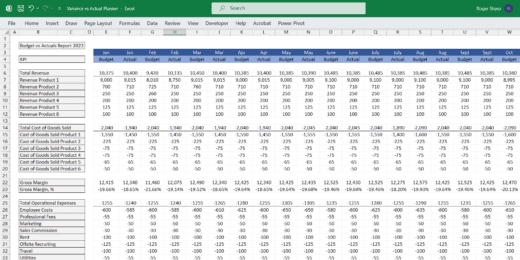
Budget vs Actual Forecasts 5 Years Excel Template
MS Excel spreadsheet for tracking budget finances. Can be used…


Real Estate Industrial Acquisition Model Single Tenant
This Excel-based tool is tailored for the nuanced analysis of…


CBD Personal Care Financial Model and Valuation Template
CBD Personal Care Financial Model and Valuation Template, a comprehensive…
3 Statement Indoor Rock Climbing Gym Finance Model
A comprehensive editable, MS Excel spreadsheet for tracking Indoor Rock…
Logistics Company Finance Model
A comprehensive editable, MS Excel spreadsheet for tracking logistic company…


Aesthetics & Dermatology Clinic – 5 Year Financial Model
Financial Model providing an advanced 5-year financial plan for a…


Carbon Capture and Sequestration Project Analysis
The Carbon Capture and Sequestration (CCS) Project Analysis Template is…

Fruit Processing Facility – 10 Year Financial Model
Financial Model providing a dynamic up to 10-year financial forecast…

Auto Parts Store – 5 Year Financial Model
This Financial Model Template provides an advanced 5-year financial plan…


AgroTech Services Financial Model (10+ Yrs. DCF and Valuation)
The AgroTech Services Financial Model with DCF (Discounted Cash Flow)…


Urban Micro-Mobility Services Financial Model (10+ Yrs. DCF and Valuation)
The Urban Micro-Mobility Services Financial Model with DCF (Discounted Cash…

Coffee Shop Financial Plan and Budget Control
This Excel model is a highly adaptable and user-friendly tool…

Trucking Company – 10 Year Financial Model
Financial Model providing a dynamic up to 10-year financial forecast…


Telehealth Services Company Financial Model (10+ Yrs. DCF and Valuation)
The Telehealth Services Company Financial Model with a 10+ Years…

Online Tutoring Services Financial Model (10+ Yrs DCF and Valuation)
The Online Tutoring Services Financial Model is a comprehensive tool…

Daycare Service Facility Financial Simulation – Up to 10 Year
Dynamic assumptions to create pro forma financial statements for a…


Pro Financial Forecast – Dynamic and Advanced Financial Projections
Unleash the power of precise, customizable forecasting with Pro Financial…

Industrial Warehouse Business 10-Year 3 Statement Financial Projection Model
10 year rolling financial projection Excel model for a startup…


Oil & Gas Financial Model – DCF and NAV Valuation (5+ Yrs.)
The Oil and Gas financial model with DCF (Discounted Cash…

Cocktail Bar – 5 Year Financial Model
Financial Model providing an advanced 5-year financial plan for a…

Webinar Organizer Business Plan Template
Discover the key to financial success in your webinar ventures…

SaaS Company Financial Model and Valuation
Discover the SaaS Company Financial Model and Valuation, an essential…

Party Planning Business Financial Model
Introducing the Party Planning Business Financial Model – Your Ultimate…

Culinary Arts Academy – 10 Year Financial Model
Financial Model providing a dynamic up to 10-year financial forecast…

Dog Grooming Services Financial Model (10+ Yrs DCF and Valuation)
The Dog Grooming Services financial model is a comprehensive tool…

Buy Now Pay Later DCF Model & Valuation (10 Year DCF Model)
The Buy Now Pay Later (BNPL) Company financial model is…

Real Estate Proforma – Value-Add Apartment Acquisition Model
This multifamily apartment value-added real estate model is a sophisticated…

Event Organizer Business Model Template
Elevate your event planning business to new heights with our…

Hotel Complex – Financial Model (5 Yrs. DCF and Valuation)
The Hotel Complex financial model is a comprehensive tool designed…

Sky Diving Center – 5 Year Financial Model
Financial Model providing an advanced 5-year financial plan for a…

Comprehensive Oil & Gas Financial Model
Comprehensive financial model for an oil & gas company. Flexible…

Crypto Trading Platform – 5 Year Financial Model
Financial Model presenting an advanced 5-year financial plan of a…
Drive Strategic Outcomes with Key Performance Indicators

A company once struggled to meet its targets and stay profitable. The management team then realized they needed a better way to measure their progress. They started tracking key performance indicators (KPIs) to understand better how the company was performing. Over time, the company's performance improved significantly, and they were able to achieve their targets and stay profitable. They realized that tracking KPIs was essential to their success, as it helped them identify areas for improvement and take action to address them.
Why are key performance indicators important? KPIs are more than just numbers on a dashboard; they are a fundamental part of strategic business management. Businesses can effectively employ KPIs to navigate their path to growth and success with greater confidence and precision. For professionals in finance and consulting, a deep understanding of KPIs is essential in advising clients and driving strategic outcomes.
What Do Key Performance Indicators Mean
Key Performance Indicators (KPIs) are quantifiable measures used to evaluate the success of an organization, employee, or specific process in achieving key business objectives. Consisting of values compared against set targets, they vary between companies and industries, depending on their priorities or performance criteria.
KPIs are also called key success indicators (KSIs). They are under the business metric categories. They measure an entity’s performance relative to its target objectives. KPI levels can be company-wide, department-level, or per-project level. Other business metric categories are financial ratios and investment metrics.
Essential for assessing a company's overall long-term performance, key success indicators help understand how effectively it achieves its strategic and operational goals. The insights gained from KPIs can drive strategic planning, help in decision-making, and guide businesses in aligning their strategic goals with operational objectives, acting as a cornerstone for performance evaluation and success metrics.
KPI vs. Metrics
Key Performance Indicators (KPIs) and Metrics are essential tools in business analysis, especially for financial decision-making. Understanding the difference between KPIs and Metrics is crucial for businesses to monitor and effectively manage their strategic and operational performance.
KPIs are closely tied to the strategic goals and objectives of the business. They provide insights into factors critical for the business's success. Key success indicators lead to actions that significantly impact the company. Furthermore, KPIs are often consistent over time as they are tied to long-term goals.
Metrics are broader than KPIs and are not necessarily linked directly to the overall strategic objectives but are essential for monitoring the health of various processes. They are often used for tracking the performance of operational procedures. While some metrics can be crucial, others might simply provide context or background information. Metrics may also change more frequently as operational needs and processes evolve.
What Are KPI Examples?
Here are five general categories of the top key performance indicators.
Customer KPIs
These top key performance indicators focus on customer engagement and satisfaction, which are crucial for business growth and retention. Some examples are:
- Customer Lifetime Value (CLV): Measures the total revenue a business can expect from a single customer account throughout its relationship with the company.
- Customer Satisfaction Rate: Assesses customers' satisfaction with a company's products or services, often through surveys and feedback mechanisms.
- Retention Rate: Indicates the percentage of customers who remain with a company over a given period, highlighting loyalty and long-term customer satisfaction.
Financial KPIs
These top key performance indicators are critical for assessing a business's financial health and performance. Among the most commonly used by companies are:
- Cash Flow: Monitors the net amount of cash being transferred into and out of a business, indicating its liquidity and operational efficiency.
- Profitability: Measures the degree to which a company earns revenue over its expenses, often expressed as net income or profit margin.
- Return on Investment (ROI): Return on investment calculates the efficiency and profitability of an investment, comparing the gain from an investment relative to its cost.
Marketing KPIs
These top key performance indicators evaluate the effectiveness of marketing strategies and campaigns. Some of them are:
- Click-Through Rate (CTR): The percentage of users who visit a page, email, or advertisement compared to the number of overall users who click on a particular link.
- Conversion Rate: Assesses the percentage of visitors who complete a desired action (like making a purchase) out of the total number of visitors.
- Website Traffic: Tracks the number of visitors to a company's website, helpful in gauging the effectiveness of online marketing efforts and the site's appeal.
Operational KPIs
These top key performance indicators focus on internal business operations and efficiency. Among the most common examples are:
- Inventory Management: Monitor stock levels, turnover rates, and order fulfillment times, which are essential for maintaining optimal inventory levels.
- Quality Rate: Measures the percentage of products or services that meet required quality standards, reflecting the efficiency of production processes.
- Throughput: Indicates the amount of material or items passing through a system or process, helping to assess production efficiency and capacity utilization.
Sales KPIs
These top key performance indicators are crucial for tracking the effectiveness of a company's sales strategies. Some famous examples are:
- Average Purchase Value: Calculates the average amount customers spend per transaction, providing insights into consumer spending behavior.
- Customer Acquisition Cost (CAC): This represents the total cost of acquiring a new customer, including marketing and sales expenses, which are crucial for evaluating the efficiency of acquisition strategies.
- Sales Growth: Measures the increase in revenue generated from sales activities over a specific period, reflecting a company's ability to expand its customer base and market reach. It's a crucial metric for evaluating the effectiveness of sales strategies and market positioning, providing insight into a business's overall health and potential.
By closely monitoring these KPIs, businesses can make informed decisions, optimize their operations, and enhance their overall performance. They are essential tools for strategic planning, operational adjustments, and measuring the effectiveness of different business initiatives.

Why Are Key Performance Indicators Important?
Key Performance Indicators (KPIs) are essential tools in the business and financial world, particularly for organizations focusing on financial analysis and decision-making. Here's why they are crucial:
Encourage Growth
KPIs are fundamental for identifying areas of your business that are performing well and need improvement. By setting and monitoring specific, quantifiable indicators, you can direct resources and efforts toward activities that promote revenue growth. It is particularly beneficial for entrepreneurs and startups who must ensure their limited resources are used efficiently.
Performance Check
Regular monitoring of KPIs allows for a timely and accurate assessment of your company's performance against its strategic objectives. For business owners and finance professionals, this means viewing how well the business is doing in real time. It enables them to make informed decisions and pivot strategies if necessary.
Progress Measurement
KPIs provide a measurable way to track progress towards specific goals. It is essential in project management and when assessing the feasibility of new ventures or investment opportunities. Precise progress measurement helps you understand how far you are from your goals and what needs to be done to reach them.
Promotes Accountability
When KPIs are set and communicated clearly across the organization, it helps in promoting accountability among team members. Each member understands what is expected of them and how their performance will be measured. It is vital for maintaining a high level of performance and ensuring everyone is aligned with the company's objectives.
Stay on Track
KPIs are a navigational tool for your business, keeping you focused on your long-term objectives. They help avoid distractions and maintain focus on what's essential for the business's success. It helps maintain focus on strategic goals amidst the business's daily operations.
In summary, KPIs are not just numbers or data points; they reflect the company's strategy and performance. They are crucial for making informed decisions, fostering growth, ensuring accountability, and staying on track with business objectives.

What Makes a Good Key Performance Indicator?
Key Performance Indicators (KPIs) are essential business and financial analysis tools offering valuable decision-making insights. Like SMART goals, good key performance indicators should embody specific characteristics to ensure they provide actionable and relevant information. Let's delve into each of these attributes:
Specific: Good key performance indicators should be clear and precise, leaving no room for ambiguity about what is being measured. This specificity enables focused efforts and helps in understanding what contributes to a particular area's success or failure. For instance, rather than having a vague KPI like "increase sales," a specific KPI would be "increase online sales of Product X by 10%."
Measurable: Good key performance indicators must be quantifiable. If you can't measure it, you can't manage it effectively. Measurability allows for tracking progress and making necessary adjustments. It could be numbers, percentages, or a binary outcome (yes/no). For example, a measurable KPI could be "achieve a customer satisfaction score of at least 85 out of 100."
Attainable: Setting high standards is essential, and good key performance indicators should be realistically achievable within the given resources and constraints. Unattainable KPIs can demotivate teams and create a sense of failure. Attainable KPIs align with the organization's overall strategic goals and are within the realm of possibility, given current capabilities and conditions.
Relevant (Realistic): Good key performance indicators should be relevant to the business's strategic objectives. They should reflect the organization's priorities and be aligned with its mission and vision. This relevance ensures that the effort and resources invested in achieving these KPIs contribute meaningfully to the business's overall goals. A realistic KPI considers the current economic environment, industry trends, and organizational capabilities.
Time-Bound: Good key performance indicators should have a clear timeline or deadline. This aspect helps create a sense of urgency and focuses on achieving the results within a specified period. Time-bound KPIs enable more effective planning and resource allocation. For example, "increase market share by 5% in the next 12 months" sets a clear timeframe for achievement.
Incorporating these characteristics into your KPIs ensures that they serve as practical tools for monitoring and driving the performance of your business. They help align activities with your organization's strategic goals, providing a clear direction for growth and improvement. For your audience, which includes entrepreneurs, investors, and finance professionals, well-structured KPIs are indispensable for assessing the health and progress of their ventures and investments.

Optimize, Predict, and Achieve KPIs Through Financial Modeling
The significance of Key Performance Indicators (KPIs) in the modern business landscape cannot be overstated. As quantifiable performance measures, key success indicators offer critical insights into the effectiveness of various business strategies and operations. By setting good key performance indicators and rigorously monitoring them, businesses can align their efforts with overarching goals, ensuring a focused and strategic approach to growth. Ultimately, KPIs are not just metrics; they are vital for continuous improvement, driving businesses toward efficiency, profitability, and long-term success.
Leveraging KPIs through a key performance indicators dashboard is crucial for driving strategic business outcomes. A key performance indicators dashboard integrates robust data analysis, scenario simulation, and real-time financial insights. These financial models track progress and predict future performance, ensuring businesses stay aligned with their strategic goals.
eFinancialModels.com specializes in providing comprehensive and industry-specific financial model templates tailored to meet various industries' unique key performance indicators (KPIs) and analytical needs. These meticulously key performance indicators dashboards are designed to analyze and forecast business performance, facilitating informed decision-making. The platform's emphasis on KPI-focused models ensures that users can accurately track and evaluate critical strategic planning and financial management metrics.
Empower Strategic Decisions Today!