
0 ITEMS

Valuation Multiples for Apps and Online Business

Imagine an app founder who’s built a profitable AI-powered productivity tool with 72,000 monthly active users. After three years of steady growth, they’re ready to exit by selling their business. A great place for selling an app or online business is Flippa with the largest global buyers base, AI-powered deal making and multilanguage support. Within weeks of listing on Flippa, they’re likely to receive multiple offers, some at 1.75x annual profit, others at 3.58x or higher. The question that arises here is, is this a fair market valuation based on a reasonable valuation multiple?
What separates a $350,000 exit from a $716,000 exit for the same business generating $200,000 in annual profit? The answer lies in understanding in more detail what drives premium app valuations in today’s market?
This article uses exclusive transaction data from Flippa – the leading marketplace for buying and selling online businesses – and sheds light on the average profit valuation multiples obtained when selling an app or online business. In addition, the article studies the key factors that lead to great business valuations.
Key Takeaways
- The Business Model has a major impact on valuation multiples. Businesses with recurring revenues (Software as a Service – SaaS) typically capture higher valuation multiples than service or ecommerce businesses.
- App businesses on Flippa command average profit multiples of 1.75x, with top quartile performers achieving 3.58x, more than double the returns
- The Deal Size matters, larger deals ($1M+) achieve significantly higher multiples at 2.5x average and 3.98x top quartile, reflecting the premium buyers pay for scale.
- The exit timeline realistically takes 12-24 months of preparation plus 4-6 months to close, with buyers preferring apps at least 12 months old.
- Five core drivers separate average exits from premium ones: profitability, growth efficiency, retention, defensibility, and operational independence.
If you’re an app founder preparing for an exit, understanding valuation multiples isn’t optional; it’s essential. The difference between an average sale and a premium exit often comes down to how well you’ve optimized the metrics that buyers care about and how thoroughly you’ve prepared for the transaction process.
The business valuation formula itself is simple: Enterprise Value = Annual Profit × Valuation Multiple. The multiple typically is derived from the valuation multiples of similar companies. The valuation multiple buyers are willing to pay for each dollar of profit, tells the real story. It’s a direct reflection of your app’s quality, stability, and future potential in the eyes of sophisticated acquirers.
Whether you’re planning to exit in 12 months or 3 years, this guide provides the roadmap to position your app in the top quartile of valuations, where the real premiums are paid.
Frequently Used Business Valuation Methods for App and Online Businesses
Buyers approach app valuations through several distinct lenses; each suited to different business stages and profiles:

Critical Note: Buyers do not value apps using a simple “price per user” calculation. According to Flippa, buyers do not value a business per user; they value it based on the app’s revenue and profitability. While high user counts may support your story, they’re meaningless without corresponding revenue and engagement metrics.
If you are unsure of your business’s true worth, you can quickly determine what buyers might pay. Get a Free Business Valuation in minutes.
Which Valuation Multiples for Apps and Online Businesses Can You Realistically Expect?
Understanding realistic valuation expectations helps you avoid overpricing your app or leaving money on the table. Here’s what Flippa’s actual market data reveals – at which valuation multiples apps and online business actually sell for:
Small Businesses ($10K – $100K Transaction Value)
- Typical Profit Multiple: 1.68x average, 3.01x top quartile
- Buyer Profile: Individual entrepreneurs, small portfolio buyers
- Timeline to Close: 30-60 days
- Key Success Factors: Clean documentation, passive income characteristics, simple operations
Mid-Market Business ($100K – $250K Transaction Value)
- Typical Profit Multiple: 1.96x average, 3.31x top quartile
- Buyer Profile: Professional investors, app aggregators
- Timeline to Close: 60-90 days
- Key Success Factors: Proven scalability, strong retention metrics, clean financials
Growth Businesses ($250K – $1M Transaction Value)
- Typical Profit Multiple: 2.06x average, 3.31x top quartile
- Buyer Profile: App aggregators, strategic acquirers
- Timeline to Close: 90-120 days
- Key Success Factors: Demonstrated growth trajectory, market leadership potential, operational maturity
Large Businesses ($1M+ Transaction Value)
- Typical Profit Multiple: 2.5x average, 3.98x top quartile
- Buyer Profile: Strategic corporate buyers, well-funded investors
- Timeline to Close: 120-180 days
- Key Success Factors: Scale, market dominance, exceptional unit economics, strong competitive moats
The following chart summarizes the profit valuation multiples based on Flippa data. The chart clearly shows that there is a difference in size, and of course a difference between the valuation multiple of an average and a great online and app business.

| Price Range | Average Profit Multiple | Top Quartile Profit Multiple |
| $10K – 100K | 1.7x | 3.0x |
| $100K – 250K | 2.0x | 3.3x |
| $250K – 1M | 2.1x | 3.3x |
| $1M+ | 2.5x | 4.0x |
Source: Flippa Management, October 2025
Size Matters!
Flippa’s transaction data shows that multiples increase significantly with deal size: Top-quartile app businesses now command profit multiples of 3.58×, while the category average sits at 1.75×. For context, a profitable app generating $200,000 in annual profit could sell for either $350,000 or $716,000, depending on which side of that divide it falls. That’s a $366,000 difference driven entirely by operational excellence.
Larger, established businesses attract confidently high bids. Strategic buyers view them as safe bets with a solid record. This reflects the premium buyers pay for scale and operational sophistication.
How does the Business Model impact Business Valuation?
Not all digital businesses are valued equally. Here’s how apps compare to other online business models on Flippa:

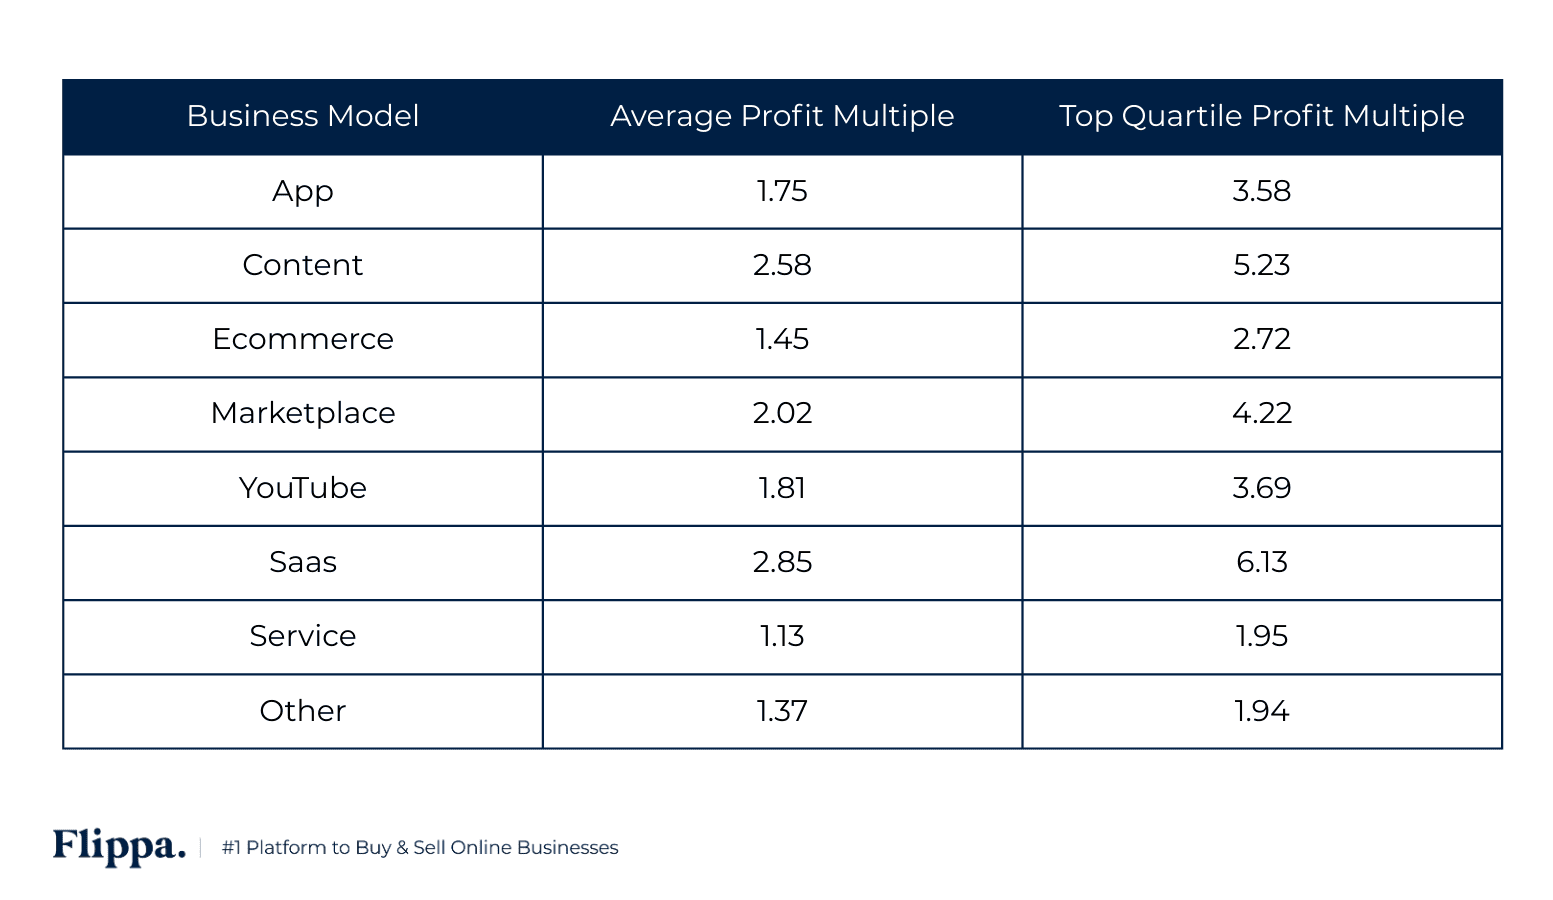
SaaS businesses command the highest multiples at 6.13x in the top quartile because they solve the buyer’s greatest concern: revenue predictability. Monthly recurring revenue compounds over time, and businesses with strong retention can forecast future revenue with remarkable accuracy. Buyers are fundamentally risk-averse, they prioritize predictability and steady cash flows. This certainty is worth paying a premium for because it dramatically reduces investment risk.
In contrast, traditional service businesses and ecommerce stores demonstrate compressed multiples at 1.13x and 1.45x due to their fundamental vulnerability: constant traffic dependency. Service businesses rely on lead generation strategies that can evaporate when search algorithms change. According to Flippa’s data, content sites saw a 37% decline in transaction volume from 2021 to 2024, illustrating how algorithm-dependent businesses can see valuations crater overnight. Ecommerce faces similar challenges where every sale requires fresh marketing spend, and if ad costs spike or competitors undercut pricing, profitability can disappear quickly.
Buyers evaluate investments based on payback periods adjusted for risk. A SaaS business might offer predictable payback with high confidence, while a service business promises similar returns but with significantly higher execution risk. If lead generation falters, whether from algorithm penalties, rising ad costs, or policy changes, the entire revenue stream can collapse. The difference between a 6.13x SaaS multiple and a 1.13x service multiple directly reflects this risk of revenue disruption.
Apps sit in the middle at 1.75x to 3.58x because they combine elements of both models. Apps with subscription revenue and strong retention behave like mini-SaaS businesses and command valuations toward 3.58x. Apps dependent on ad revenue or one-time purchases face similar traffic risks as ecommerce, pushing them toward the lower range. The strategic implication is clear: building subscription-based revenue models with strong retention positions your app closer to SaaS-level valuations and directly increases your exit multiple.
Valuation Multiples for App Businesses are on the Rise due to Strong Buyer Demand
Recent data from Flippa reveals a remarkable transformation in how the market values mobile and web applications. In the first half of 2025, both profit and revenue multiples increased more than fourfold compared to late 2024. This isn’t just a temporary spike; it represents a fundamental shift in buyer confidence and market maturity.
Transaction Volume Trends by Business Model (2021-2024):
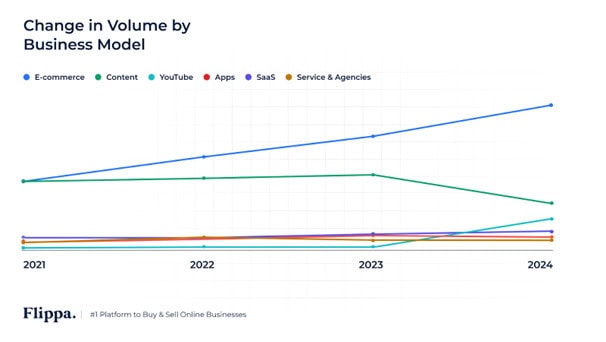
Beyond just multiples, understanding which business models are gaining or losing momentum in the M&A market is crucial for timing your exit. Flippa’s data reveals dramatic shifts in buyer appetite across categories for businesses valued at $10,000 or higher:
- YouTube businesses: 3,650% growth in deals closed, driven by the platform’s evolution as a high-intent advertising channel and creator economy maturation
- Ecommerce: 28% growth, showing resilience despite tariff pressures and competitive marketplace dynamics
- SaaS: 19% growth, with AI-enabled SaaS commanding premium valuations as buyers seek recurring revenue models
- Content sites: 37% decline, directly linked to Google algorithm updates that have destabilized traffic and revenue for traditional content businesses
For app founders, this data suggests that while apps maintain solid multiples (1.75x-3.58x), the broader digital business landscape is shifting toward video content and away from traditional SEO-dependent models. Apps with strong engagement metrics and recurring revenue are well-positioned in this evolving market, especially those that incorporate AI capabilities or serve vertical niches.
Search data from Flippa’s marketplace reveals sustained buyer interest in app businesses:
- “Apps” were searched approximately 30,000 times in the last 12 months, ranking third after Shopify and YouTube
- In the last 30 days alone, there were 2,578 searches for “Apps” followed by 2,571 searches for “AI”
- This nearly identical search volume suggests a strong buyer appetite for AI-powered apps specifically
The message from buyers is clear:, the market rewards predictability, defensibility, and scalable cash flow. Understanding what creates that premium is the key to maximizing your exit value.
The 5 Core Drivers That Command Premium App Multiples
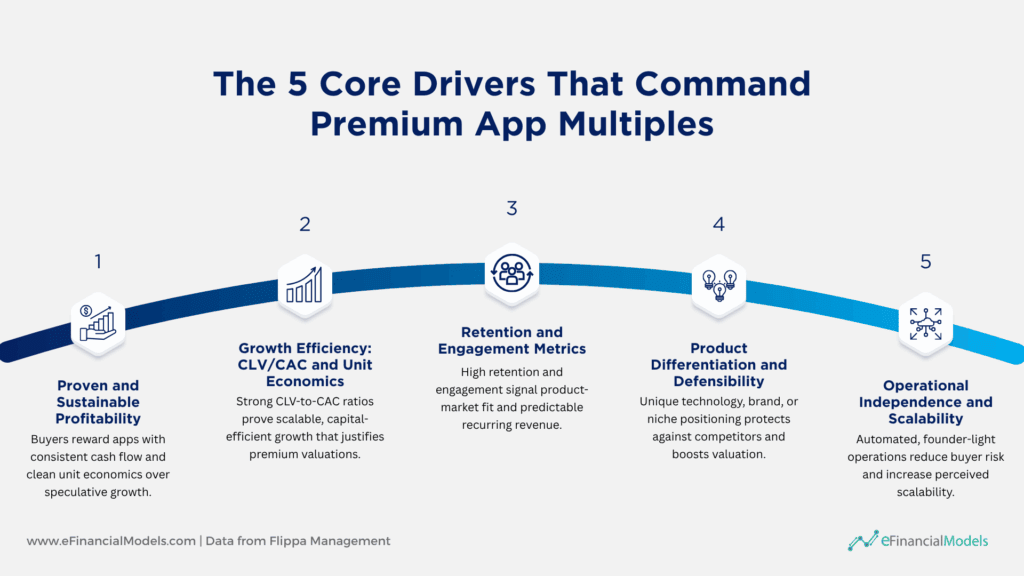
Not all apps are valued equally, and the gap between average (1.75x) and exceptional exits (3.58x+) continues to widen. The following five factors have emerged as the primary determinants of whether your app will command a premium multiple or settle for market average. Each driver addresses a specific concern that sophisticated buyers evaluate during due diligence.
1. Proven and Sustainable Profitability
The highest multiples in 2025 are reserved for apps that demonstrate operational efficiency and clean, consistent cash flow. Financial performance has overtaken speculative growth as the primary valuation driver.
Buyers assess businesses based on the annual multiple of profit, inherently factoring in your financial performance trends over the past 12 months. Flippa’s data confirms this: buyers value apps based on revenue and profitability, not per-user metrics. While high user counts may be impressive, they’re meaningless without corresponding revenue.
Apps with steady Monthly Recurring Revenue (MRR) and a documented history of positive cash flow consistently outperform competitors in valuation negotiations. The market has matured beyond speculative growth; profitability is the new growth story.
Consider a recent AI image generator app that sold on Flippa for $450,000. What made buyers willing to pay a premium? The app generated $16,500 in monthly profit, with a 37% profit margin. Its in-app advertising model covered 85% of backend costs, creating a self-sustaining financial structure that didn’t require constant capital injections. This operational maturity gave buyers confidence in its stability and directly justified the premium valuation.
The lesson is clear: building a business that funds itself efficiently and predictably signals you’ve reached operational maturity. Clean unit economics and consistent margins demonstrate that your app won’t need constant cash infusions to survive, making it far more attractive as an acquisition target.
2. Growth Efficiency: CLV/CAC and Unit Economics
Reckless ad spending no longer impresses buyers; in fact, it actively hurts valuations. Today’s sophisticated investors dig deep into Customer Lifetime Value (CLV) versus Customer Acquisition Cost (CAC) to understand the true efficiency of your growth engine.
A high CLV-to-CAC ratio, ideally 3:1 or higher, signals that your app can scale profitably without burning capital. Apps that can acquire users efficiently and generate strong returns are far more valuable than those bleeding cash for growth. Buyers prioritize systems that generate efficient returns over raw user traffic. An app that acquires 10,000 users per month at a loss is far less attractive than one that acquires 3,000 users profitably, with a clear path to scale.
Apps with strong unit economics demonstrate they can scale without significant cost increases, one of the top factors buyers prioritize. When preparing for an exit, document your unit economics thoroughly. Show buyers exactly how much each user costs to acquire, how much revenue they generate over their lifetime, and how quickly you recover acquisition costs. This transparency builds trust and directly justifies premium multiples by proving your growth model is sustainable and scalable.
3. Retention and Engagement Metrics
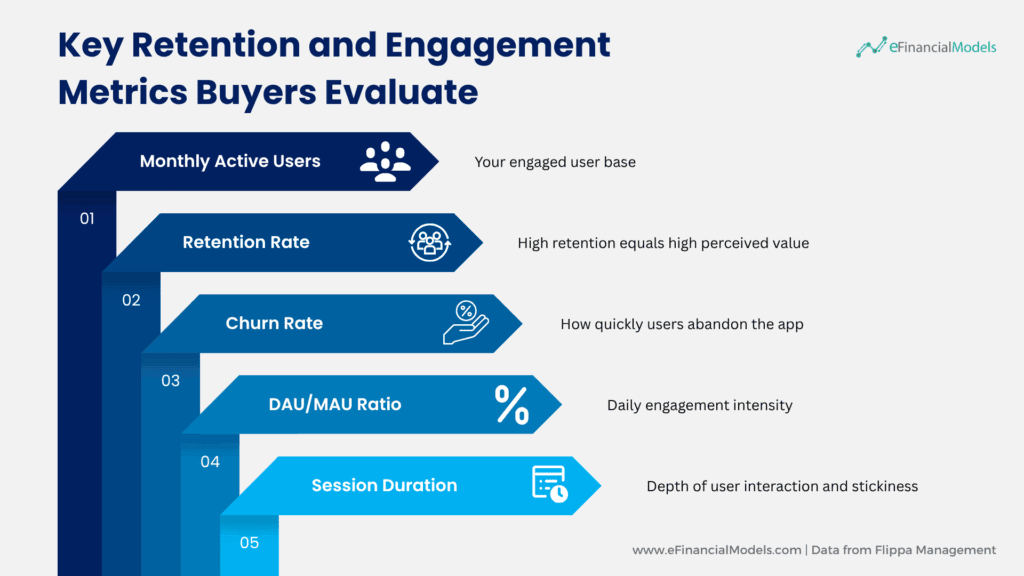
Retention is the foundation of recurring revenue, and recurring revenue is the foundation of high multiples. High user stickiness proves product-market fit and ensures predictable future cash flow, exactly what buyers pay premiums for.
According to Flippa’s buyer research, these are the critical metrics that matter:
- Monthly Active Users (MAU): Your engaged user base
- Retention Rate: High retention equals high perceived value
- Churn Rate: How quickly users abandon the app
- DAU/MAU Ratio: Daily engagement intensity
- Session Duration: Depth of user interaction and stickiness
High MAU with low churn demonstrates a strong market fit, the combination buyers seek. These metrics work together to paint a picture of user satisfaction and engagement quality. Predictable user behavior directly translates into predictable revenue, which in turn drives higher multiples.
The $450,000 AI app demonstrates this perfectly: 72,000 Monthly Active Users generated 900,000 AI images each month. This wasn’t just impressive scale; it was consistent engagement that validated the app’s stable ad revenue model. Buyers could project future performance with confidence because the usage patterns were predictable and sustained.
Strong retention metrics prove that your app solves a real problem people return to regularly. This predictability significantly reduces buyer risk, as they’re not betting on whether users will continue to find value; they’re simply acquiring a proven engagement engine. That certainty is exactly what justifies paying 3× or more for annual profits.
4. Product Differentiation and Defensibility
Acquirers want to buy a moat, not just a feature. Apps with unique value propositions, proprietary technology, or recognizable brands reduce the risk of any future competition eroding profit margins. Buyers look for unique positioning, not clones.
Apps positioned in trending niches with long-term potential are more attractive to buyers. In contrast, apps in declining or saturated markets may receive lower offers. AI apps have been particularly popular in 2025, with “AI” receiving 2,571 searches on Flippa in the last 30 days, nearly identical to “Apps” at 2,578. This sustained search volume reflects genuine buyer appetite for innovative, defensible assets in high-growth categories.
Apps with proprietary technology, code, or patents are valued higher. Buyers pay premiums for:
- proprietary algorithms
- unique technology implementations
- network effects that strengthen with scale
- exclusive data or content partnerships
- strong brand recognition in a specific niche
- high switching costs for users, and;
- deep specialization in vertical markets.
The $450,000 AI app leveraged Stable Diffusion AI with a personalized image spin, differentiating itself in a high-growth niche rather than building a generic AI tool. This unique positioning in the trending AI market helped justify its premium valuation. Buyers weren’t just acquiring technology; they were acquiring a defensible market position.
The fundamental principle is simple: the easier your app is to replicate, the lower your multiple will be. Buyers pay premiums for competitive advantages that protect their investment from commoditization. When evaluating your own defensibility, ask yourself what would prevent a well-funded competitor from launching a similar product in six months. Your answer to that question directly impacts your valuation ceiling.
5. Operational Independence and Scalability
A high multiple fundamentally reflects a low-risk proposition. Labor-intensive businesses with heavy founder dependence consistently receive lower multiples because they’re difficult to transfer and scale. Buyers pay premiums for streamlined transferable operations that can grow without significant new costs or specialized expertise.
Scalability is a top buyer priority. Apps that can scale without major cost increases are inherently more attractive. This includes multi-platform capabilities (iOS, Android, web), automated systems and processes, documented workflows that don’t require founder involvement, lean operational structures, and clear paths to expansion without restructuring.
The $450,000 AI app had recently launched web and Android versions before the sale, demonstrating clear scalability and lowering perceived buyer risk. This multi-platform readiness wasn’t just about having more distribution; it signaled that the business could grow across channels without fundamental restructuring. Buyers could envision expanding the app further without encountering technical limitations or rebuilding core systems.
The most valuable apps run like well-oiled machines that don’t require the founder’s constant attention. Document your processes, automate where possible, and build systems that don’t depend on your personal involvement. When a buyer can envision themselves stepping into the business and continuing operations smoothly or even improving them with additional resources, operational independence directly translates to acquisition confidence and higher multiples.
Secondary Factors That Enhance App Valuations
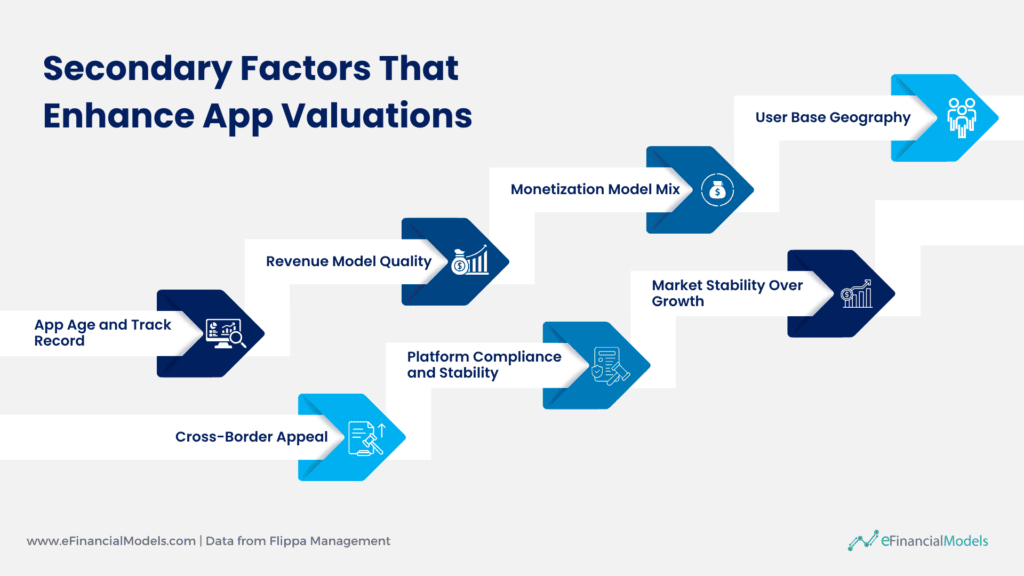
While the five core drivers form the foundation of premium valuations, several additional factors can meaningfully tip the scales in your favor. These elements may not make or break a deal on their own, but they collectively contribute to buyer confidence and can add meaningful percentage points to your final multiple.
App Age and Track Record
Buyers look for apps that are at least a year old so they can review the app’s history. This time frame allows them to assess performance stability across different seasons, identify trends, and validate the sustainability of your business model. Apps less than a year-old face a significantly smaller buyer pool.
Revenue Model Quality
Buyers prefer recurring revenue models, such as subscriptions or memberships, over advertising-only models. The predictability of subscription revenue provides more certainty about future cash flows and typically commands higher multiples. However, apps with strong Average Revenue Per User (ARPU) and diversified revenue streams combining ads and in-app purchases can also perform well by reducing risk.
Monetization Model Mix
Flippa has sold apps across all monetization models. Ads and in-app purchases (IAPs) tend to have bigger customer bases, which can be attractive to certain buyers. However, subscription models typically command premium valuations due to their predictability.
User Base Geography
The seller’s location doesn’t really matter to buyers; it’s primarily about the user base location. Some buyers may prefer apps with users in North America or similar Tier 1 markets due to the higher revenue per user these regions typically generate. These markets have greater purchasing power and a more mature payment infrastructure.
Cross-Border Appeal
Over the last 12 months, 85% of Flippa’s closed deals involved cross-border transactions. This global buyer base creates opportunities for valuation arbitrage, where an app undervalued in one region might command a premium from buyers in another. As of mid-2024, major U.S. buyers accounted for about 5x the acquisition activity of any other country.
Platform Compliance and Stability
Apps that strictly comply with App Store and Google Play policies minimize regulatory and platform risk. Buyers avoid apps at risk of bans, removals, or legal issues. Given the potential for policy changes to devastate non-compliant businesses, this compliance provides additional buyer confidence and strengthens valuations.
Market Stability Over Growth
According to Flippa’s data, growth isn’t always the main metric buyers consider. As long as the business is stable and profitable, buyers remain interested. A growing app is likely to look more attractive, but stability and profitability trump speculative growth. Some buyers even look for pre-revenue apps, but there are fewer of them than those looking for profitable apps.
Real-World Transaction Examples
Examining actual transactions on Flippa reveals an important principle about valuation: absolute profit dollars matter more than profit margin percentages. While high margins are attractive, buyers ultimately purchase cash flow, not efficiency ratios.

Source: Flippa Management, October 2025
What This Data Reveals:
The Typing Test Blog sold for $2.5M with 100% profit margins, while the WordPress Plugin sold for just $225K despite 76% margins. The Lego YouTube Channel achieved $330K with 99% margins. Why don’t higher margins always command higher prices?
Scale and absolute profit matter more than margin percentages. A business with 40% margins and $500K in annual profit is worth more than a business with 80% margins and $100K in annual profit. Buyers are ultimately purchasing cash flow, not efficiency ratios.
Different business models have different margin expectations. Content sites and YouTube channels naturally have higher margins (low operational costs), while ecommerce and apps typically run leaner. The European Fashion Brand’s 41% margin is exceptional for ecommerce, just as the Photo & Video Editing App’s 37% margin demonstrates strong efficiency for an app business.
Market size and growth potential drive valuation premiums. The $2.5M content site and $1.3M ecommerce brand likely had significantly higher absolute revenue than the smaller transactions, even if their margins weren’t the highest.
For app founders, this means don’t obsess overachieving 80%+ margins at the expense of growth. A $1M revenue app with 35% margins ($350K profit) will command a higher valuation than a $300K revenue app with 70% margins ($210K profit), assuming similar multiples. Focus on building absolute profit dollars while maintaining healthy, sustainable margins.
How to Position Your App for a Premium Exit
Securing a premium multiple—3.58x in the top quartile versus 1.75x in the average— requires more than just good metrics. It demands strategic positioning that meets the sophisticated expectations of acquirers. The preparation phase often determines whether you’ll achieve an average or exceptional exit.
Validate Consistent Growth
Show a clear upward trajectory in your last 12 months of financial data. Buyers pay premiums for momentum, not just current performance. Document your growth story with clean, verifiable data that demonstrates consistent progress. Cohort analysis showing improving retention and ARPU over time is particularly compelling.
Remember: growth isn’t always the main metric a buyer considers, if the business is stable and profitable. However, a growing app with strong fundamentals will always look more attractive.
Preparing a Comprehensive Financial Data Room
Present clean, easily verifiable KPIs including MRR, churn rate, LTV/CAC ratios, and retention metrics. Professional presentation signals operational maturity and reduces buyer due diligence friction. Include:
- Monthly financial statements for the past 24 months
- Cohort retention analyses
- Marketing ROI by channel
- User acquisition funnels with conversion rates
- Revenue projections based on historical performance
- Cap table and ownership documentation
- All material contracts and agreements
Important: Buyers value apps based on annual profit multiples, which inherently factor in your 12-month financial performance trend. Make sure this data tells a compelling story.
Demonstrate Clear Scalability
Highlight new platform launches, market expansion plans, or untapped revenue opportunities. Buyers acquire businesses partly for their current cash flow and partly for their growth potential. Show them exactly how the business can scale post-acquisition:
- Geographic expansion opportunities
- New platform possibilities (iOS → Android, mobile → web)
- Untapped monetization channels
- Enterprise sales opportunities for consumer apps
- Product line extensions
Apps that can scale without significant cost increases are inherently more attractive to buyers.
Build Transferable Systems
Develop Standard Operating Procedures (SOPs), comprehensive documentation, and management dashboards that demonstrate operational independence. The easier you make the transition, the more confident buyers become. Document:
- Daily operational workflows
- Customer support processes and response templates
- Marketing playbooks and campaign structures
- Development workflows and release processes
- Vendor relationships and renewal schedules
- Crisis management procedures
Labor-intensive businesses with heavy founder dependence consistently receive lower multiples.
Benchmark Against Top Performers
Use Flippa’s data insights to understand where your metrics stand relative to top-quartile performers in your category. The difference between 1.75x (average) and 3.58x (top quartile) is substantial, that is, more than double the exit value for the same profit.
Focus on the metrics that matter most:
- High Monthly Active Users with low churn
- Strong retention rates
- Efficient CLV-to-CAC ratios (3:1 or higher)
- Lean operations with strong profit margins
- Multi-platform scalability
- Unique competitive positioning
The Path to Premium Valuation: Building for Exit
The difference between an average app exit (1.75x) and a premium one (3.58x) isn’t about being the biggest; it’s about being the most efficient, predictable, and defensible. The valuation formula remains elegantly simple: Valuation = Profit × Multiple. By focusing on profitability, defensibility, and growth efficiency, you control both sides of that equation.
The remarkable 4x increase in both profit and revenue multiples during early 2025 demonstrates that buyers are willing to pay significant premiums for quality assets that meet their criteria. This massive valuation growth reflects stronger buyer confidence, better app quality, and increased platform trust.
The question isn’t whether high multiples are achievable; Flippa’s data proves they are, with top-quartile apps consistently achieving 3.58x profit multiples. The question is whether you’re willing to build your business with these valuation drivers in mind from the beginning.
Start by benchmarking your current KPIs against top-performing Flippa deals in your category. Identify gaps in profitability, retention, or defensibility. Then systematically address those gaps over the next 12-24 months. Build your documentation systems, optimize your unit economics, and strengthen your competitive moat.
When you’re ready to exit, you’ll have positioned yourself in the top quartile of your category, where the premium multiples live. The preparation timeline may seem long, but the valuation difference between a rushed exit and a properly prepared one can easily represent $300,000+ in additional exit value for a $200,000 profit app.
The most successful exits aren’t accidents; they’re the result of methodical preparation, operational excellence, and strategic timing. Your exit journey begins today, whether your target timeline is 12 months or 36 months away. Every operational decision you make either strengthens or weakens your eventual exit multiple.
About Flippa
Flippa is the #1 platform to buy and sell online businesses – from content sites and eCommerce, to successful YouTube channels, SaaS companies, mobile apps, and other forms of digital businesses or assets. It has effectively created and democratized the market for small- to medium-sized online business transactions, providing a trusted platform where global dealmakers come together to buy what’s next in the digital economy.
With more than 12,000 transactions processed annually, including significant activity across Europe, Flippa connects sellers with a truly global buyer base. Today, 85% of deals involve cross-border transactions. U.S. buyers represent roughly five times the acquisition volume of any other country, yet the platform’s international reach also creates compelling opportunities for valuation arbitrage.
Want to see what buyers are paying right now? Check the latest Market Insights or explore active listings that are attracting global attention. Are you ready to sell? List your business on Flippa today and connect with thousands of active buyers worldwide. Not sure what your business is worth? Get a free valuation in minutes and find out what buyers might pay.
Disclaimer: This page contains affiliate referral links in partnership with Flippa.com.
Looking to model out different exit scenarios for your app? Explore our financial modeling templates designed specifically for tech businesses and SaaS companies at efinancialmodels.com.


