Financial Ratios
These ratios, akin to a compass in the labyrinth of financial data, guide investors and analysts through myriad numbers to make informed decisions. They transform raw data into meaningful narratives, allowing for a comprehensive understanding of a company's efficiency, liquidity, leverage, profitability, and growth.
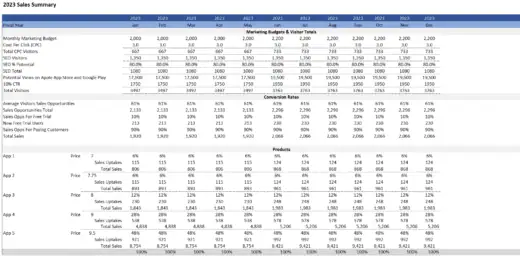
Mobile App Development Financial Model
A comprehensive editable, MS Excel spreadsheet for tracking Mobile App…
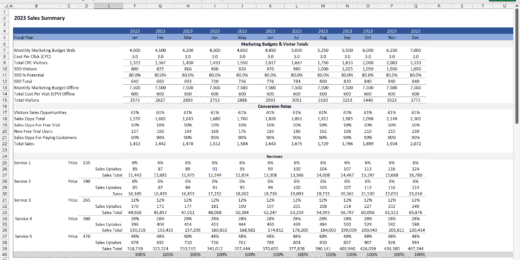
Bookkeeping Agency Finance Model Excel Template
A comprehensive editable, MS Excel spreadsheet for tracking Bookkeeping services…
Manufacturing Start up Feasibility Finance Model Excel Template
A comprehensive editable, MS Excel spreadsheet for forecasting and tracking…
Start Up Company Finance Model 5 Year 3 Statement
A comprehensive editable, MS Excel spreadsheet for tracking start-up company…
Broilers Poultry Farm – 10 Year Financial Model
Financial Model providing a dynamic up to 10-year financial forecast…
B2B Services Company Finance Model 5 Year 3 Statement
A comprehensive editable, MS Excel spreadsheet for tracking B2B Services…
Medical Spa (MediSpa) Finance Model 5 Year 3 Statement
A comprehensive editable, MS Excel spreadsheet for tracking Medical Spa…
Medical Clinic Finance Model 5 Year 3 Statement
A comprehensive editable, MS Excel spreadsheet for tracking private Medical…
Physiotherapy Clinic Finance Model 5 Year 3 Statement
A comprehensive editable, MS Excel spreadsheet for tracking Physiotherapy Clinic…
Restaurant Finance Model 5 Year 3 Statement
A comprehensive editable, MS Excel spreadsheet for tracking Restaurant finances,…
Virtual Reality Software Company Finance Model 5 Year 3 Statement
A comprehensive editable, MS Excel spreadsheet for tracking Virtual Reality…
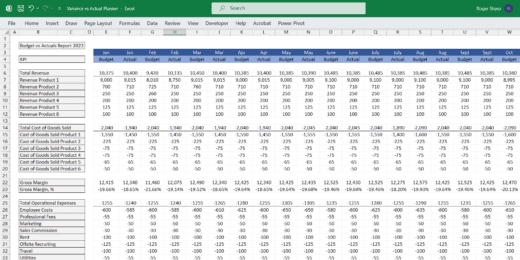
Budget vs Actual Forecasts 5 Years Excel Template
MS Excel spreadsheet for tracking budget finances. Can be used…
Social Media Marketing Agency Finance Model 5 Year 3 Statement
A comprehensive editable, MS Excel spreadsheet for tracking Social Media…
Affiliate Marketing Agency Finance Model 5 Year 3 Statement
A comprehensive editable, MS Excel spreadsheet for tracking Affiliate Marketing…
Web Hosting Company Finance Model 5 Year 3 Statement
A comprehensive editable, MS Excel spreadsheet for tracking web hosting…
5 Year 3 Statement Recycling Centre Finance Model Excel Template
A comprehensive editable, MS Excel spreadsheet for tracking Recycling Centre…
5 Year 3 Statement Construction Company Finance Model
A comprehensive editable, MS Excel spreadsheet for tracking construction company…
5 Year 3 Statement Solar Energy Solutions Company Finance Model
A comprehensive editable, MS Excel spreadsheet for tracking Solar Energy…
Digital Advertising Agency Finance Model Excel Template
A comprehensive editable 5 Year 3 Statement, MS Excel spreadsheet…
5 Year 3 Statement Digital Marketing Agency Finance Model Excel Template
A comprehensive editable, MS Excel spreadsheet for tracking Digital Marketing…
5 Year 3 Statement Virtualization Software Company Finance Model Excel Template
A comprehensive editable, MS Excel spreadsheet for tracking Virtualization Software…
5 Year 3 Statement Cyber Security Software Company Finance Model Excel Template
A comprehensive editable, MS Excel spreadsheet for tracking Cyber Security…
5 Year 3 Statement Digital Education Software Company Finance Model Excel Template
A comprehensive editable, MS Excel spreadsheet for tracking Digital Education…
Graphic Design Company Finance Model Excel Spreadsheet
A comprehensive editable, MS Excel spreadsheet for tracking Graphic Design…
Private Equity Fund Financial Projection Model with Distribution Waterfall
Highly versatile private equity fund financial projection model with calculations…
5 Year 3 Statement Private Mental Health Care Centre Finance Model Excel Template
A comprehensive editable, MS Excel spreadsheet for tracking private Mental…
5 Year 3 Statement Alpaca Farming Finance Model Excel Template
A comprehensive 3 Statement 5 Year editable, MS Excel spreadsheet…
5 Year 3 Statement Architect Company Finance Model Excel Template
A comprehensive 5 Year 3 Statement editable, MS Excel spreadsheet…
3 Statement 5 Year Customer Service Software Company Financial Model Excel Template
A comprehensive editable, MS Excel spreadsheet for tracking Customer Service…
Swimming School Finance Model Excel Template
A comprehensive editable, MS Excel spreadsheet for tracking Swimming School…
EdTech Financial Model and Valuation Template
Empower your EdTech startup with our comprehensive Financial Model, including,…
SEO Agency Finance Model Excel Template
A comprehensive editable, MS Excel spreadsheet for tracking SEO Agency…
Data Analytics Services Financial Model Excel Template
A comprehensive editable, MS Excel spreadsheet for tracking Data Analytics…
CRM Software Development Company Finance Model Excel Template
A comprehensive editable, MS Excel spreadsheet for tracking CRM software…
Pig Farming Finance Model Excel Template
A comprehensive editable, MS Excel spreadsheet for tracking pig farming…
3 Statement Indoor Rock Climbing Gym Finance Model
A comprehensive editable, MS Excel spreadsheet for tracking Indoor Rock…
3 Statement Car Hire Company Financial Model
A comprehensive editable, MS Excel spreadsheet for tracking car hire…
3 Statement Truck Rental Company Financial Model
A comprehensive editable, MS Excel spreadsheet for tracking truck rental…
3 Statement Van Hire Company Finance Model
A comprehensive editable, MS Excel spreadsheet for tracking van hire…
Car Dealership Financial Model and Valuation – Financial Projections
Welcome to the Car Dealership Company Financial Model and Valuation,…
Hospitality (Hotel) Financial Model and Valuation – 10-year Projections
Welcome to the Hospitality (Hotel) Company Financial Model and Valuation,…
3 Statement Self Storage Company Finance Model
A comprehensive editable, MS Excel spreadsheet for tracking Self Storage…
3 Statement SAAS Development Company Finance Model
A comprehensive editable, MS Excel spreadsheet for tracking SAAS Development…
3 Statement Software Development Company Finance Model
A comprehensive editable, MS Excel spreadsheet for tracking software development…
B2C eCommerce Financial Model & Valuation Model
Tailored ecommerce financial model Model for startups. Forecast revenue, integrate…
Logistics Company Finance Model
A comprehensive editable, MS Excel spreadsheet for tracking logistic company…
Aesthetics & Dermatology Clinic – 5 Year Financial Model
Financial Model providing an advanced 5-year financial plan for a…
Construction Machinery Rental Company Financial Model
Discover the key to financial planning in the construction machinery…
Carbon Capture and Sequestration Project Analysis
The Carbon Capture and Sequestration (CCS) Project Analysis Template is…
Fruit Processing Facility – 10 Year Financial Model
Financial Model providing a dynamic up to 10-year financial forecast…
Subscription-Based B2C SaaS Financial Model Template
Optimize your Subscription-based B2C SaaS startup's financial planning with our…
Auto Parts Store – 5 Year Financial Model
This Financial Model Template provides an advanced 5-year financial plan…
Gym Financial Model and Budget Control
This Excel model is a highly adaptable and user-friendly tool…
Surfboard Rental Business Financial Model
Surfing is not just a sport—it's a lifestyle booming globally.…
How Are Financial Ratios Used In Decision-Making?

"In the short run, the market is a voting machine, but in the long run, it is a weighing machine." – Benjamin Graham, American Financial Analyst and Investor. The quote encapsulates the distinction between market sentiment and fundamental value in investing. In the short term, market hype and popularity, much like a "voting machine," can temporarily influence prices. In the long run, the market acts more like a "weighing machine," where objective financial data often determine a company's intrinsic value. It is where financial ratios come into play for long-term decision-making.
Financial ratios are crucial navigational tools for investors, guiding them through the complex world of financial analysis and decision-making. By unlocking the secrets behind these ratios, investors can better predict future performance, mitigate risks, and identify lucrative opportunities, making these ratios more than just numbers—they are the compass by which savvy investors chart their course in the ever-shifting seas of the financial markets. Discover why financial ratios are important, what are the most important financial ratios for investors, and how they affect decision-making.
What are Financial Ratios in Business?
Financial ratios in business are quantitative measures derived from a company's financial statements, like the balance sheet, income statement, and cash flow statement. These ratios evaluate various aspects of a business's performance and financial health. They provide insights into profitability, liquidity, efficiency, and solvency.
- Evaluate Performance: Financial ratios help stakeholders — like investors, creditors, and management — understand how well a company performs in key areas. For example, profitability financial ratios (like return on assets or net profit margin) indicate how efficiently a company generates profit relative to its assets or sales.
- Identify Potential Problems: By regularly monitoring financial ratios, a business can identify potential problems before they become critical. For instance, a sudden change in liquidity financial ratios (like the current or quick ratio) can signal cash flow issues.
- Numerical Values from Financial Statements: Financial ratios are calculated using numerical values extracted from financial statements. Each ratio requires specific pieces of financial data. For example, liquidity ratios use current assets and current liabilities from the balance sheet.
Overall, financial ratios provide a standardized way to analyze and compare different companies within the same industry or track a single company's performance over time. Furthermore, we will discuss why financial ratios are important.

The Most Important Financial Ratios for Investors
The most important financial ratios for investors are potent tools that distill complex financial data into simple, insightful metrics. These ratios are your gateway to understanding a company's efficiency, leverage, liquidity, profitability, and growth potential, making financial analysis both accessible and engaging. The most important financial ratios for investors facilitate comparative analysis across companies and industries, aiding investors in making informed decisions regarding investment opportunities.

Efficiency Financial Ratios
Efficiency financial ratios, or activity ratios, are financial metrics used to evaluate how effectively a company utilizes its assets and liabilities to generate sales and maximize profits. As a category of the most important financial ratios for investors, these financial ratio examples are beneficial in analyzing a company's operational performance. Here are some of the vital efficiency financial ratios:
- Asset Turnover Ratio: This ratio evaluates how effectively a company uses its assets to generate sales, calculated by dividing net sales by total assets. A higher ratio indicates more efficient use of assets.
- Inventory Turnover Ratio: This measures how quickly a company sells its inventory, calculated by dividing the cost of goods sold by the average inventory. A higher ratio indicates better performance, suggesting the company sells its inventory quickly and efficiently.
- Payables Turnover Ratio: This measures how quickly a company pays its suppliers, calculated by dividing the total purchases by average accounts payable. A higher ratio can indicate either efficient payment processes or a company taking advantage of credit terms offered by suppliers.
- Receivables Turnover Ratio: This ratio assesses how efficiently a company collects on its receivables, calculated by dividing the net credit sales by the average accounts receivable. A higher receivables turnover ratio indicates that the company is more effective in collecting its receivables.
- Days Inventory Outstanding (DIO): This indicates the average number of days a company holds its inventory before selling it. A lower DIO suggests the company is more efficient in managing and selling its inventory.
- Days Payable Outstanding (DPO): This ratio measures the average number of days a company takes to pay its bills and invoices. Companies with a higher DPO can retain their cash longer, which could benefit cash flow management.
- Days Sales Outstanding (DSO): This measures the average number of days it takes for a company to collect payments after a sale has been made. A lower DSO means the company takes less time to collect its receivables.

Leverage Financial Ratios
Leverage financial ratios are financial ratio examples used to assess a company's use of debt relative to its financial resources, such as equity or assets. This category of the most important financial ratios for investors provides insights into a company's financial structure, risk profile, and ability to meet debt obligations.
- Asset-to-Equity Ratio: This ratio compares a company's total assets to its shareholder equity, calculated by dividing total assets by total equity. A higher ratio indicates that a company is financing a larger portion of its assets through debt rather than equity. It can signal higher financial leverage and potential risk and indicate a company's ability to effectively use borrowed funds for growth. A lower ratio suggests a more conservative approach with less reliance on debt.
- Debt-to-Assets Ratio: This ratio measures the proportion of a company's debt-financed assets. It is calculated by dividing total debt by total assets. A higher ratio means a greater proportion of the company's assets are funded by debt, implying higher leverage and potential financial risk. This ratio is essential for creditors and investors to assess the likelihood of default or financial distress.
- Debt-to-Capital Ratio: This ratio provides insight into a company's financial structure by comparing its total debt to its total capital (the sum of debt and equity). Calculated by dividing total debt by total capital, this ratio helps understand how much of the company's operations are financed through debt versus equity. A higher ratio indicates a heavier reliance on debt, potentially increasing the risk of financial distress, while a lower ratio suggests a more conservative capital structure.
- Debt-to-EBITDA Ratio: This ratio compares a company's total debt to its earnings before interest, taxes, depreciation, and amortization (EBITDA). It measures a company's ability to pay off its incurred debts and is calculated by dividing total debt by EBITDA. A lower ratio is typically favorable, indicating that the company can more easily cover its debt obligations from its operating earnings. A higher ratio may suggest a company struggling to manage or repay its debt.
- Debt-to-Equity Ratio: This ratio compares a company's total debt to its shareholder equity. It's calculated by dividing total debt by total shareholder equity. This ratio is a key indicator of the balance between the money owed to creditors and the funds invested by shareholders. A higher ratio suggests that a company might be aggressively financing its growth with debt, which can increase the risk of financial distress. Conversely, a lower ratio indicates a more balanced approach between debt and equity financing.

Liquidity Financial Ratios
Liquidity ratios are financial metrics used to assess a company's ability to meet its short-term obligations using its most liquid assets. These financial ratio examples provide insight into the firm's financial health by evaluating its ability to quickly convert assets into cash without a significant loss in value.
- Cash Ratio: The Cash Ratio is a stringent measure of a company's liquidity, focusing solely on its most liquid assets. It is calculated by dividing the company's cash and cash equivalents (like marketable securities) by its current liabilities. This ratio tells us how well a company can pay off its short-term debts using only its cash reserves, without relying on the sale of inventory or the collection of receivables. A higher cash ratio indicates a stronger liquidity position, suggesting the company can pay its obligations even without incoming revenues. However, a very high cash ratio implies that the company is not using its excess cash effectively for growth or investment opportunities.
- Current Ratio: The Current Ratio is a broader measure of liquidity, calculated by dividing a company's current assets (cash, cash equivalents, inventory, receivables) by its current liabilities. This ratio indicates the firm's ability to cover its short-term obligations with its short-term assets. It reflects the company's capacity to pay off its debts with cash and the assets it can quickly turn into money. A higher current ratio indicates better short-term financial health. However, it's important to note that a very high ratio could also indicate excess inventory or inefficient use of working capital.
- Quick Ratio: The Quick Ratio, also known as the acid-test ratio, is a more conservative measure of liquidity than the current ratio. It is calculated by subtracting inventory from current assets and dividing this figure by current liabilities. The rationale is that inventory is generally the least liquid of a company's current assets. The quick ratio thus focuses on the assets that can be most rapidly converted into cash to meet short-term liabilities. This ratio provides a clearer view of a company's ability to pay its short-term obligations without relying on the sale of inventory, which might not be as readily convertible into cash. A higher quick ratio indicates a more favorable liquidity position.

Profitability Financial Ratios
Profitability financial ratios are quantitative measures to assess a company's ability to generate profit from its revenue, assets, or shareholders' equity. These financial ratio examples can be categorized into margin and return ratios.
- Margin ratios, a category of profitability measures, quantify a company's ability to convert sales into profits at various stages of its operations. These ratios, including gross margin, operating margin, and net profit margin, reflect the percentage of revenue after accounting for certain costs and expenses.
- Return ratios are financial metrics used to assess the efficiency of a company in generating profits from its investments, assets, or equity. Key examples include Return on Investment (ROI), Return on Assets (ROA), and Return on Equity (ROE), each measuring profitability relative to different types of capital invested in the business.

Growth Financial Ratios
Growth financial ratios assess the rate at which a company expands its business activities, highlighting revenue, profit, and market share trends over time. These financial ratio examples are crucial for investors and analysts to understand a company's growth prospects, enabling comparisons with industry peers and evaluating the company's potential for future profitability and market dominance.
- Revenue growth measures a company's sales increase over a specific period. It's a vital indicator of the company's ability to expand its business operations and attract more customers. A positive revenue growth rate indicates that the company is successfully increasing its market share and sales volume, which can result from new product launches, market expansion, or effective marketing strategies. Conversely, stagnant or declining revenue growth may signal challenges in the competitive landscape, operational issues, or a saturated market. Analysts and investors closely monitor this ratio to gauge a company's performance and potential for future growth.
- EBITDA growth measures the change in a company's earnings with certain costs and expenses excluded. This metric provides insight into a company's operational profitability and efficiency, excluding the effects of financing and accounting decisions. A positive EBITDA growth indicates improved operating performance and financial health, suggesting that the company generates more profit from its core operations. It's beneficial for comparing companies within the same industry, as it removes the effects of different capital structures and tax rates.
- Net income growth measures a company's profit increase over a period after all expenses, taxes, and costs have been subtracted from total revenue. This growth ratio is crucial for assessing a company's profitability and ability to enhance shareholder value through earnings. Positive net income growth indicates that a company is improving efficiency, managing costs effectively, and potentially increasing its market share. It reflects the bottom-line success of a company's operational, financial, and strategic initiatives.
- Asset growth tracks the increase in a company's total assets over time, including cash, investments, property, and equipment. This ratio can indicate the company's strategy for growth, whether through acquisition, investment in capital expenditures, or expansion into new markets. A growing asset base can signal a healthy, expanding company with the potential for increased revenue and profitability in the future. However, it's essential to consider the quality and productivity of the assets, as not all asset growth directly contributes to revenue or profit increases.
- Equity growth measures the change in shareholders' equity, which represents the residual interest in a company's assets after deducting liabilities. It can result from retained earnings, which accumulate when a company reinvests its net income instead of distributing it as dividends or issuing new shares. Positive equity growth suggests that a company is enhancing its value to shareholders by increasing its profitability or effectively managing its financial structure. It's a key indicator of economic health and long-term sustainability, reflecting the company's ability to generate value through its operations and strategic decisions.

Why Financial Ratios are Important?
Financial ratios are crucial in business as they provide a standardized way to analyze and interpret financial statements, making understanding a company's financial health easier. Financial ratio examples break down complex financial data into comparable figures, allowing for a quick assessment of a company's performance.
Assess the Company's Financial Health: Financial ratios are essential for assessing a company's financial health. Ratios like liquidity ratios (e.g., current ratio, quick ratio) evaluate a company's ability to pay short-term obligations, while solvency ratios (e.g., debt to equity ratio) assess long-term financial stability. Profitability ratios (e.g., net profit margin, return on equity) indicate how effectively a company generates profit relative to its sales, assets, or equity. These ratios provide a comprehensive picture of financial health, helping stakeholders understand if a company is financially sound, at risk, or needing strategic changes.
Guide Financial Planning: Financial ratios are invaluable in guiding a company's financial planning. They help set realistic financial goals and create effective strategies to achieve them. For instance, return on investment (ROI) ratios can guide investment decisions, while efficiency ratios (e.g., inventory turnover, asset turnover) can inform operational improvements. Ratios also assist in forecasting future performance and planning for contingencies by providing insights into trends and potential risk areas. This guidance is crucial for sustainable growth and maintaining financial stability.
Identify Areas to Improve: Financial ratios help pinpoint areas where a company can improve. For instance, a low profitability ratio might suggest a need to increase sales, reduce costs, or both. High leverage ratios may indicate an over-reliance on debt, signaling capital structure adjustment needs. Analyzing these ratios over time can highlight trends, revealing whether business strategies are effective or need refinement. This targeted approach to identifying improvement areas ensures that management efforts are focused and efficient.
Monitor a Company's Performance: Regular monitoring of financial ratios is critical to understanding a company's ongoing performance. These ratios provide real-time insights into various aspects of the business, such as operational efficiency, financial stability, and profitability. By consistently tracking these ratios, management can quickly identify and respond to emerging issues, capitalize on positive trends, and make informed decisions. This ongoing monitoring is essential for maintaining control over the company's financial trajectory and ensuring long-term success.
Standard Method of Comparison: Financial ratios provide a standard method for comparing a company's performance across time and against its peers or industry benchmarks. Since financial statements vary significantly in size and complexity, ratios level the playing field by offering a standard, comparable metric. This comparability is crucial for investors and analysts who must evaluate multiple companies regardless of size or sector. It also allows businesses to benchmark themselves against industry standards, gaining insights into their relative position in the market.
So, here's a general answer to why financial ratios are important. Financial ratios provide valuable insights into a company's financial health and operational efficiency. By quantifying and comparing various aspects of a company's performance, they enable investors, analysts, and managers to make informed decisions and assess potential risks and opportunities.

Understanding Financial Ratios Through Financial Modeling
Financial ratios are integral to decision-making, providing a distilled view of a company's financial health and operational efficiency. These ratios, derived from financial statements, enable stakeholders to make informed decisions by quantifying various aspects of a business's performance. By translating complex financial data into understandable metrics, financial ratios are foundational in strategic planning, investment analysis, and credit assessments.
Understanding financial ratios through financial modeling elevates their utility in strategic decision-making. Financial models simulate a company's financial performance under various scenarios, integrating historical data with assumptions about the future. These models enable analysts to explore the impact of different variables on financial ratios, providing a dynamic and predictive dimension to financial analysis. By integrating financial ratios into comprehensive models, decision-makers gain a more nuanced, forward-looking perspective, enhancing their ability to anticipate future challenges and capitalize on potential opportunities.


