
0 ITEMS

AI Data Center Power Procurement & Behind-the-Meter Generation Model | 20-Year Forecast, PPA, BESS, Gas, Nuclear, Hybrid Mix, NPV/IRR
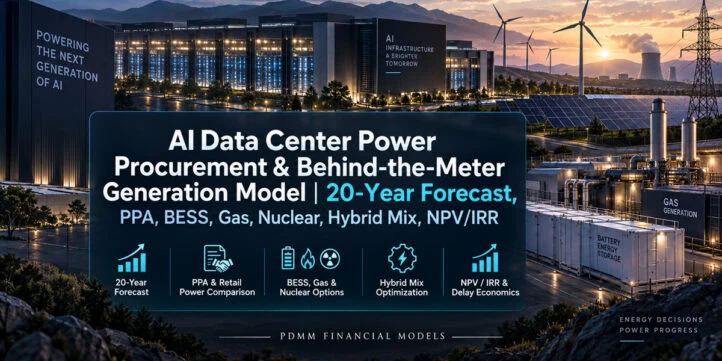
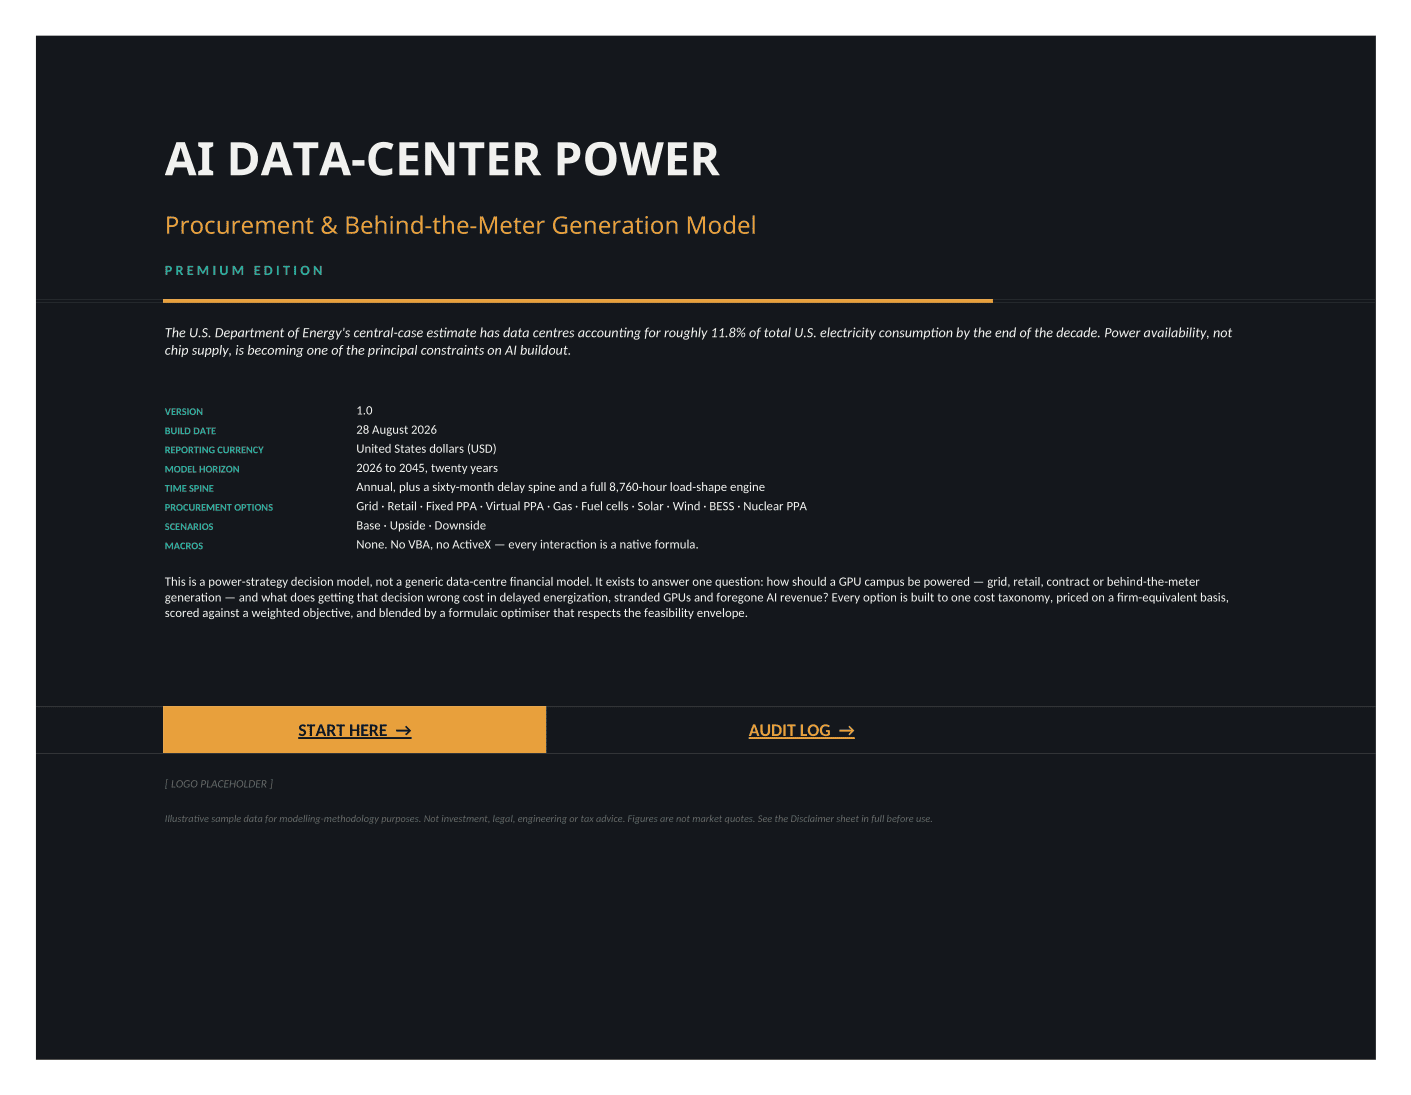
AI Data Center Power Procurement & Behind-the-Meter Generation Model ⚡ Choose a power strategy for an AI / GPU campus on a like-for-like, firm-equivalent basis. This 43-worksheet Excel model is built for the question that can dominate a data-center development plan: should the campus rely on the utility grid, retail electricity, a fixed or virtual PPA, on-site gas generation, fuel cells, solar, wind, BESS, a nuclear PPA, or a constrained hybrid portfolio? The model links the power decision to cost, reliability, time to energization, stranded GPU capital, foregone AI revenue, carbon intensity, and investment economics across a 2026-2045 annual horizon.
AI Data Center Power Procurement & Behind-the-Meter Generation Model
⚡ Choose a power strategy for an AI / GPU campus on a like-for-like, firm-equivalent basis. This 43-worksheet Excel model is built for the question that can dominate a data-center development plan: should the campus rely on the utility grid, retail electricity, a fixed or virtual PPA, on-site gas generation, fuel cells, solar, wind, BESS, a nuclear PPA, or a constrained hybrid portfolio? The model links the power decision to cost, reliability, time to energization, stranded GPU capital, foregone AI revenue, carbon intensity, and investment economics across a 2026-2045 annual horizon.
🎯 Buyer problem and decisions supported
Power options that look cheap on a simple $/MWh basis can become expensive once firm capacity, backup, unserved energy, interconnection timing, demand charges, capital recovery, and delay economics are included. This workbook places all ten procurement routes on one common cost taxonomy and compares both levelised cost and firm-equivalent cost: the cost of actually serving a flat, around-the-clock campus load. It then ranks standalone choices and builds an optimal mix inside user-defined portfolio constraints.
Use it to decide how much power should come from each source, which option can energize the campus fastest, whether a low-cost route remains attractive after firming, what an energization delay costs, how much capital each route requires, how power cost translates to GPU-hour economics, and how a cleaner portfolio changes emissions and implied carbon cost.
🔎 Recommended use cases
- Build a long-range power procurement plan for an AI or GPU data-center campus.
- Forecast power cost, capital requirements, and operating economics across the 2026-2045 horizon.
- Compare profitability and unit economics through cost per MW, cost per MWh, cost per GPU-hour, and power cost as a share of AI revenue.
- Evaluate pricing choices across utility tariffs, retail supply, PPAs, fuel-based generation, renewables, storage, and nuclear contracting.
- Quantify cash-flow and investment economics using net present cost, NPV versus retail, IRR versus retail, payback, and capital needs.
- Run Base, Upside, and Downside scenarios from one workbook-wide scenario control.
- Perform sensitivity analysis on gas price, power price, capex, utilisation, demand / capacity charges, transmission, firming cost, fixed O&M, and energization delay.
- Test operational reliability and redundancy choices, including firm-capacity requirements, backup cost, availability, and avoided downtime.
- Assess energization timing and delay exposure through unpowered MW-months, lost AI revenue, stranded GPU-capital carry, and cost per month of delay.
- Optimize a hybrid power portfolio inside renewable minimums, combustion ceilings, and source-specific share constraints.
- Compare carbon and ESG outcomes using blended intensity, annual / lifetime emissions, grid counterfactuals, and implied carbon cost.
- Support site selection, PPA negotiation, investment committee, development, procurement, and strategy discussions with dashboard-ready outputs.
🧭 Model workflow
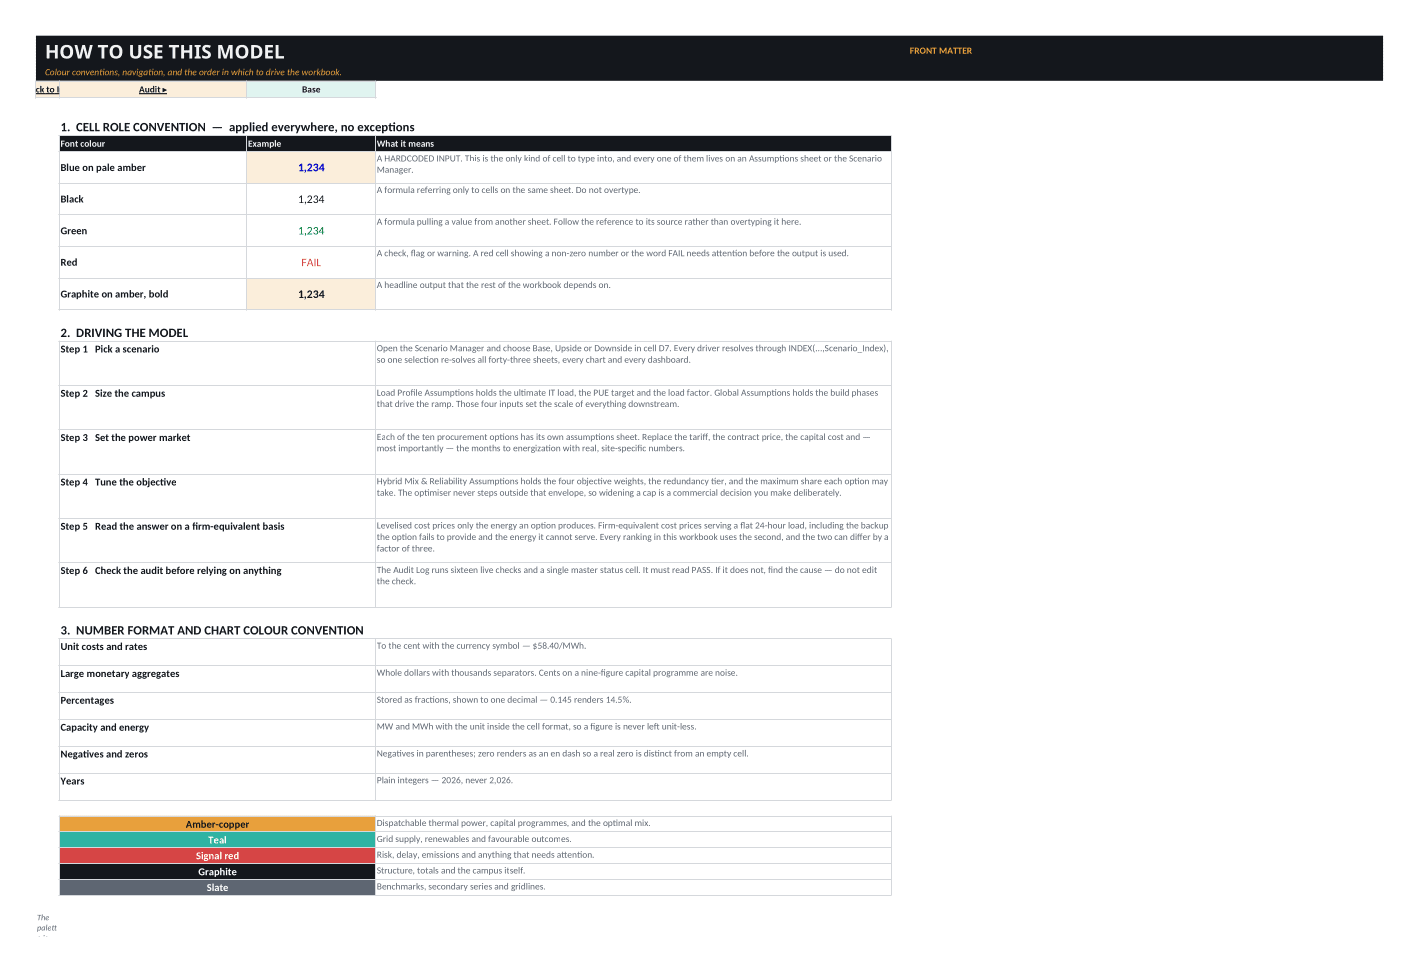
1. Select Base, Upside, or Downside in the Scenario Manager. One scenario control drives the workbook’s assumption grids, engines, option modules, outputs, charts, and dashboards.
2. Size the campus using ultimate IT load, PUE, load factor, build phases, GPU power, utilisation, compute revenue, and installed GPU capital.
3. Replace sample power-market and technology inputs on the dedicated assumptions sheets: grid, retail, fixed PPA, virtual PPA, gas generation, fuel cells, solar, wind, BESS, and nuclear PPA.
4. Set reliability requirements, optimisation weights, renewable minimums, combustion limits, firm-capacity margins, and maximum/minimum source shares.
5. Review each procurement option, then compare firm-equivalent economics, delay, capital, carbon, and portfolio score.
6. Read the optimal hybrid mix, sensitivity outputs, and executive dashboards.
🧮 Editable inputs and calculation depth
The editable assumption framework covers model years, commercial-operation timing, discount rate, inflation and escalation, tax, campus phases, IT load and PUE, GPU economics, hourly and monthly load-shape drivers, grid capacity and interconnection timing, retail tariffs, PPA pricing and delivery, gas price and heat rate, fuel-cell efficiency, renewable generation assumptions, battery duration / round-trip efficiency / degradation, nuclear PPA terms, redundancy tier, target availability, backup generation, objective weights, renewable and combustion constraints, and source-specific share caps.
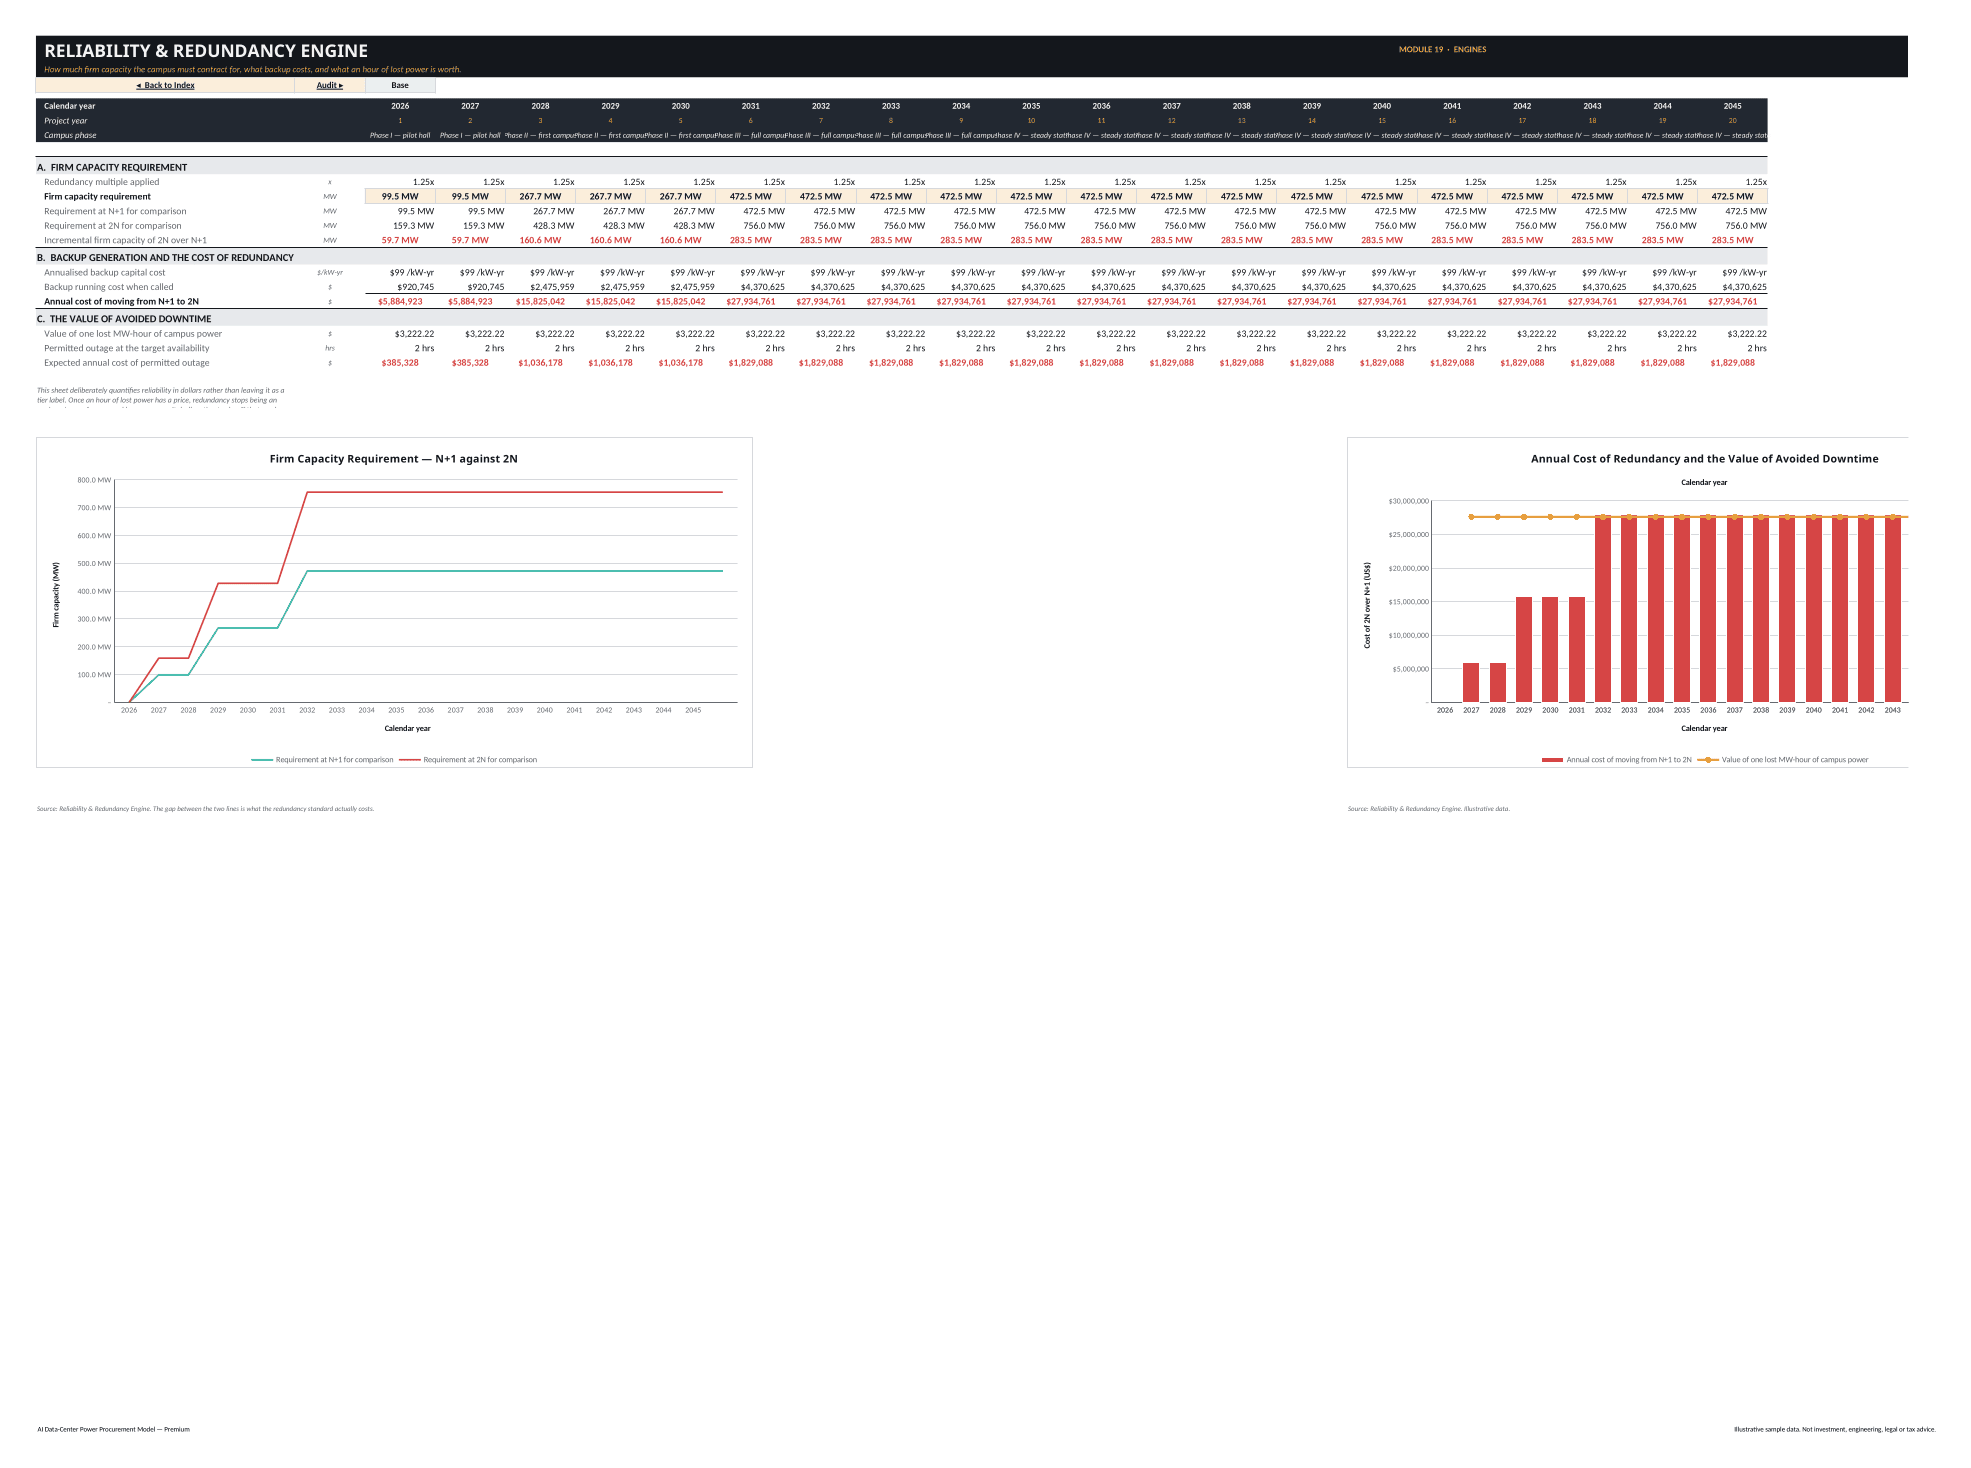
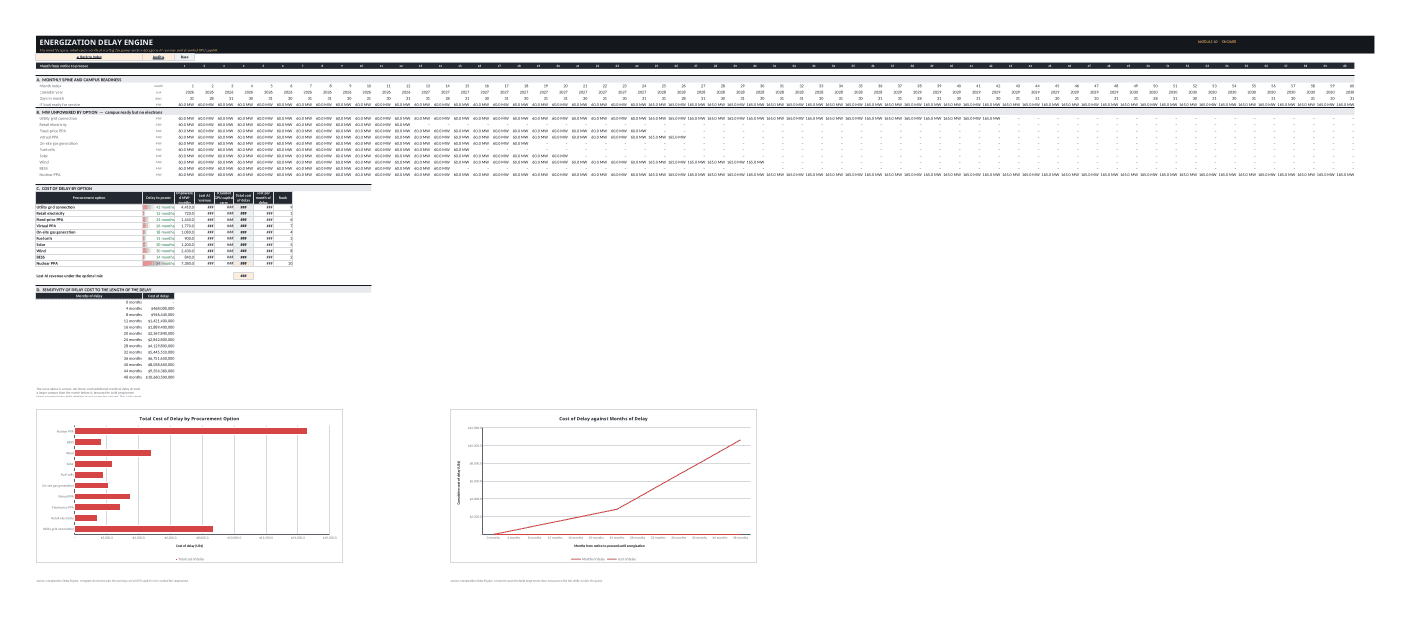
Behind those inputs are a twenty-year annual spine, a sixty-month energization-delay spine, a 288-block load-shape framework and a full 8,760-hour load engine. The Reliability Engine converts redundancy and outage assumptions into firm-capacity requirements, backup cost, and the value of avoided downtime. The Energization Delay Engine measures unpowered MW-months, lost AI revenue, stranded GPU-capital carry, total delay cost, cost per month, and option ranking.
🔌 Procurement and generation modules
The workbook includes separate operating/economic modules for Utility Grid Connection, Retail Electricity, Fixed-Price PPA, Virtual PPA, On-Site Gas Generation, Fuel Cells, Solar, Wind, BESS, and Nuclear PPA. Each route is built on a comparable cost structure so fuel or energy purchase, demand/capacity charges, transmission, fixed O&M, variable O&M, capital recovery, and other costs can be compared consistently. Dedicated assumption sheets sit upstream of each technology or contract module.
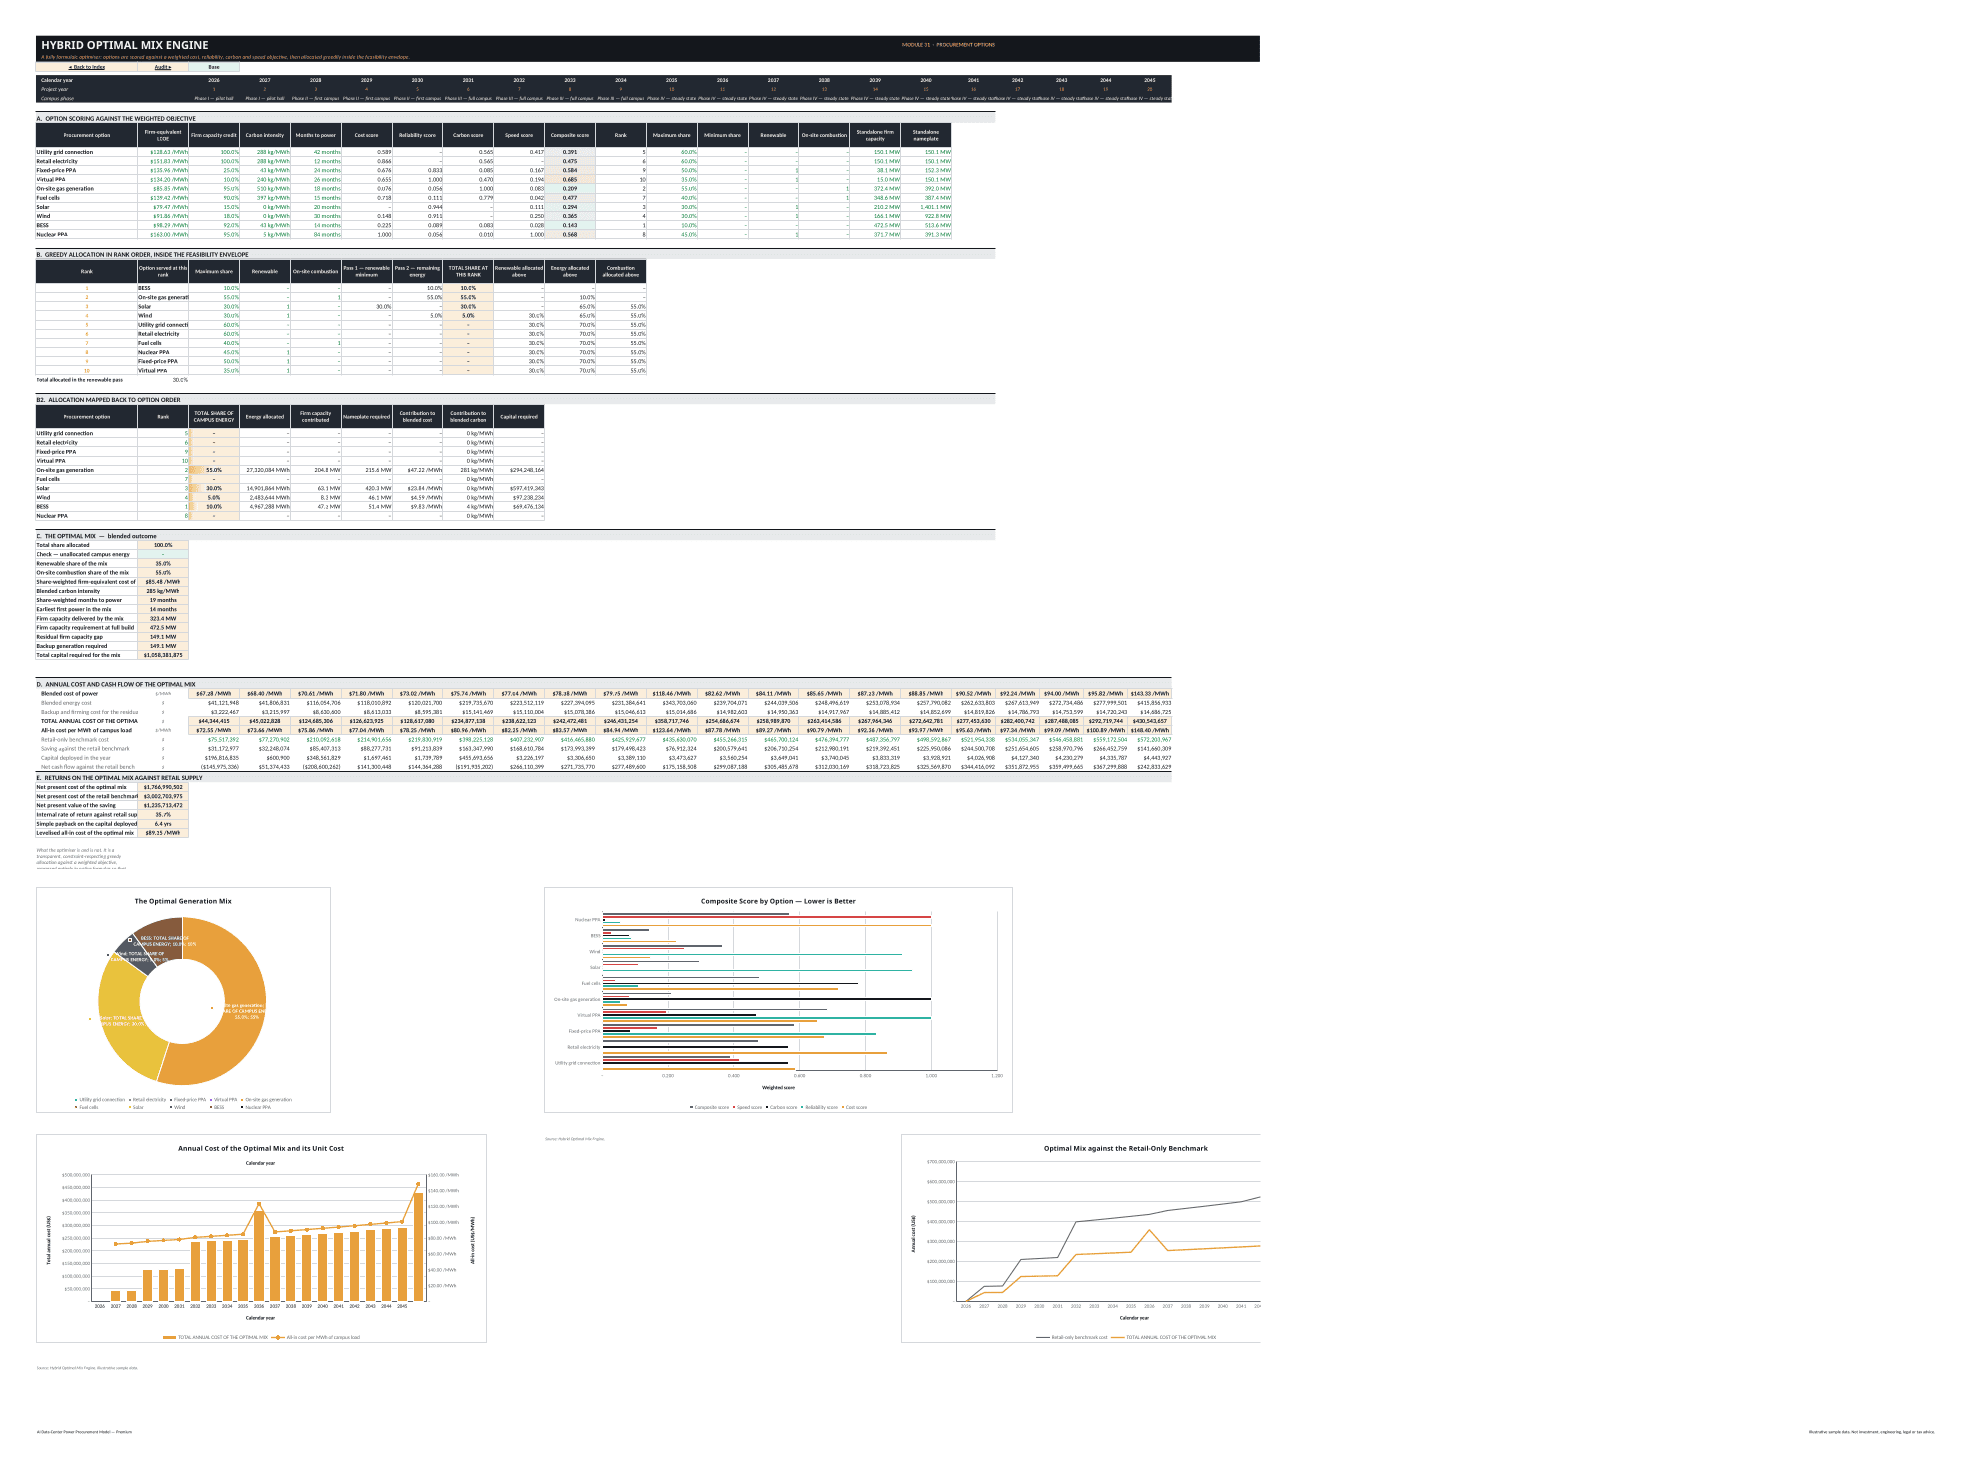
The Hybrid Optimal Mix Engine scores options using user-defined weights for cost, firm capacity / reliability, carbon, and time to power. It applies renewable minimums, combustion ceilings, and option share caps, then calculates the blended cost, capital requirement, firm capacity, carbon intensity, time to power, net present cost, IRR and levelised economics of the resulting portfolio.
💵 Financial, unit-economics and valuation outputs
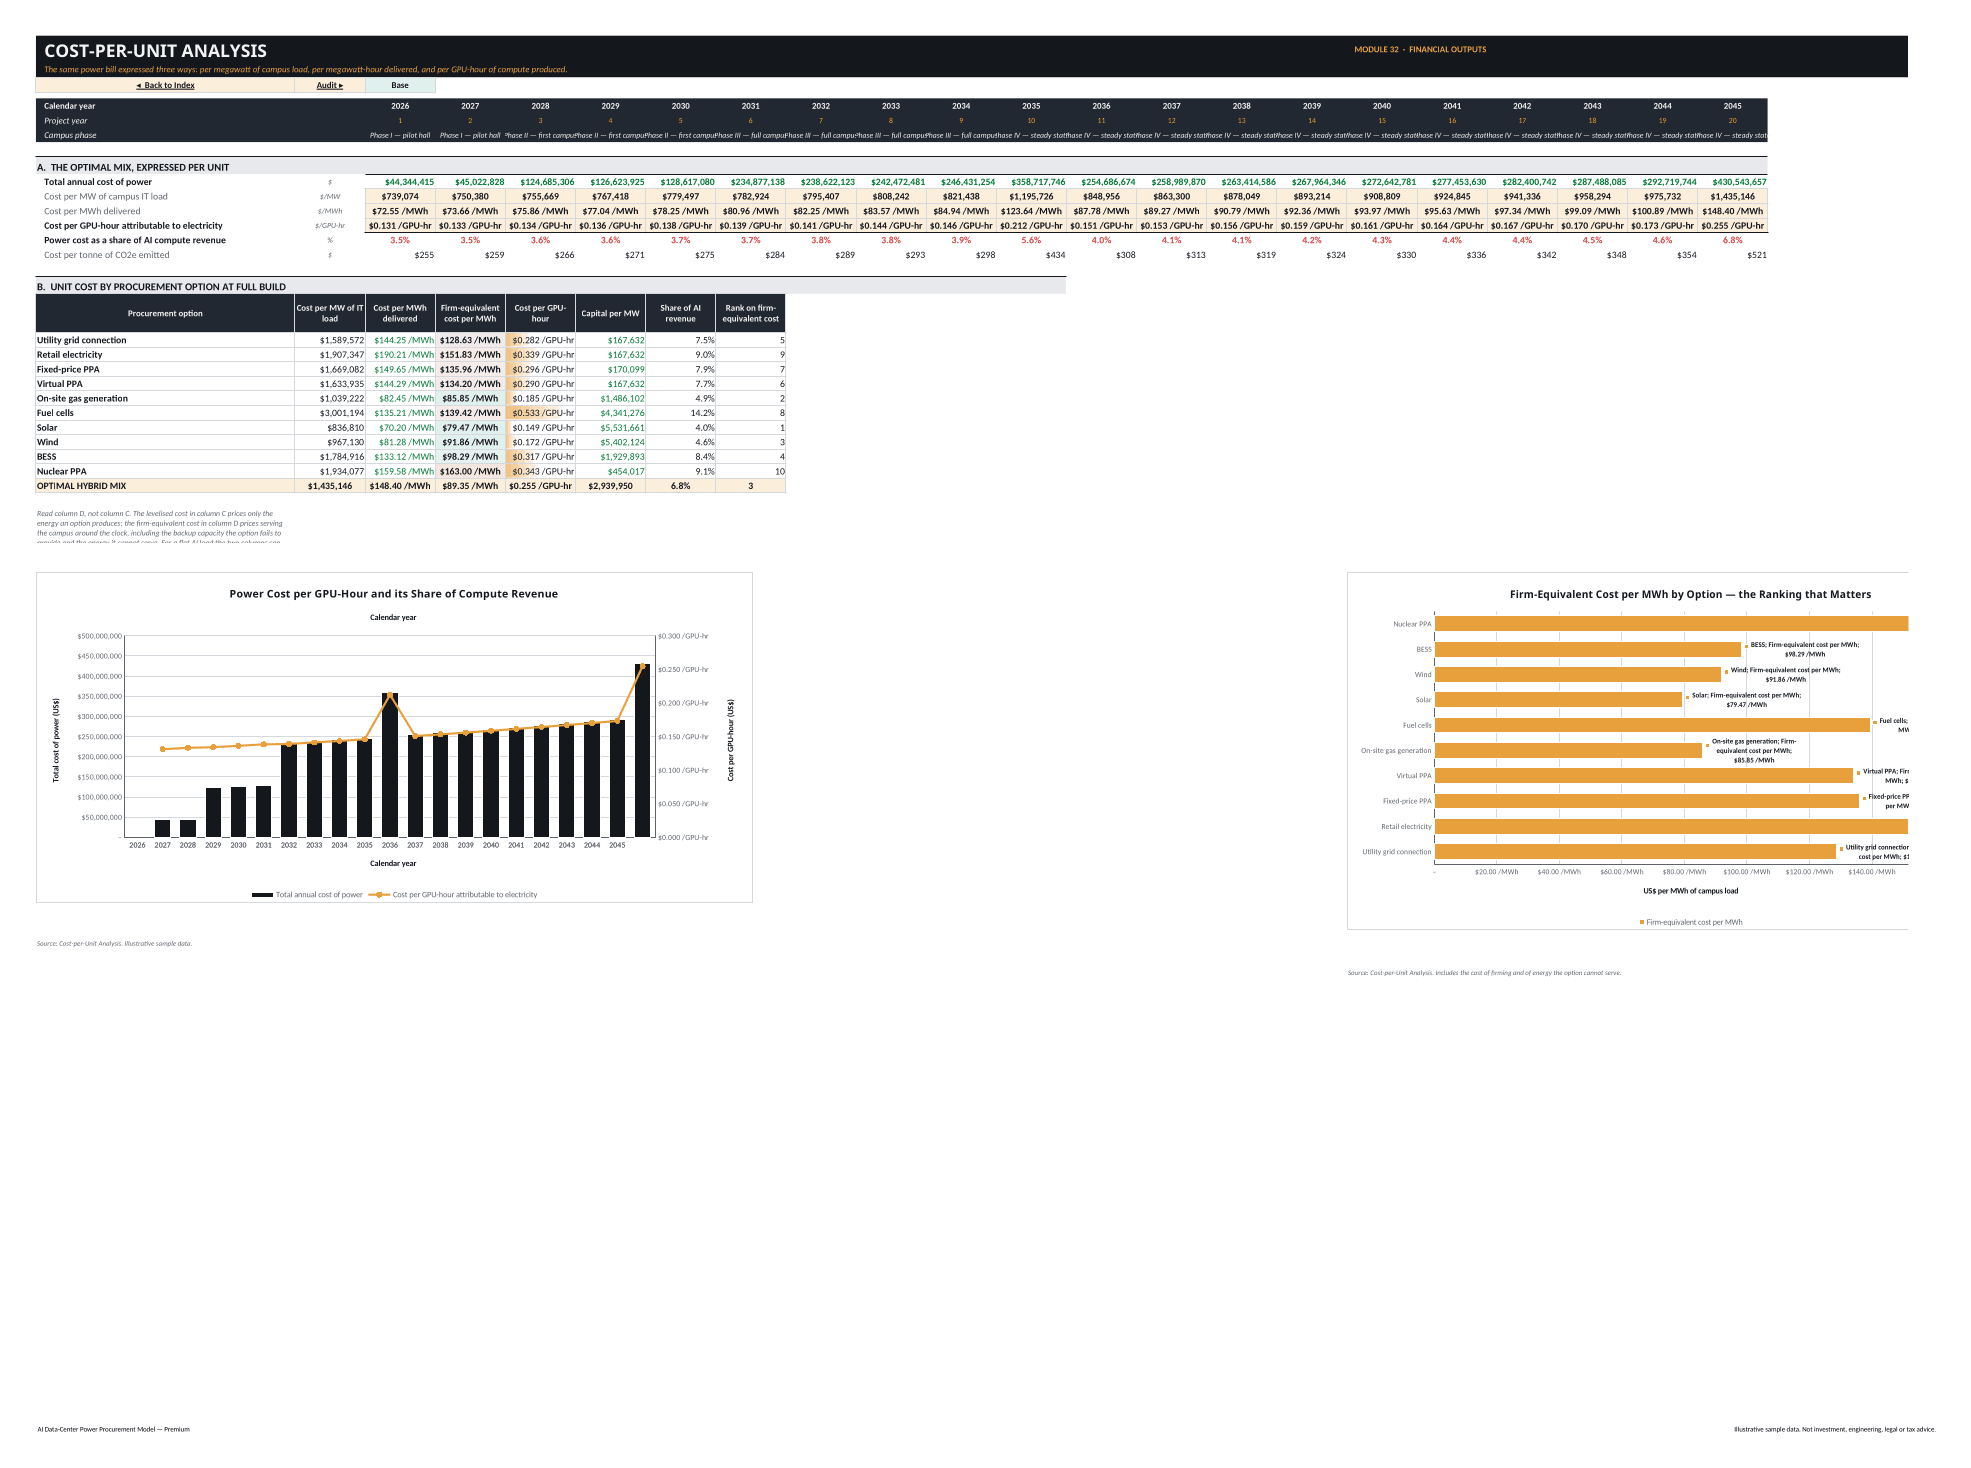
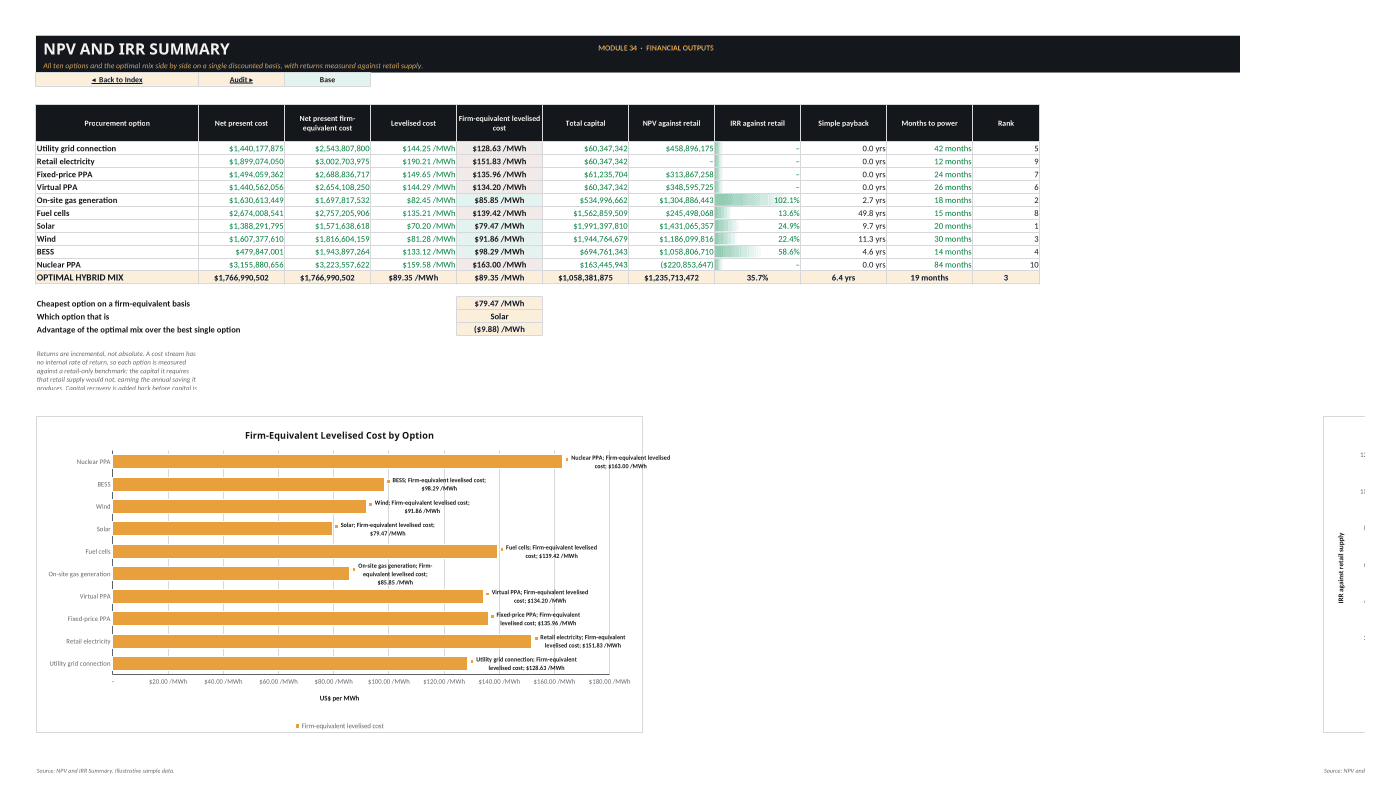
The Cost-per-Unit Analysis translates the power bill into cost per MW of campus IT load, cost per MWh delivered, firm-equivalent cost per MWh, cost per GPU-hour, capital per MW, and power cost as a share of AI compute revenue. The NPV and IRR Summary compares all ten standalone options and the optimal mix on net present cost, net present firm-equivalent cost, levelised cost, firm-equivalent levelised cost, total capital, NPV versus retail supply, IRR versus retail, simple payback, months to power, and ranking.
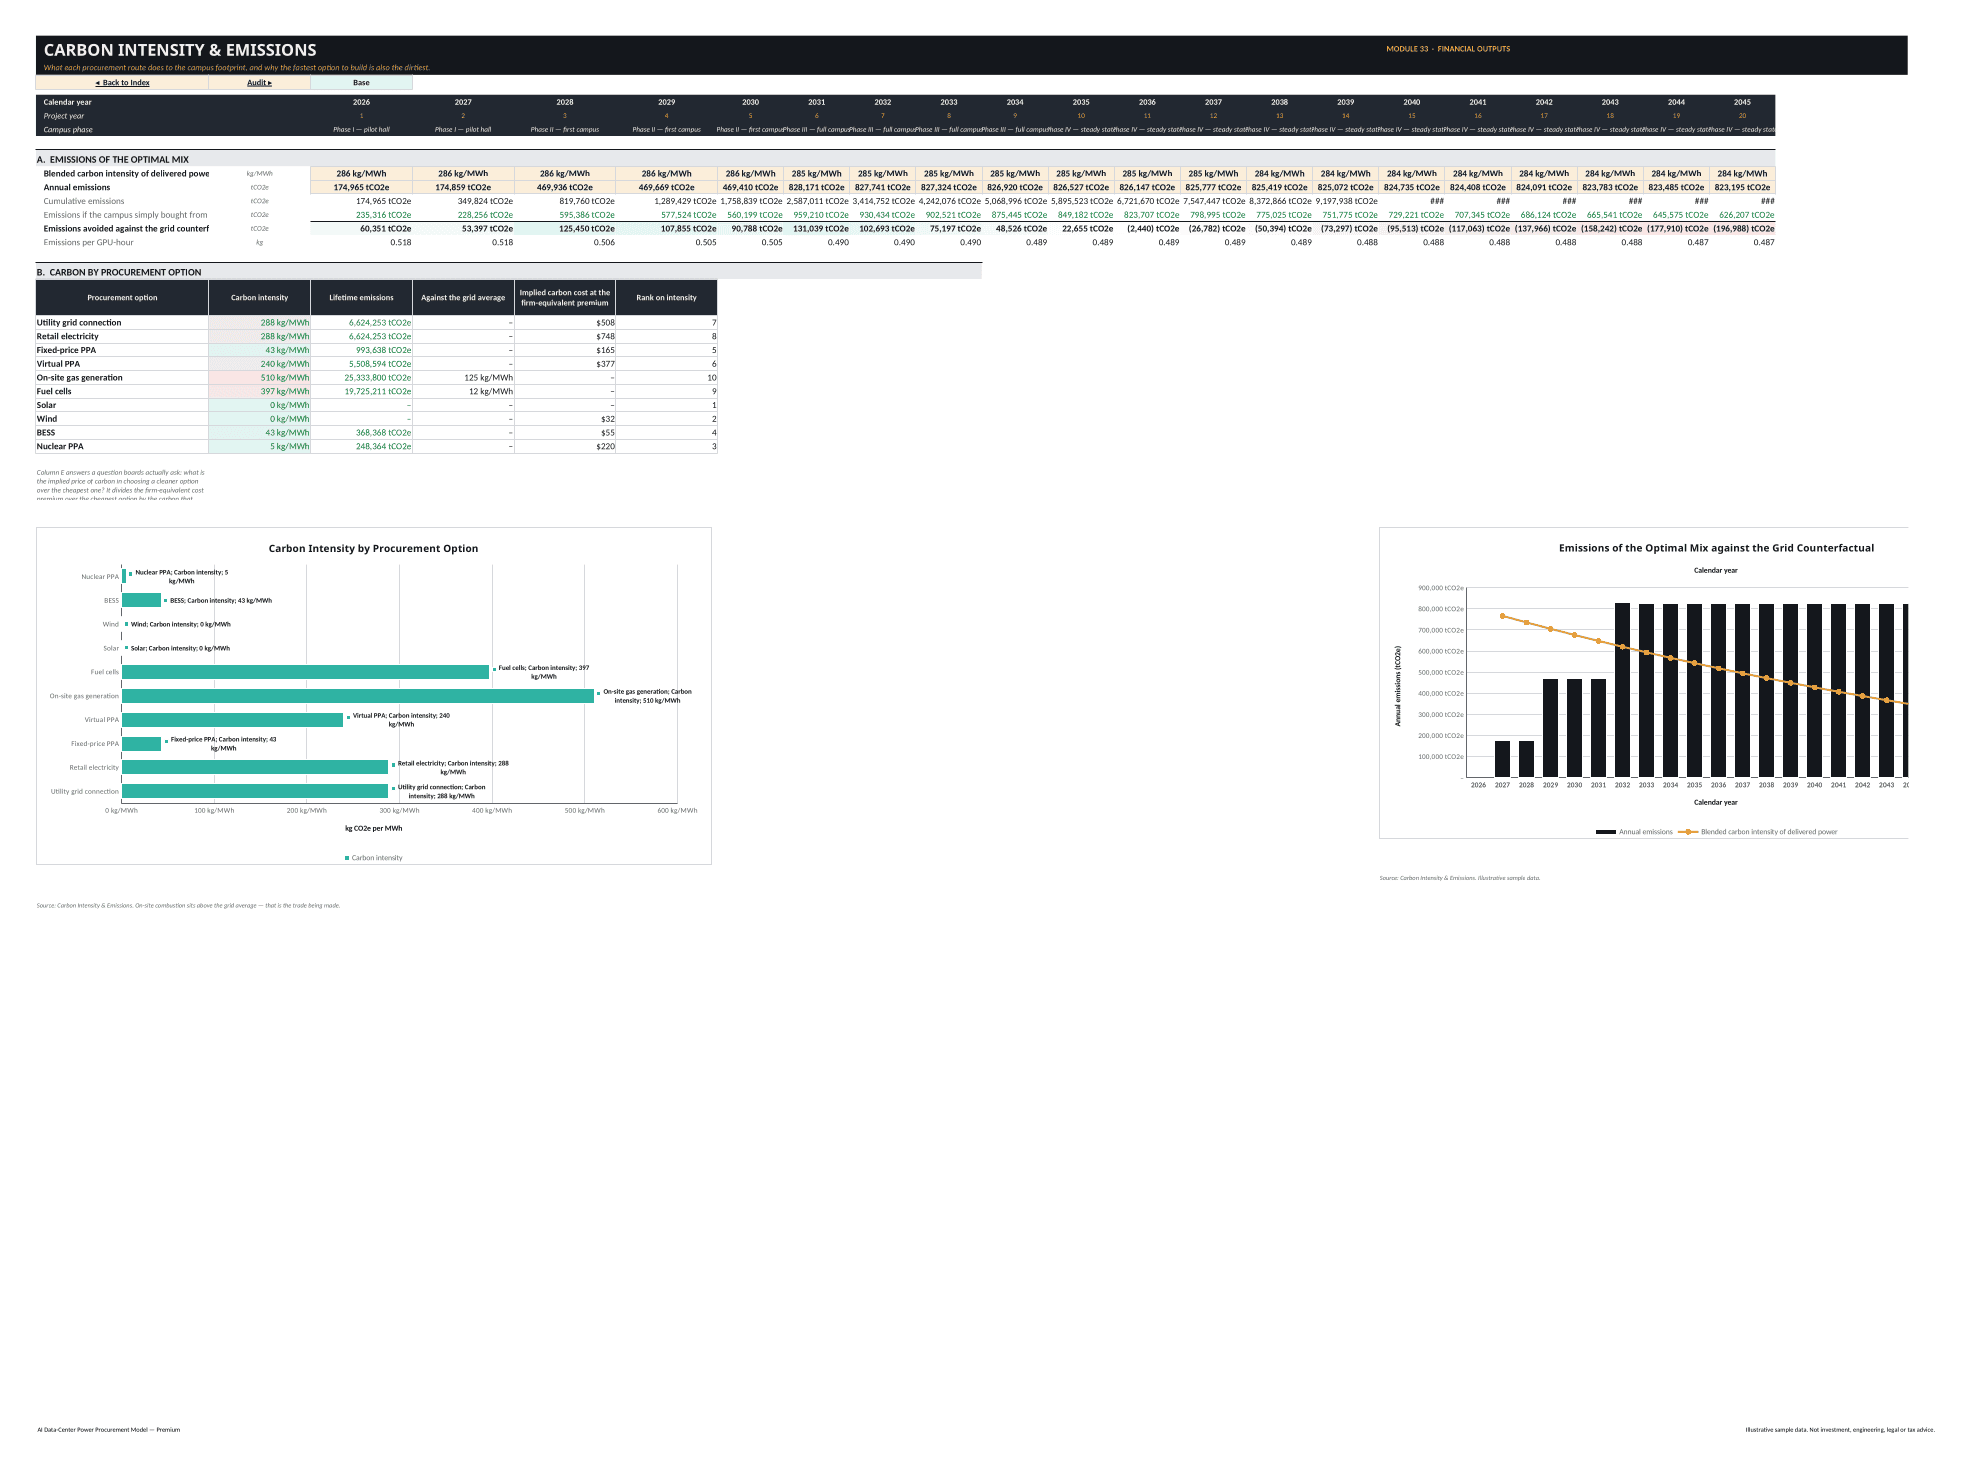
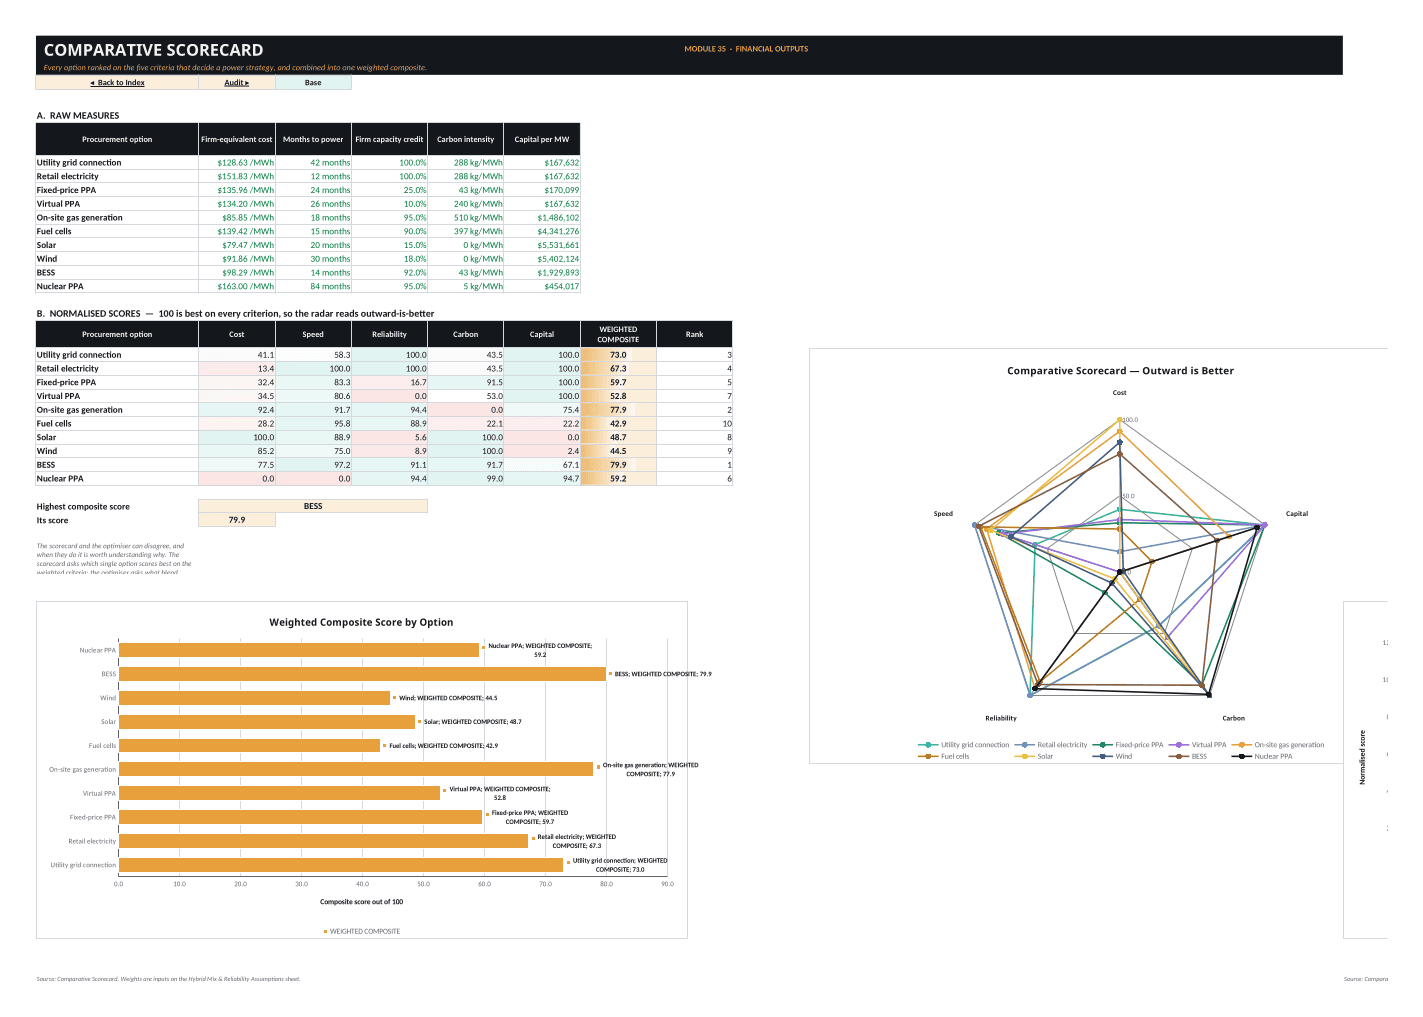
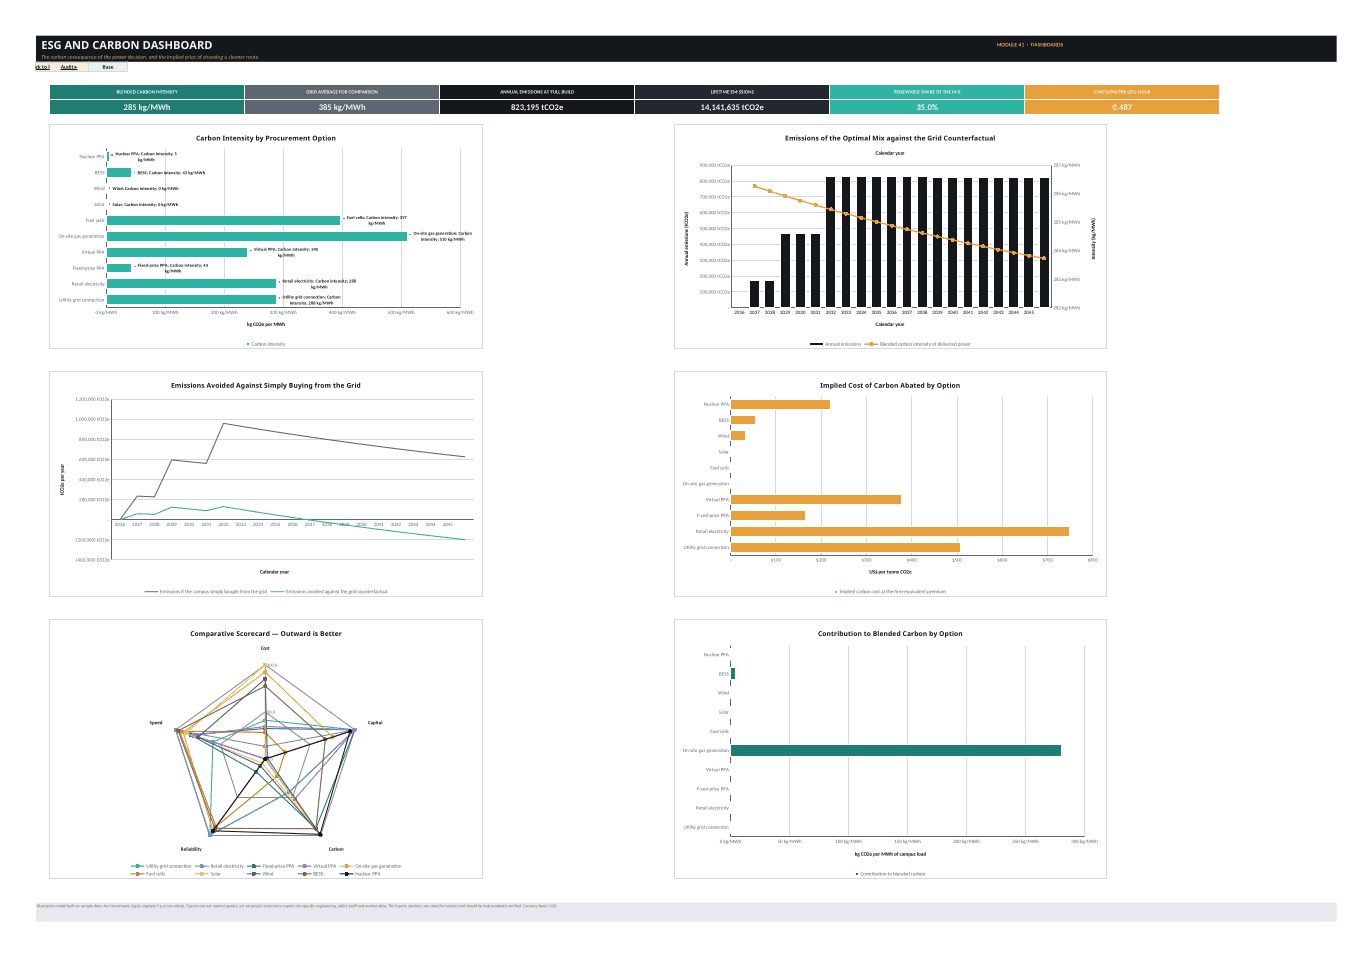
The Comparative Scorecard ranks choices across the model’s decision criteria and combines them into a weighted composite. The Carbon & Emissions module calculates blended carbon intensity, annual and cumulative emissions, grid-counterfactual emissions, emissions avoided, emissions per GPU-hour, lifetime emissions by option, and implied carbon cost where meaningful.
📊 Scenarios, sensitivities and dashboards
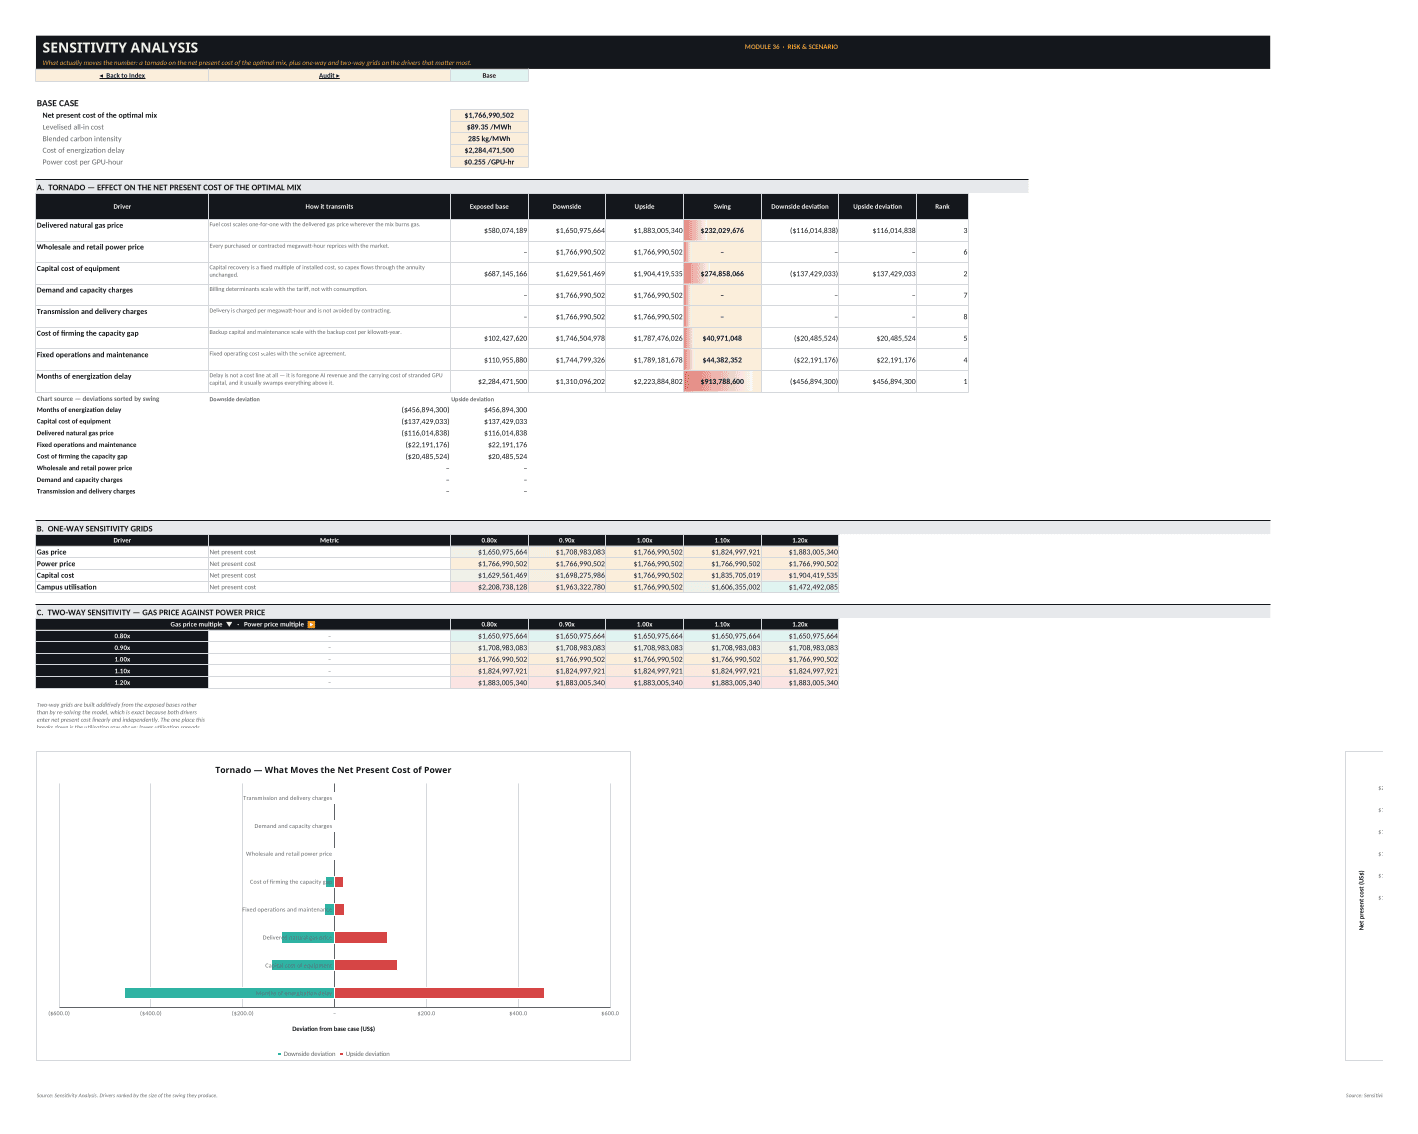
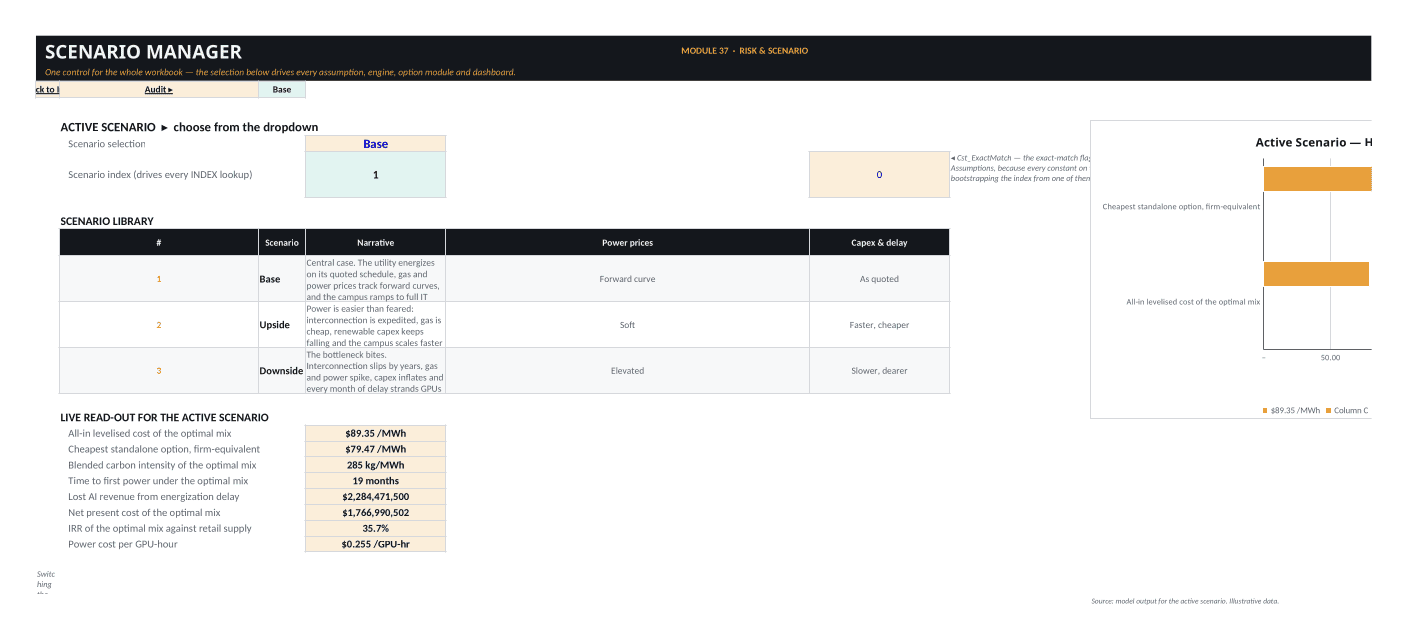
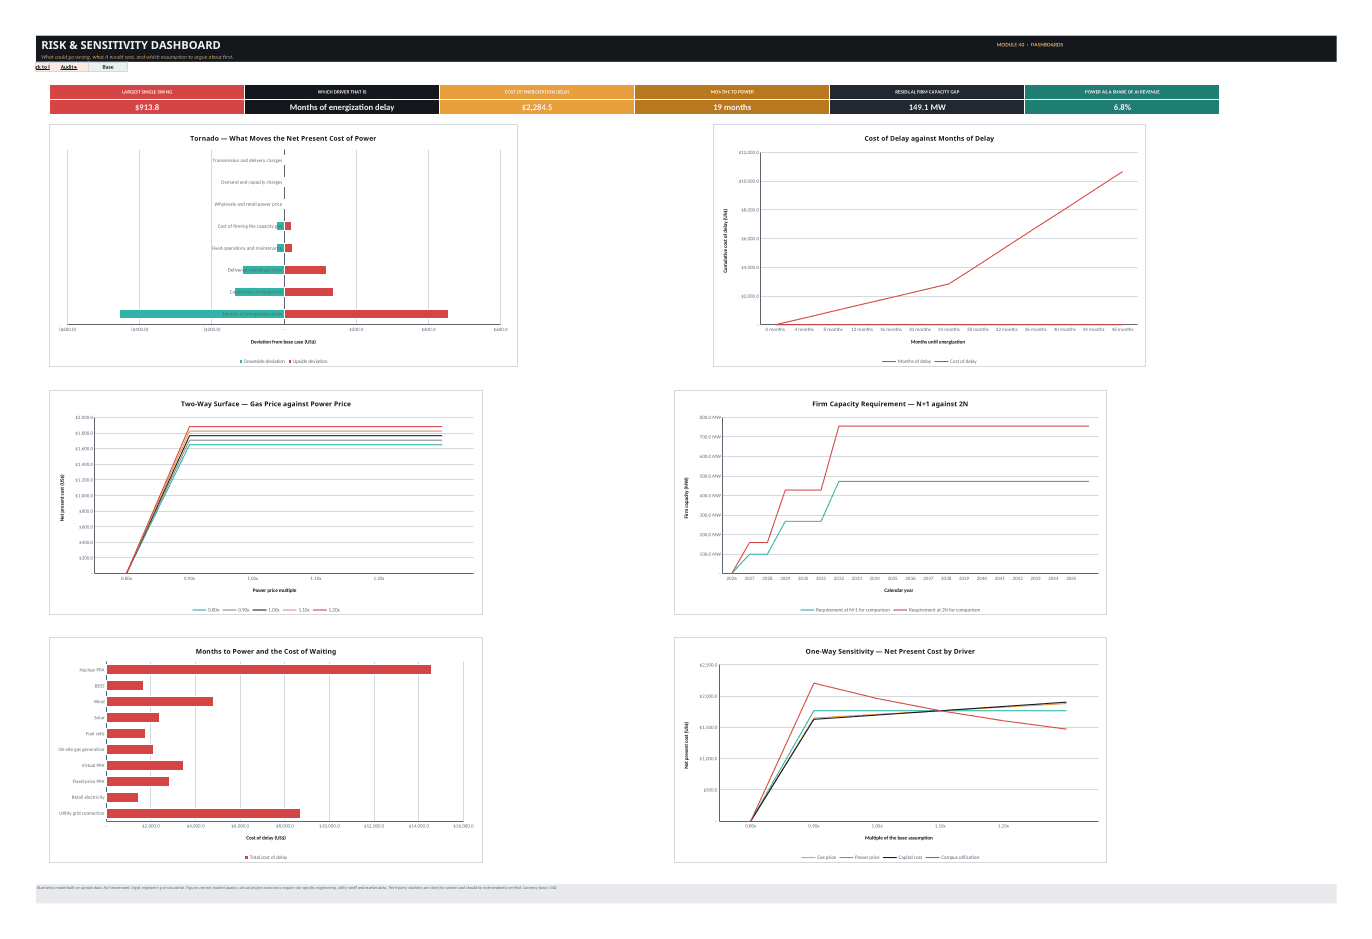
The Scenario Manager contains Base, Upside and Downside cases with a live read-out of headline economics. The Sensitivity Analysis includes a tornado on optimal-mix net present cost, one-way grids for gas price, power price, capital cost and campus utilisation, plus a two-way gas-price-versus-power-price table. Tornado drivers also include demand / capacity charges, transmission / delivery, firming cost, fixed O&M and months of energization delay.
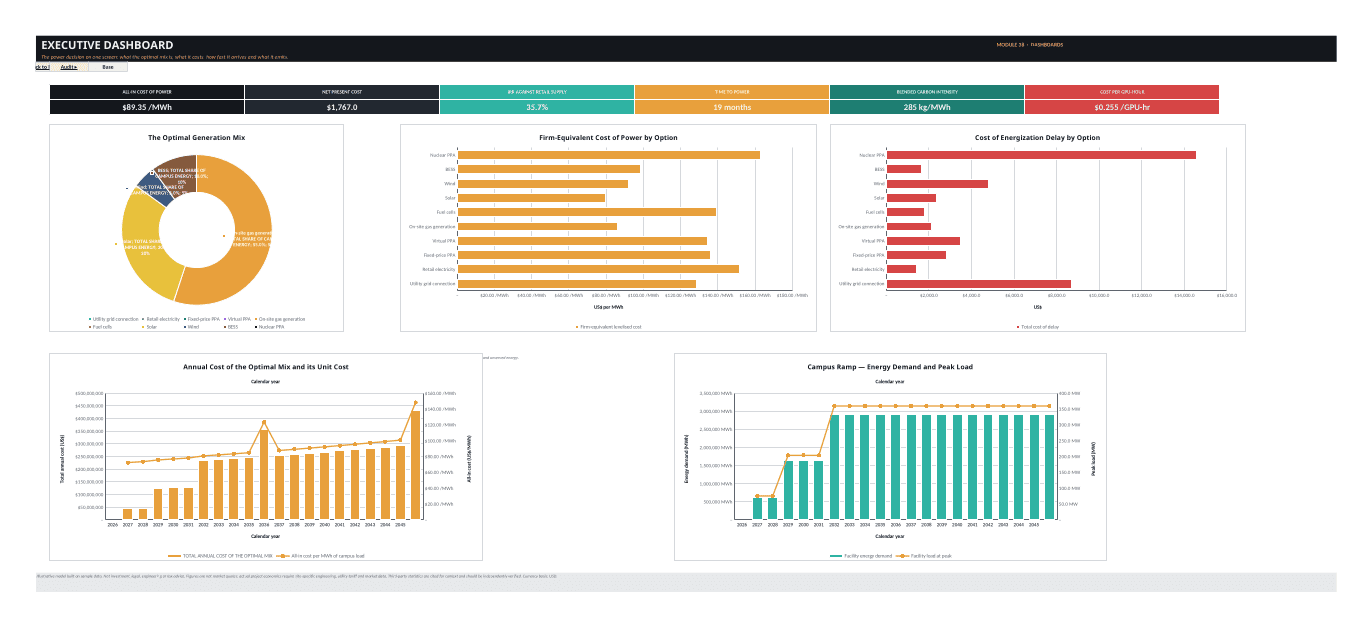
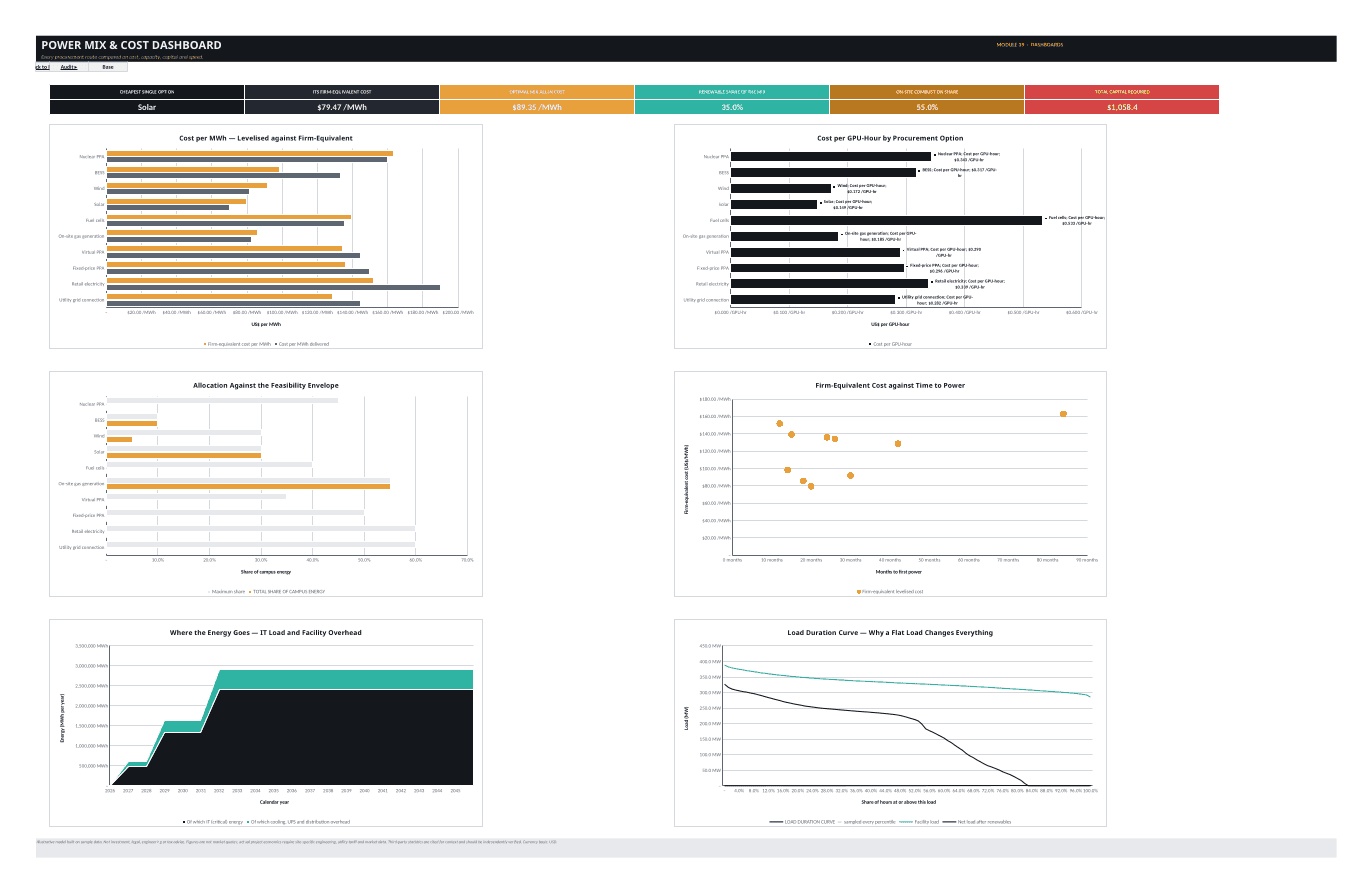
Four management dashboards turn the calculation sheets into decision views: Executive Dashboard, Power Mix & Cost Dashboard, Risk & Sensitivity Dashboard, and ESG and Carbon Dashboard. Headline KPIs include all-in power cost, net present cost, IRR against retail, time to power, blended carbon intensity, power cost per GPU-hour, renewable share, on-site combustion share, total capital, delay cost, residual firm-capacity gap, emissions and sensitivity swings.
🗂️ Worksheet architecture
The 43 worksheets are organized into front matter and navigation; Global, Load Profile, Grid, Retail, Fixed PPA, Virtual PPA, Gas, Fuel Cell, Solar, Wind, BESS, Nuclear PPA, and Hybrid / Reliability assumptions; Load & Energy Build, Reliability, and Energization Delay engines; ten option modules; Hybrid Optimal Mix; Cost-per-Unit; Carbon & Emissions; NPV and IRR Summary; Comparative Scorecard; Sensitivity Analysis; Scenario Manager; four dashboards; and workbook-native Audit Log and Version Control sheets.
🔎 Workbook checks and governance
The supplied workbook includes an Audit Log with sixteen live structural checks and a Version Control sheet. The checks cover areas such as calculation-spine error values, populated scenario inputs, structured chart / table sources, circularity / iterative-calculation structure, annual-shape and 8,760-hour reconciliation, objective-weight totals, optimal-mix allocation, source caps, renewable and combustion constraints, option cost-stack footing, the firm-equivalent cost identity, valid factor/share ranges, chart series labels, and navigation hyperlinks. These are workbook-native controls provided by the seller; they are not a Studio audit.
✅ Practical benefits and intended users
This model is suited to data-center developers, hyperscale / AI infrastructure teams, corporate-development and project-finance professionals, energy procurement teams, infrastructure investors, CFO / FP&A teams, consultants, and advisors who need one integrated view of power cost, reliability, schedule, capital and carbon. It is particularly useful before a utility commitment, PPA negotiation, behind-the-meter investment, site-power decision, investment committee review, or scenario workshop.
📦 Delivered files
The client-ready model is supplied as Excel .xlsx and contains no VBA or ActiveX macros. All core interactions are native Excel formulas and workbook controls.
Similar ProductsOther customers were also interested in...



 eFinancialModels
Electric Vehicle (EV) Charging Station Financial M...
With this comprehensive 5- or 10-year monthly tool, investors can assess the viability of setting up... Read more

Financial Model for Mobile App | Mobile App Busine...
The Mobile App Financial Plan Template in Excel allows you to develop financial projections when lau... Read more

 HenrySheykin
Food Truck Financial Model Excel Template
The Food Truck Financial Model helps entrepreneurs, founders, business owners, consultants, and anal... Read more

Green Hydrogen Production from Wind Energy Financi...
The Green Hydrogen from Wind Financial Model aims to comprehensively forecast a horizon of 40 years ... Read more

Simple Mutual Non-Disclosure Agreement Template
Protect your business secrets with ease using our Simple Mutual Non-Disclosure Agreement Template. S... Read more

Solar Energy Financial Model
The Solar Energy Financial Model Spreadsheet Template in Excel assists you in preparing a sophistica... Read more

 Peter Graf
The Customer-Centric Financial Model for Restauran...
Starting a restaurant without a financial plan is like driving a car blindfolded. You wouldn´t do i... Read more
You must log in to submit a review.