
0 ITEMS

The Essential Elements of an Income Statement
Table of Content
- What Is an Income Statement?
- Why Businesses Use the Income Statement?
- The Key Components of an Income Statement
- Model Financial Success Through Income Statement Analysis
Understanding your income statement is essential for evaluating your business’s financial performance and making informed decisions.
- It details revenue streams, including operating and non-operating income, and their impact on profit.
- Key components such as gross profit, operating expenses, EBITDA, and net income reveal profitability and operational efficiency.
- Analyzing margins like gross profit margin, EBITDA margin, and net profit margin helps benchmark against industry standards.
- Income statement trends inform budgeting, forecasting, and strategic planning for future growth.
- Accurate interpretation of these figures supports investor relations, loan applications, and tax compliance.
Continuing, this article highlights the core elements and practical uses of income statement analysis.
What Is an Income Statement?
An income statement is one of the cornerstone financial documents in business. This statement, often called the profit and loss statement (P&L), methodically details the company’s revenues, expenses, and profits or losses, offering a clear view of its operational effectiveness. What does an income statement shows? This financial report summarizes a company’s revenue, expenses, and profits or losses over time. It is a critical tool for understanding a company’s financial performance over a specific period.
The income statement clearly shows a company’s revenues and expenses over a specific period, typically a quarter or a year. It highlights the company’s ability to generate profit by managing costs and maximizing revenue. The income statement’s bottom line, net income, is a crucial indicator of the company’s financial health and performance.
Income Statement as one of the Three Main Financial Statement
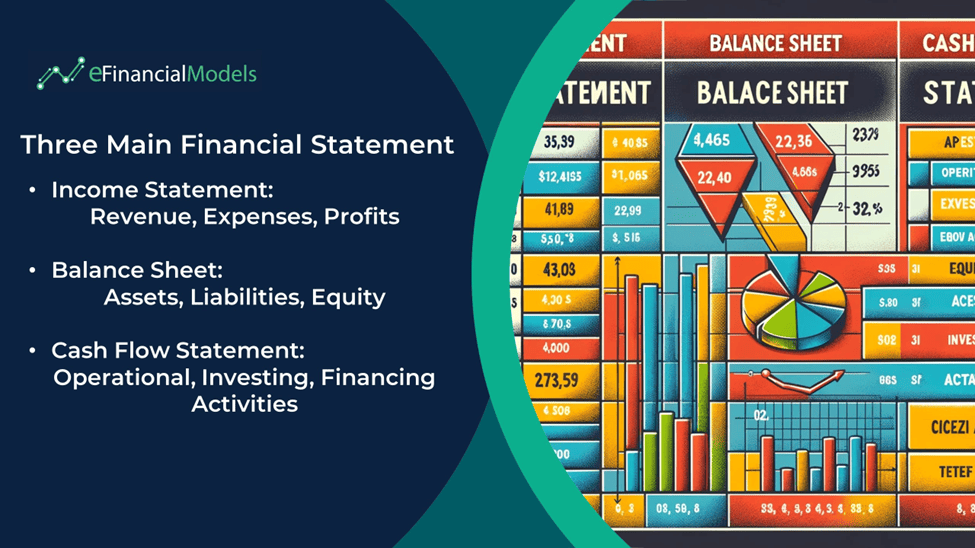
The income statement, one of the three main financial statements, primarily focuses on a company’s revenues and expenses over a specific period, showcasing profitability. It differs significantly from the balance sheet, which provides a snapshot of a company’s assets, liabilities, and shareholders’ equity at a particular point in time, reflecting its financial position. In contrast, the cash flow statement reconciles the net income (found on the income statement) with actual cash inflows and outflows, highlighting the company’s liquidity by showing how cash is generated and used in operating, investing, and financing activities.
While the elements of the income statement reveal performance and profitability, the balance sheet details financial structure, and the cash flow statement focuses on liquidity and cash management. Together, these statements offer a comprehensive view of a company’s financial health, which is essential for informed decision-making in finance.
Why Businesses Use the Income Statement?
Businesses utilize an Excel income statement template, a critical financial document, to meticulously track and analyze their revenue and expenses over a specific period. An Excel income statement template
offers invaluable insights into a company’s profitability, operational efficiency, and financial health, thus serving as a fundamental tool for decision-making and strategic planning for entrepreneurs, investors, and financial professionals.
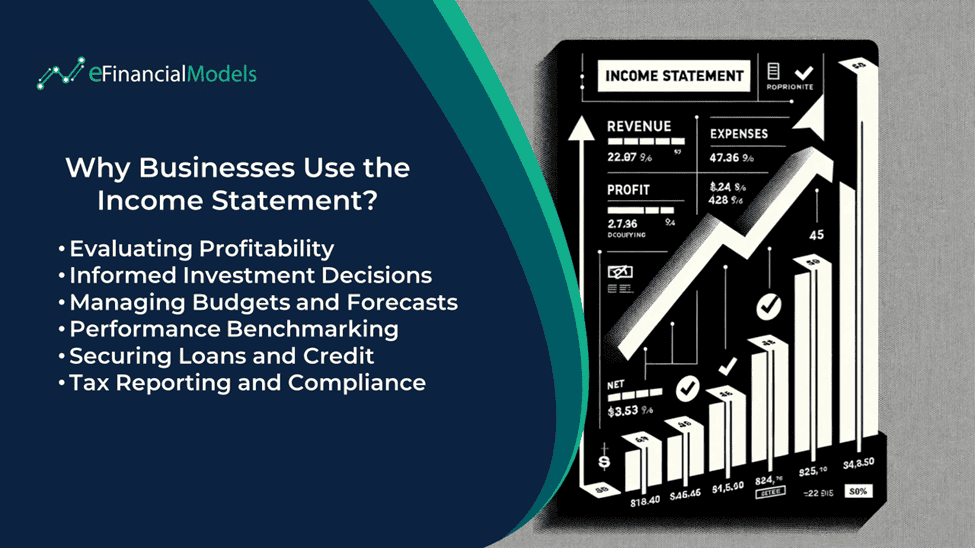
- Evaluating Profitability: It allows stakeholders to assess a company’s ability to generate profit over a specific period. By analyzing trends in revenues and expenses, stakeholders can understand the company’s operational efficiency and profitability trajectory.
- Informed Investment Decisions: Investors use an Excel income statement template to gauge a company’s financial health and future growth prospects. They look at revenue trends, profit margins, and expense management to determine whether to invest in, hold, or sell a company’s stock.
- Managing Budgets and Forecasts: The income statement provides historical data for preparing budgets and financial forecasts. It helps identify spending patterns and revenue streams that shape future financial planning.
- Performance Benchmarking: Companies often compare their income statements with those of peers and industry standards to benchmark their performance. This comparison helps in identifying areas of strength and potential improvement.
- Securing Loans and Credit: Lenders review a company’s income statement to assess its creditworthiness and ability to repay loans. A substantial income statement can facilitate better credit terms.
- Tax Reporting and Compliance: The income statement is crucial for tax purposes as it shows a business’s taxable income. It is used to comply with tax reporting requirements and calculate the amount of tax owed.
At the end of an Excel income statement template, one can see the net income or net loss, which is the final balance after subtracting all expenses from revenues. This bottom line clearly shows a company’s profitability over the accounting period. It’s a critical figure as it forms the basis for calculating earnings per share (EPS) for publicly traded companies and impacts investment decisions.














































The Key Components of an Income Statement
An income statement provides a snapshot of the company’s profitability. An income statement analysis details how revenue transforms into net income after accounting for various expenses. To understand a company’s income statement, you must understand the essential elements of an income statement.
1. Revenue
Revenue, often called sales or turnover, represents a company’s total income from its business activities, typically from selling goods and services to customers. It represents the starting point for an income statement and is crucial for assessing a company’s ability to generate earnings.
- Operating revenue is earned from the company’s core business activities. For instance, a retail company’s revenue comes from the sale of goods, while a service provider makes operating revenue from the company’s services. Operating revenues for a manufacturing company include sales from manufactured products,
- Non-operating revenue is derived from secondary activities. It includes interest income, dividends received, gains from the sale of assets, or rental income. These revenues are peripheral to the primary business operations.
Revenue Growth
Revenue growth is a critical metric that measures a company’s sales or revenue increase over a specific period, typically quarter-over-quarter or year-over-year. It’s calculated by subtracting the previous period’s revenue from the current period’s revenue and then dividing the result by the last period’s revenue. It is then multiplied by 100 to express it as a percentage. For instance, if a company’s revenue were $1 million in the previous year and $1.2 million in the current year, the revenue growth would be ($1.2 million – $1 million) / $1 million * 100 = 20%. Including revenue growth in an Excel income statement template provides a precise, quantifiable measure of a company’s sales performance over time, signaling its market effectiveness and potential for future expansion to stakeholders.
The ideal revenue growth rate can vary depending on the industry, market conditions, and company size. Annual growth rates of 20% to 30% or more might be expected for start-ups and high-growth sectors like technology or healthcare. In contrast, well-established companies in more mature or stable industries may consider 5% to 10% annual growth as healthy. Ultimately, the ideal revenue growth outpaces inflation, exceeds industry averages, aligns with the company’s strategic goals, and is achieved without compromising profitability or cash flow.
2. Direct Costs
Direct costs are a crucial elements of an income statement as they directly relate to the production or procurement of the goods or services that a business sell. They are also termed the Cost of Goods Sold (COGS). They are expenses directly related to the production of specific goods or services. They are variable costs, meaning they fluctuate with the production or service provision level. For example, the costs of raw materials and direct labor (production workers) are direct costs in a manufacturing company. Direct costs are typically listed immediately after revenue on the income statement, helping calculate the gross profit.
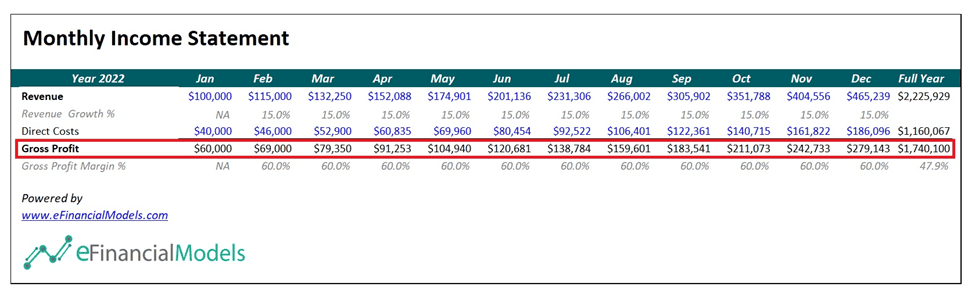
3. Gross Profit
Gross profit represents a company’s profit after deducting the costs associated with producing and selling its goods or the costs of services rendered. It’s calculated as:
Gross Profit = Revenue – Direct Costs
This figure is significant because it provides insight into the core profitability of a company’s primary activities during an income statement analysis. It directly reflects production efficiency and can serve as a critical indicator of potential areas for cost management and optimization.
Gross Profit Margin
Gross Profit Margin represents the proportion of revenue that exceeds the direct costs or cost of goods sold (COGS), signifying the efficiency with which a company utilizes labor and supplies in production. It is calculated by subtracting COGS from total revenue and dividing the result by the total revenue, typically expressed as a percentage. Including Gross Profit Margin in the income statement is essential as it clearly indicates a company’s production efficiency and profitability, guiding strategic pricing and cost management decisions. A higher gross profit margin suggests a company effectively manages its production costs and generates substantial revenue from its sales. Different industries have varying costs of goods sold (COGS), directly impacting GPM. For instance, software companies often have very high GPMs (often above 70-80%) due to low COGS, while retail or manufacturing businesses might see lower margins, possibly around 20-30%.
4. Operating Expenses (OPEX)
Operating Expenses represent the costs associated with the day-to-day operations of a business. These expenses are necessary for maintaining the company’s current revenue stream but do not include the costs directly tied to producing goods or services (those are classified as Cost of Goods Sold or COGS). OPEX typically consists of the following:
- Salaries and Wages: Compensation paid to employees.
- Rent and Utilities: Costs for physical space and essential services.
- Insurance: Premiums for various business insurance policies.
- Depreciation and Amortization: Reflecting the usage and aging of long-term assets.
- Maintenance and Repairs: Keeping assets in working order.
- Travel and Entertainment: Costs related to business travel and client entertainment.
- Office Supplies and Software: Regular consumables and software licenses.
- Advertising and Marketing: Costs to promote the business.
5. EBITDA
EBITDA, which stands for Earnings Before Interest, Taxes, Depreciation, and Amortization, is a widely used financial metric critical in analyzing and interpreting a company’s financial performance, especially within income statements. Its prominence arises from its ability to provide a clear view of a company’s operational profitability by removing the effects of non-operating decisions and accounting choices. It’s calculated as:
EBITDA = Gross Profit – OPEX
EBITDA concentrates on the profits generated from core business operations. It excludes expenses and incomes not directly tied to the business’s primary activities, such as interest, taxes, and depreciation/amortization expenses. This focus makes EBITDA an effective tool for comparing the operational efficiency of companies across different industries or geographical locations.
EBITDA Margin
EBITDA Margin is a measure of a company’s operating profitability. This financial metric is calculated by dividing EBITDA by total revenue. EBITDA itself is determined by adding back interest, taxes, depreciation, and amortization expenses to net income. Including EBITDA Margin in the income statement provides a more focused view of operational profitability and efficiency, unaffected by financing, accounting, or tax strategies.
Comparing a company’s EBITDA Margin to the industry average is essential. Industries like software and healthcare typically have higher margins due to lower capital and operational expenditures, whereas manufacturing and retail often have lower margins due to higher costs.
6. Depreciation & Amortization (D&A)
Depreciation and amortization (D&A) represent the systematic allocation of the cost of tangible and intangible assets over their useful lives.
- Depreciation pertains to tangible assets like machinery, vehicles, and buildings, reflecting their wear and tear or obsolescence over time.
- Amortization relates to intangible assets such as patents, trademarks, and goodwill, accounting for their diminishing value as their benefits are consumed or expire.
These non-cash expenses are essential for understanding a company’s operational costs and making informed financial decisions, as they significantly impact net income by reducing taxable income, thus influencing the company’s profitability and cash flow. Accurate calculation and reporting of D&A provide insights into asset utilization and investment needs, making them indispensable for entrepreneurs, investors, and financial professionals in assessing a company’s financial health and long-term sustainability.
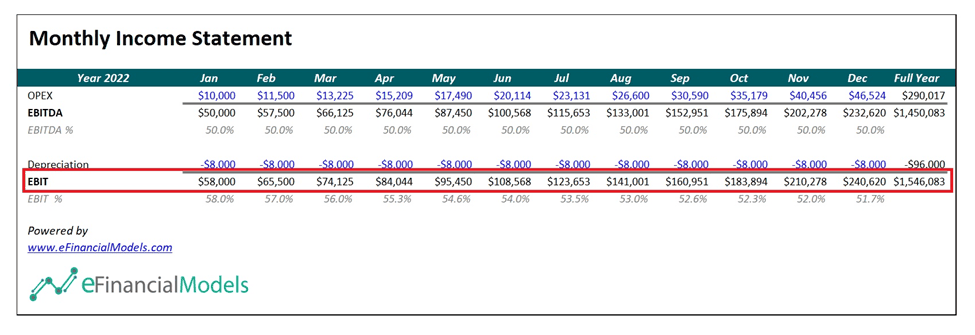
7. EBIT
Earnings Before Interest and Taxes (EBIT) represents a company’s operating profit, calculated before accounting for interest and taxes, focusing purely on its operational efficiency. By excluding expenses like interest and taxes, EBIT provides a clear view of a firm’s core profitability derived from its primary business activities. It’s calculated as:
EBIT = EBITDA – Depreciation and Amortization
EBIT is an essential tool for investors, lenders, and financial professionals, as it offers a standardized way to compare profitability across different companies and industries unaffected by varying capital structures and tax strategies.
EBIT Margin
EBIT Margin represents a company’s earnings before interest and taxes as a percentage of its total revenue. This margin is a crucial indicator of a firm’s operational profitability, excluding the effects of financing and accounting decisions. To calculate the EBIT Margin, one first determines the Earnings Before Interest and Taxes (EBIT) by subtracting all operating expenses (except interest and taxes) from the company’s total revenue. Then, this figure is divided by the total revenue and multiplied by 100 to express it as a percentage. The resulting EBIT Margin offers a clear view of the company’s core profit-making efficiency, uninfluenced by tax liabilities and capital structure, making it a valuable tool for comparing profitability across companies and industries where these external factors differ.
Including EBIT Margin in the income statement is vital because it provides a focused view of a company’s operational efficiency, isolating core business performance from the influences of financing and tax environments. A “good” EBIT Margin can vary significantly depending on the industry, the scale of the business, and market conditions. For instance, larger, established companies might have more stable and higher EBIT Margins than smaller, growth-oriented firms reinvesting earnings into the business.
































8. Interest Expenses
Interest expense represents the cost incurred by an entity for borrowing funds. Typically arising from loans, bonds, or credit lines, this expense reflects the interest payments due to lenders or creditors within a specific reporting period. In financial analysis and decision-making, interest expense is integral for understanding a company’s debt burden and ability to manage and service its debt. It affects net income and, by extension, metrics like earnings per share (EPS), influencing investment decisions and valuations. Understanding interest expense is, therefore, essential for accurate financial planning, budgeting, and assessing a company’s long-term viability and profitability.
9. Interest Income
Interest income represents the revenue generated from interest-bearing assets like savings accounts, certificates of deposit, bonds, loans receivable, and other similar financial instruments. In the broader context of financial analysis, interest income is a vital indicator of a firm’s capacity to generate earnings from its idle cash or financial investments, distinct from its core business operations.
10. Non- Operating Expenses
Non-operating expenses are costs not directly tied to the core operational activities of a business. These expenses include interest payments on debt, losses from foreign exchange transactions, asset write-downs, and legal settlements. Unlike operating expenses related to the day-to-day business operations, non-operating expenses reflect the company’s financial and investment decisions and extraordinary events.
11. Extraordinary Expenses
Extraordinary expenses refer to unusual or infrequent costs that a company incurs, distinct from its regular business operations. As one of the elements of an income statement, these expenses are significant because they do not stem from the company’s primary or ongoing business activities and are not expected to recur regularly. Examples include costs from natural disasters, large-scale asset impairments, or legal settlements.
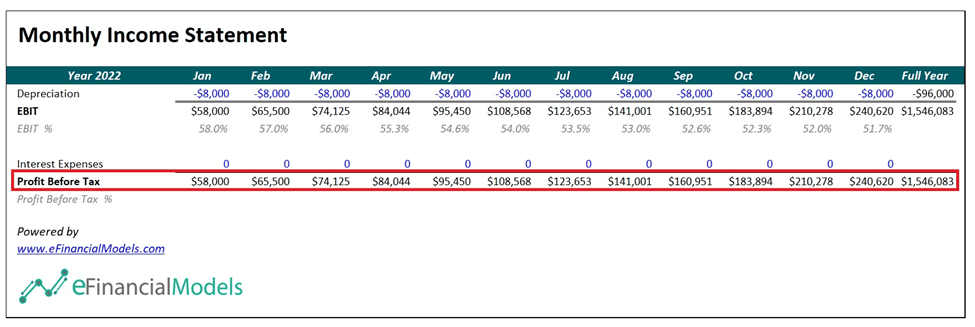
12. Profit Before Taxes
Profit Before Taxes (PBT) refers to a company’s profitability before accounting for its tax liability. It’s calculated by subtracting all operating and non-operating expenses, including interest expenses, from the total revenues generated during a financial period. PBT provides a clear view of a company’s operational efficiency and financial performance, excluding the variable impacts of different tax rates and tax relief measures.
Profit Before Taxes Margin
The Profit Before Taxes (PBT) Margin represents a company’s profitability before accounting for its tax obligations. It is calculated by dividing the Profit Before Taxes by the company’s revenue, typically expressed as a percentage. Including Profit Before Taxes Margin in the income statement is essential as it offers a transparent view of a company’s operational efficiency, uninfluenced by tax considerations and non-operational factors.
The concept of a “good” Profit Before Tax (PBT) Margin in an income statement can vary significantly depending on the industry, company size, market conditions, and other factors. Industries with high capital expenditure or cost of goods sold, like manufacturing or retail, might have lower PBT Margins than sectors like software or services, which typically have higher margins due to lower variable costs. It’s crucial to compare a company’s PBT Margin against industry averages or key competitors to determine what is considered “good” in that specific context.
13. Income Taxes
Income taxes represent the amount of tax a company owes to government authorities based on its taxable income, which is its earnings before taxes. These taxes are significant for most businesses, affecting net income and profitability. Complex and varying tax laws govern the calculation of income taxes and often involve provisions for deferred taxes due to timing differences in income recognition between tax laws and accounting practices. As such, income taxes reflect a company’s current tax liability and future tax obligations or savings, making them a critical indicator for investors and analysts in assessing a company’s financial health and effective tax management strategies.
14. Net Income
Net income or net profit is the amount of money a company retains after subtracting all its expenses from its total revenue. It indicates a company’s profitability over a specific period. It is derived by deducting all expenses, taxes, and costs from total revenue. This figure, often called the “bottom line,” reflects a company’s net earnings or losses. It’s a vital indicator of a company’s financial health and efficiency in managing its operations and costs. Its significance extends beyond mere profitability, influencing company valuation, dividend payments, and reinvestment strategies.
Net Profit Margin
Net Profit Margin measures a company’s profitability, expressed as a percentage. It reveals how much of each dollar earned in revenue is ultimately converted into profit. To calculate it, divide the net profit (income minus all expenses, taxes, and interest) by the total revenue and multiply the result by 100. A higher Net Profit Margin indicates a more profitable and efficient company, whereas a lower margin suggests potential areas for cost control and operational improvement. Including Net Profit Margin in the income statement is essential as it provides investors and decision-makers with a clear insight into the company’s profitability and operational efficiency.
Net profit margin can vary significantly depending on the industry, market conditions, and specific business model. For example, high-margin industries like software can see net profit margins of 20% or higher, whereas low-margin industries like supermarkets might have net profit margins around 1-2%. Generally, a higher net profit margin means a company is more efficient at converting revenue into actual profit.
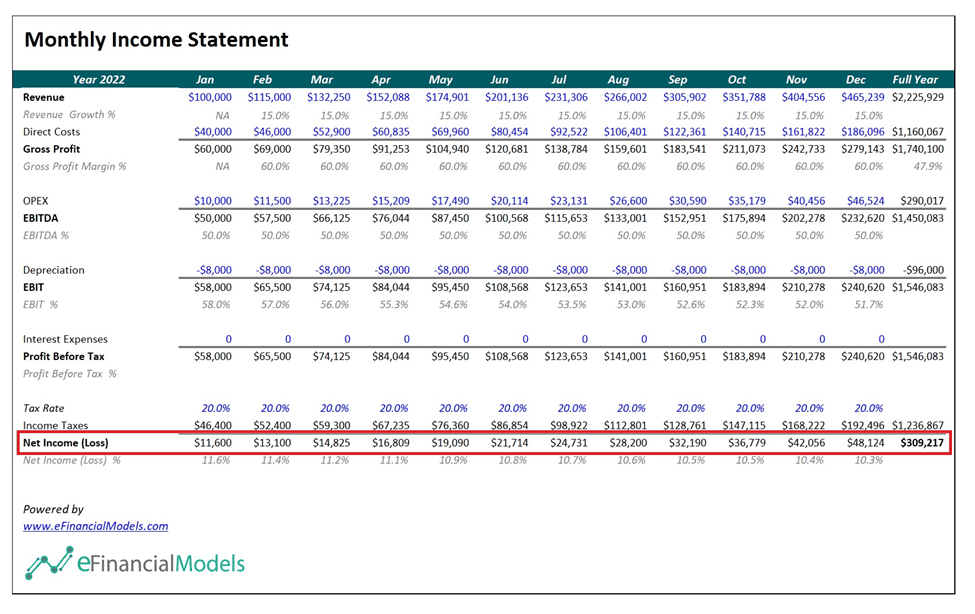
In summary, what does an income statement show offers a detailed view of a company’s financial performance over a specific period. It effectively breaks down the revenue streams, cost of goods sold, operating expenses, and other relevant income and expenses, leading to the net income. Income statement analysis is crucial as it clearly shows a company’s profitability and operational efficiency. Understanding each component enables informed decision-making, facilitating better financial planning, investment analysis, and overall strategic direction for a business.
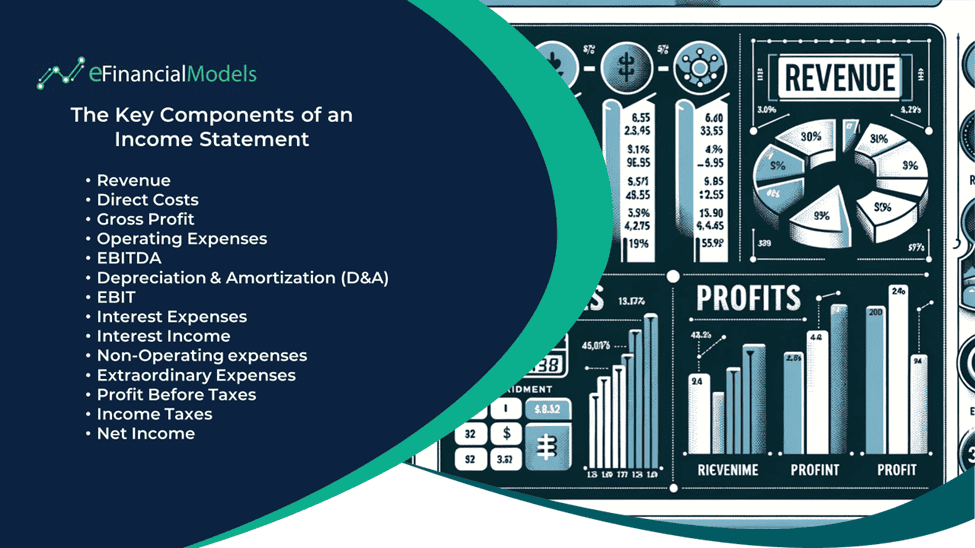
Model Financial Success Through Income Statement Analysis
Embracing the power of income statement analysis is crucial to achieving financial success. It enhances your understanding of a business’s financial health and gives you the insights to make informed decisions. Financial modeling is invaluable in income statement analysis, offering a multifaceted approach to understanding and predicting a company’s financial health. It enables detailed forecasting, scenario and sensitivity analysis, margin examination, trend observation, and links to cash flow implications, all crucial for robust financial planning and strategic decision-making.
eFinancialModels.com is a premier online platform offering sophisticated Excel income statement templates explicitly tailored for diverse business analysis and financial planning needs. These models are expertly designed to assist entrepreneurs, investors, and finance professionals in accurately evaluating financial performance and making informed decisions. Start your journey today and unlock the potential of sophisticated financial analysis to model your path to success.
You might also like:
- 10 Tips to Develop a First Class Business Valuation Report
- 10 Main Elements of a Business Plan
- Financial Statements – Definition, Uses, Contents and Templates
- Top 5 Principles of Corporate Finance
- Financial Ratios Analysis and Its Importance
- Understanding the Debt Service Coverage Ratio: An Essential Metric for Financial Analysis
- Cash Flow Statement: Streamline Financial Success
- Achieve Financial Success By Knowing Your Business Plan Model
- How to Prepare a Financial Feasibility Study?
- How to Write a Killer Mobile App Business Plan
- Financial Modeling for Startups and Small Businesses
- How to Build a Capitalization Table
- Understanding What is Yield to Maturity and Why It Matters
- 5 Best Practices for Managing Days Receivables
- Finding Fair Market Value: A Quick Guide to Real Estate Valuation
- IRR vs NPV in the Context of Financial Decision-Making
- B2C Versus B2B – The Meaning for Startups
- How to Use Excel for Financial Analysis?
- 10-Step Financial Planning Checklist for Smart Executives
- Exploring the Benefits of a Rental Property Excel Spreadsheet