
0 ITEMS

Solar Panel Manufacturing Plant Business Plan Financial Model Excel Template
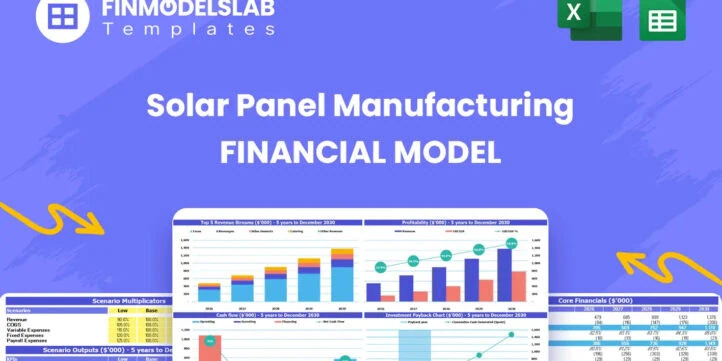
The Solar Panel Manufacturing Financial Model helps users turn a solar factory concept into a structured, investor-ready financial forecast. It is designed for entrepreneurs, founders, business owners, consultants, analysts, and planning teams who need to evaluate the economics of producing and selling solar panels before launching, raising capital, or expanding operations. Instead of starting from a blank spreadsheet, users can work from a ready-to-use model built around the key drivers of a photovoltaic manufacturing business, including production volume, average selling price, product mix, startup costs, operating expenses, payroll, cost of goods sold, cash flow, profitability, and funding requirements. This financial model template is especially useful for preparing business plans, lender submissions, investor presentations, internal budgets, and feasibility studies. Solar panel manufacturing requires significant upfront investment in facilities, machinery, production automation, raw materials, research and development, quality control, and working capital. The model helps users organize these assumptions in one place and connect them to five-year financial projections, giving decision-makers a clearer view of how the business may perform under different operating conditions. Users can update editable assumptions to reflect their own factory size, production strategy, sales channels, pricing approach, staffing plan, and cost structure. The template supports practical financial planning by combining revenue assumptions with expense planning and automated outputs. It helps users estimate how much capital may be required, when cash flow gaps may occur, how quickly the business can move toward profitability, and what returns investors or lenders may expect. By modeling revenue streams, manufacturing costs, payroll, overhead, and capital expenditures together, the template makes it easier to test scenarios, review margins, evaluate liquidity, and understand the financial impact of scaling production over time. Built for both planning and presentation, the Solar Panel Manufacturing Financial Model includes dashboards, charts, financial reports, KPI views, scenario analysis, and profitability tools that help communicate the business case clearly. It is fully customizable, compatible with Excel and Google Sheets, and suitable for users who want a professional framework without hiring a consultant or building a complex model from scratch. Whether you are preparing a solar panel factory startup plan, analyzing a renewable energy manufacturing opportunity, or refining an expansion case, this model helps support better forecasting, break-even analysis, funding discussions, and data-driven decision-making.


Financial Model Overview
The Solar Panel Manufacturing Financial Model is a ready-to-use financial model template designed to help entrepreneurs, founders, business owners, consultants, analysts, and planning teams evaluate the financial potential of a solar panel manufacturing business. Solar manufacturing is capital intensive, with major decisions tied to factory build-out, automated production lines, raw material sourcing, labor planning, quality control, logistics, pricing, and long-term production capacity. This template brings those moving parts into one structured forecasting system so users can estimate revenue, costs, cash flow, profitability, funding needs, and investor returns over a multi-year planning period. It is useful for business plans, funding applications, investor presentations, lender discussions, feasibility studies, internal budgeting, and strategic decision-making. The model is fully editable, allowing users to replace the built-in assumptions with their own production volumes, panel categories, selling prices, manufacturing costs, payroll needs, capital expenditures, and financing plans. By connecting operational assumptions with financial statements and visual reports, the template helps users understand whether a solar panel factory can scale sustainably, where cash pressure may occur, and which assumptions have the greatest impact on profitability.
All-in-One Dashboard
The all-in-one dashboard gives users a central view of the most important inputs and outputs in the Solar Panel Manufacturing Financial Model. Instead of searching through multiple worksheets to understand the business case, users can review core assumptions, headline financial results, and performance indicators in one organized place. This component may include inputs such as production start date, forecast period, revenue assumptions, cost assumptions, investment timing, and financing structure, while the output side may summarize revenue, gross profit, EBITDA, cash balance, investment requirements, payback period, and other key figures. For a solar panel manufacturing business, this is especially useful because the model needs to coordinate high upfront capital spending with ramping production volumes and evolving unit economics. The dashboard helps users quickly identify whether the current plan is financially realistic, whether the business has enough liquidity, and whether margins are strong enough to support the cost structure. It is also valuable for stakeholder communication because it turns a complex manufacturing forecast into a concise financial snapshot that can be reviewed during planning meetings, investor calls, or lender discussions. Users can adjust assumptions elsewhere in the model and return to the dashboard to see how the core outputs change, making it a practical control center for financial planning and decision-making.
Low, Base, and High Scenario Analysis
The low, base, and high scenario analysis component allows users to compare how the solar panel manufacturing business may perform under different market and operating conditions. A manufacturing plan can look very different depending on sales volume, product pricing, raw material costs, factory utilization, labor efficiency, logistics costs, and the pace of customer adoption. This section helps users test conservative, expected, and optimistic cases without rebuilding the model from scratch. The low case may reflect slower production ramp-up, lower selling prices, higher cost of goods sold, or delayed customer contracts. The base case may represent the most realistic operating plan using the primary assumptions. The high case may show the impact of stronger demand, higher utilization, better procurement terms, or improved margins. The outputs can include comparative revenue, profitability, cash flow, funding needs, and return metrics, giving users a clearer view of risk and upside. For investors and lenders, scenario analysis is important because it shows that the business plan has been tested beyond a single forecast. For founders and operators, it supports better decision-making by showing which assumptions matter most and what financial cushion may be needed if market conditions are weaker than expected. This component makes the financial model more practical, defensible, and useful for planning under uncertainty.
Professional Charts
The professional charts component transforms the financial forecast into clear visual reports that can be used for presentations, business plans, investor decks, lender submissions, and internal reviews. Solar panel manufacturing forecasts involve many interconnected metrics, including production volume, revenue growth, gross margin, operating expenses, EBITDA, capital spending, cash flow, and funding requirements. Charts help users understand these trends faster than reviewing rows of spreadsheet data alone. This component may visualize annual revenue growth, margin progression, cash balance movement, expense composition, product line contribution, profitability trends, and investment payback. The charts are useful because they make it easier to explain how the business scales from initial production to higher output levels over time. They can also highlight important issues, such as whether revenue growth is being supported by improving margins or whether expansion is creating cash pressure. For consultants and analysts, polished charts save time when preparing client deliverables. For founders, they help communicate the opportunity to investors in a way that is easier to digest. For lenders, visual reports can support a clearer understanding of debt repayment capacity and financial resilience. Because the template is editable, users can update assumptions and use the charts to instantly reflect the revised forecast, improving both analysis and presentation quality.
ROE Components and DuPont Analysis
The ROE components and DuPont analysis section helps users understand what is driving return on equity in the solar panel manufacturing business. Return on equity is an important investor metric because it shows how effectively the company uses shareholder capital to generate profit. DuPont analysis breaks ROE into underlying components, typically linking profitability, asset efficiency, and leverage. In a solar manufacturing context, this is especially valuable because the business requires substantial investment in facilities, production equipment, inventory, and working capital. Strong revenue alone does not guarantee attractive returns if assets are underutilized, margins are weak, or financing costs are too high. This component may use inputs from the income statement, balance sheet, and financing assumptions to calculate metrics such as net margin, asset turnover, equity multiplier, and overall ROE. The outputs help users see whether investor returns are being driven by healthy operating performance, efficient use of assets, or reliance on financial leverage. This insight supports better strategic planning because management can identify whether to focus on improving production efficiency, negotiating better raw material costs, increasing factory utilization, controlling overhead, or optimizing the capital structure. For funding discussions, DuPont analysis adds depth to the financial model by showing investors not only the projected returns but also the operational and financial drivers behind those returns.
Revenue Inputs
The revenue inputs component is where users define the commercial assumptions that drive the sales forecast for the solar panel manufacturing business. This section may include production volume by product category, average selling price, sales growth rates, pricing changes, market ramp-up timing, and product mix assumptions. A solar panel factory may sell residential panels, commercial panels, utility-scale panels, flexible solar film, integrated roof tile products, or other photovoltaic solutions, and each category may have different pricing, volume potential, margin profile, and demand pattern. By separating these drivers, the model allows users to build a more realistic revenue forecast than a single generic sales line. Users can adjust volumes to reflect planned capacity, customer contracts, channel strategy, and production ramp-up. They can also modify prices to reflect competition, technology changes, procurement agreements, or annual price erosion in the solar market. The outputs from this section feed into total revenue, gross profit, operating profitability, cash flow, and valuation-related metrics. For business planning, revenue inputs help users test whether the proposed factory can generate enough sales to cover fixed costs and capital investment. For investor presentations, they provide a transparent basis for the revenue forecast, making it easier to explain how the business intends to grow and what assumptions support the projected financial results.
Bank-Ready Reports
The bank-ready reports component provides structured financial outputs that can support lender review, loan applications, credit analysis, and formal business planning. Solar panel manufacturing projects often require external financing because factory construction, automated equipment, laboratory setup, raw material inventory, and working capital can require significant upfront capital. Lenders typically need clear financial statements and repayment indicators before evaluating a funding request. This component may include projected profit and loss statements, cash flow statements, balance sheets, debt schedules, profitability summaries, and liquidity measures. These reports help users present the business in a format that is easier for banks and financial institutions to review. Inputs such as revenue assumptions, cost of goods sold, operating expenses, payroll, capital expenditures, loan proceeds, interest rates, repayment terms, and tax assumptions flow through to the reports automatically. The outputs help demonstrate whether the business can generate enough earnings and cash flow to service debt, maintain working capital, and remain solvent during the production ramp-up period. For founders, bank-ready reports reduce the time needed to prepare financing documents. For advisors and consultants, they provide a professional framework for reviewing the strength of the funding case. For lenders, they create a clearer view of projected performance, cash coverage, and financial risk.
Revenue Breakdown
The revenue breakdown component gives users a detailed view of how each revenue stream contributes to total sales over the forecast period. In solar panel manufacturing, not all products perform the same way. Residential panels may have different pricing and order sizes than commercial panels, while utility-scale panels may depend on large contracts and flexible solar film may follow a different adoption curve. Integrated roof tile products may carry a premium price but require different sales assumptions. This section helps users understand the contribution of each product line by showing revenue by category, unit volume, average price, and growth pattern. It may also show how the product mix changes over time as the factory scales and as market demand shifts. The outputs help users identify which revenue streams are driving growth, which products may offer the best margin opportunity, and where concentration risk may exist. This is useful for strategic planning because it supports decisions about production priorities, sales focus, capacity allocation, and customer targeting. If one product line contributes a large share of future revenue, users can test whether that assumption is realistic and whether additional diversification is needed. For investors, a detailed revenue breakdown makes the forecast more credible because it shows the logic behind total sales rather than presenting revenue as a single high-level figure.
KPI Dashboard
The KPI dashboard component helps users monitor the operating and financial performance indicators that matter most for a solar panel manufacturing business. A full financial forecast includes many detailed schedules, but decision-makers often need a focused view of the metrics that show whether the business is on track. This section may track revenue growth, gross margin, EBITDA margin, net profit margin, cash balance, production volume, average selling price, cost of goods sold, return on equity, payback period, and other performance measures. It can also include benchmark-style indicators to compare the projected performance against industry expectations or internal targets. For a manufacturing business, KPIs are useful because they connect operational execution with financial results. If production volume rises but margins fall, the KPI dashboard can help flag cost pressure. If revenue grows but cash balance declines, it may point to working capital needs or capital spending timing. If profitability improves while asset use remains inefficient, management may need to revisit capacity planning. This component supports ongoing decision-making by helping users review the model from a management perspective rather than only through financial statements. It is also useful for presentations because it gives investors, lenders, and stakeholders a concise summary of performance, risk, and progress toward financial goals.
Startup Costs and Capital Expenditure Planning
The startup costs and capital expenditure planning component helps users estimate the upfront investment required to launch or expand a solar panel manufacturing operation. This is one of the most important sections of the model because solar manufacturing usually requires significant spending before meaningful revenue begins. Inputs may include manufacturing facility build-out, automated production lines, machinery, tooling, laboratory equipment, research and development setup, quality control systems, installation costs, permits, deposits, initial raw material inventory, technology systems, pre-opening payroll, professional fees, and initial working capital. The section helps organize these costs by category and timing so users can understand how much capital is needed before the business becomes operational. The outputs may feed into the cash flow forecast, balance sheet, depreciation schedule, financing needs, and investor funding request. This component is useful for budgeting because it reduces the risk of overlooking major launch expenses. It is useful for fundraising because it provides a clear explanation of how capital will be used. It is useful for decision-making because users can test alternative factory sizes, equipment choices, leasing strategies, or phased investment plans. By showing the relationship between capital expenditure and future production capacity, the model helps users evaluate whether the planned investment level is aligned with the revenue forecast and growth strategy.
Similar ProductsOther customers were also interested in...


 eFinancialModels
Battery Energy Pricing Model
The Battery Energy Pricing Model calculates the required energy price for an industrial-scale batter... Read more
 AUT
AUT
Solar Energy Power Plant Financial Model
In order to assess the financial viability of a Solar Park project, the Solar Energy Financial Model... Read more

Solar Energy Financial Model
The Solar Energy Financial Model Spreadsheet Template in Excel assists you in preparing a sophistica... Read more

 Pushkar
Green Hydrogen Project Financial Model (Electrolys...
A Project-Level Financial Model to assess the financial feasibility of setting up and operating a Gr... Read more
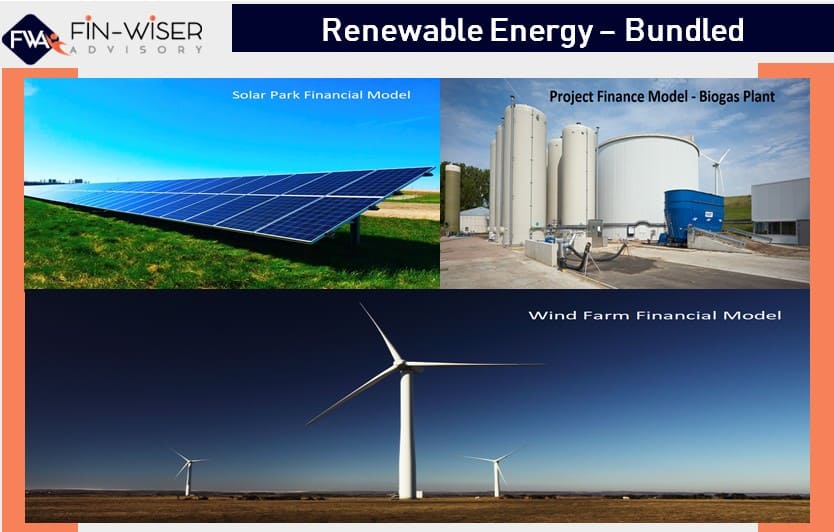
Renewable Energy Financial Model Template Bundle
Take this opportunity and get a discount by getting the Renewable Energy Bundle where you get Solar,... Read more

Ethanol and Sugar Production Plant Financial Model
Fin-wiser’s Ethanol and Sugar Plant PPP project model helps users to assess the financial viabilit... Read more

Hydrogen Gas Equipment Manufacturing and Sales Mod...
This is a very detailed and user-friendly financial model with three financial statements ... Read more

Business Plan for a Biodiesel Manufacturing Plant
Setting up a biodiesel manufacturing plant requires a comprehensive and executed business strategy. ... Read more

Green Hydrogen (Electrolysis) Production Financial...
This green hydrogen financial model template builds a multi-year financial plan to analyze the finan... Read more
Green Ammonia from Renewable Energy Financial Mode...
This comprehensive 40-year tool aid investors in evaluating potential risks and returns and assess t... Read more
You must log in to submit a review.