
0 ITEMS

Bakery Financial Model Excel Template
The Bakery Financial Model helps entrepreneurs, bakery owners, consultants, analysts, and business plan writers turn a bakery concept into a structured financial forecast. Instead of estimating sales, expenses, staffing, cash flow, and startup needs in separate files, this financial model template brings the key assumptions together in one editable workbook. It is designed to support practical financial planning for a bakery, café-bakery, dine-in bakery, takeout-focused concept, or growing food and beverage business that needs a clearer view of revenue potential, operating costs, and profitability. Built for business planning, funding preparation, and internal decision-making, the model helps users estimate how the bakery may perform over time based on realistic revenue assumptions. Users can adjust daily customer volume, average check size, weekday and weekend sales patterns, food and beverage mix, takeout and delivery activity, cost of goods sold, payroll, operating expenses, and startup costs. These assumptions flow through the forecast to help evaluate cash flow, profit margins, break-even timing, and funding needs before major decisions are made. The template is especially useful for founders preparing lender discussions, investors reviewing the economics of a bakery, business owners planning expansion, and advisors building financial projections for clients. It includes a professional structure for reviewing financial performance, comparing scenarios, presenting charts, analyzing key ratios, and monitoring important bakery metrics. By connecting revenue drivers with expenses and capital requirements, the Bakery Financial Model helps users understand whether the business can support its staffing plan, ingredient costs, rent, marketing, equipment, and working capital needs. Rather than building a bakery forecast from scratch, users can start with a ready-made financial model template that is editable, organized, and compatible with Microsoft Excel and Google Sheets. It supports up to five years of projections and gives users a practical framework for testing assumptions, reviewing profitability, identifying cash flow gaps, preparing bank-ready financial outputs, and making more confident decisions. Whether you are launching a new bakery or refining the financial plan for an existing one, this model provides a structured way to move from idea to numbers.
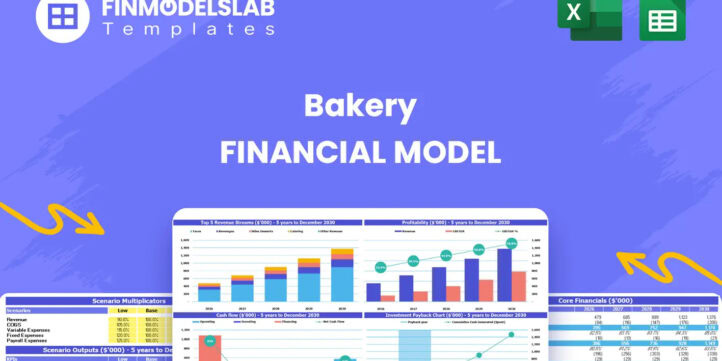


Financial Model Overview
The Bakery Financial Model is a ready-to-use financial model template designed to help users evaluate the financial potential of a bakery before launch, expansion, financing, or strategic planning. It brings together the core assumptions a bakery owner or planner needs to understand, including customer traffic, average order value, sales mix, ingredient costs, payroll, operating expenses, startup investment, cash flow, profitability, and investor returns. For a bakery, small changes in daily covers, weekend demand, ingredient costs, staffing levels, rent, or takeout volume can significantly affect margins and liquidity, so this model gives users a structured way to test those assumptions instead of relying on rough estimates. The template is built for entrepreneurs, business owners, consultants, analysts, and founders preparing business plans, bank packages, investor presentations, or internal forecasts. With editable inputs, automated calculations, clean outputs, and compatibility with Excel and Google Sheets, it provides a practical framework for planning a bakery with greater clarity and confidence.
All-in-One Dashboard
The all-in-one dashboard gives users a central view of the bakery’s most important inputs and outputs in one organized place. Instead of moving through multiple worksheets to understand the current forecast, users can review the key drivers of the business and see how those assumptions affect revenue, expenses, cash flow, profitability, and overall performance. For a bakery, this may include daily customer volume, average check size, revenue mix, food and beverage cost assumptions, payroll structure, operating expense levels, startup investment, financing assumptions, and projected returns. The dashboard is useful because it turns a detailed financial model into a quick decision-making tool. A founder can use it to understand whether the business concept is financially realistic, an owner can use it to monitor planned growth, and a consultant can use it to present the forecast in a professional format. By connecting core assumptions with core outputs, the dashboard helps users see the financial story of the bakery without getting lost in the mechanics of the spreadsheet.
Low, Base, and High Scenario Analysis
The low, base, and high scenario analysis component helps users evaluate how the bakery may perform under different business conditions. A bakery forecast should not assume that every plan will unfold exactly as expected, because customer traffic, average order value, ingredient pricing, staffing needs, rent, delivery fees, and seasonality can all change the final outcome. This section allows users to compare a conservative case, an expected case, and an optimistic case using adjustable assumptions. For example, the low case may reflect slower opening traffic, weaker weekend demand, or higher costs, while the high case may reflect stronger customer adoption, improved average check size, better margins, or faster sales growth. The outputs help users review the effect of each scenario on revenue, gross profit, EBITDA, cash balance, funding needs, and profitability timing. This is especially valuable for lenders, investors, and internal decision-makers because it shows that the bakery plan has been stress-tested and that management understands the potential upside and downside of the business model.
Professional Charts
The professional charts component translates the bakery’s financial projections into clear visual reports that can be used for presentations, funding discussions, and internal reviews. Charts can make it easier to understand trends that may be difficult to interpret from spreadsheet rows alone, such as revenue growth, expense behavior, cash flow movement, profit margin improvement, break-even progress, or changes in key performance indicators over time. For a bakery, visualizing these numbers is particularly useful because performance depends on multiple connected drivers, including customer volume, sales mix, cost of goods sold, payroll, occupancy costs, and operating efficiency. The charts help users quickly communicate whether revenue is growing at a sustainable pace, whether margins are improving, and whether cash flow remains healthy as the business scales. They are also useful when preparing a business plan or investor presentation, because stakeholders often want to see the financial trajectory before reviewing the detailed assumptions. This section supports a more professional and accessible presentation of the bakery forecast.
ROE Components and DuPont Analysis
The ROE components and DuPont analysis section helps users understand the drivers behind return on equity rather than only viewing a single return percentage. Return on equity can be influenced by profitability, asset efficiency, and financial leverage, and DuPont analysis separates these elements so users can see what is actually creating or limiting investor returns. In the context of a bakery, this can help determine whether returns are being supported by strong profit margins, efficient use of equipment and working capital, or the structure of financing used to launch or expand the business. Inputs may include net income, revenue, total assets, equity, debt assumptions, and other balance sheet values that flow through the forecast. The output helps founders and investors evaluate whether the bakery is generating attractive returns in a financially healthy way. This is useful for funding discussions because it provides a deeper explanation of performance and helps users identify whether they should focus on improving margins, increasing sales productivity, optimizing asset investment, or adjusting the financing structure.
Revenue Inputs
The revenue inputs section is where users define the commercial assumptions that drive the bakery’s sales forecast. For a bakery, revenue is often shaped by weekday and weekend traffic, average customer spend, product mix, dine-in sales, beverage sales, takeout and delivery activity, catering, wholesale opportunities, and changes in demand as the brand becomes established. This component allows users to edit the assumptions that best reflect their location, concept, pricing strategy, seating capacity, menu positioning, and growth expectations. Inputs may include daily customer volume, average check size, monthly ramp-up, revenue stream percentages, pricing changes, seasonality, and sales growth rates. The model then uses these assumptions to generate projected revenue across the forecast period. This section is valuable because revenue assumptions are often the most scrutinized part of a bakery business plan. By documenting the drivers clearly, users can build a more credible forecast, test different pricing and traffic scenarios, and understand what level of sales activity is needed to support payroll, rent, ingredient costs, and profitability goals.
Bank-Ready Reports
The bank-ready reports component gives users organized financial outputs that are suitable for lender, investor, or stakeholder review. When a bakery seeks financing, lenders usually want to understand startup costs, revenue assumptions, operating expenses, cash flow, debt service capacity, profitability, and break-even timing. This section brings the model’s outputs into a clean and professional format so users can share financial projections with less rework. It may include forecasted profit and loss statements, cash flow statements, balance sheet views, funding summaries, debt repayment analysis, and key performance highlights. For a bakery, this is important because financing may be needed for kitchen equipment, build-out, ventilation systems, furniture, inventory, deposits, working capital, and early marketing. The reports help show how the bakery plans to generate revenue, manage costs, maintain liquidity, and repay obligations. This component supports funding preparation by presenting the numbers in a lender-friendly structure, making it easier to explain the financial plan and answer common questions during financing discussions.
Revenue Breakdown
The revenue breakdown component gives users a more detailed view of how the bakery generates sales across different streams. Rather than looking only at total revenue, users can separate income by categories such as food dine-in, beverage dine-in, takeout, delivery, catering, wholesale, or other custom revenue lines that fit the specific bakery concept. This helps users understand which parts of the business contribute the most to sales and which streams may offer higher margins or growth potential. Inputs may include sales mix percentages, category pricing assumptions, customer volume, average order value, channel growth rates, and changes in customer behavior over time. The outputs help users see how revenue composition changes across the forecast period and how shifts in the mix may affect profitability. For example, a higher beverage share may improve margins, while delivery sales may increase revenue but add platform fees or packaging costs. This section is useful for pricing strategy, marketing priorities, menu planning, staffing decisions, and investor communication because it explains the source of revenue rather than presenting a single top-line number.
KPI Dashboard
The KPI dashboard provides a focused view of the bakery’s most important performance metrics and benchmarks. While financial statements show the broader results, key performance indicators help users understand operational health and identify what needs attention. For a bakery, relevant KPIs may include revenue growth, gross margin, EBITDA margin, average check size, sales per customer, cash balance, payroll as a percentage of revenue, cost of goods sold percentage, break-even progress, return on equity, and other efficiency or profitability measures. The dashboard can also support benchmark comparisons so users can evaluate whether assumptions are reasonable for a food and beverage business. This is useful for founders who want to track business performance over time, consultants who need to summarize the model for clients, and stakeholders who want a quick read on financial strength. By turning detailed projections into practical indicators, the KPI dashboard helps users make better decisions about pricing, staffing, purchasing, marketing, and expansion timing.
Startup Cost Breakdown
The startup cost breakdown section helps users estimate the initial investment required to open or prepare the bakery for operations. A bakery often requires significant upfront spending before revenue begins, including kitchen equipment, ovens, refrigeration, display cases, smallwares, dining room furniture, décor, signage, point-of-sale systems, licenses, deposits, leasehold improvements, HVAC or ventilation work, initial inventory, pre-opening payroll, marketing, professional fees, and working capital reserves. This component allows users to organize those costs into a clear budget and adjust each line item to match the scale and concept of the bakery. The outputs help estimate total startup capital required, the timing of pre-opening cash needs, and the amount of owner investment, loan proceeds, or outside funding that may be necessary. This is useful for avoiding undercapitalization, preparing lender requests, negotiating investor contributions, and deciding whether the planned opening budget is realistic. A detailed startup cost view also helps users compare launch options, such as a small retail bakery, a larger dine-in bakery, or a concept with catering and delivery from the beginning.
Cash Flow Forecast
The cash flow forecast component helps users understand how money moves through the bakery over time and whether the business can maintain enough liquidity to operate comfortably. Profitability is important, but a bakery can still face cash pressure if startup spending is high, sales ramp up slowly, inventory purchases are mistimed, payroll grows too quickly, debt payments begin early, or working capital needs are underestimated. This section uses revenue projections, cost of goods sold, payroll, operating expenses, capital expenditures, financing assumptions, taxes, and other cash inflows and outflows to estimate monthly and annual cash balances. The outputs help users identify potential cash shortfalls, evaluate whether additional funding is needed, and determine how much reserve capital should be maintained. For lenders and investors, the cash flow forecast provides evidence that the bakery can manage obligations and remain financially stable. For owners, it supports practical decisions about hiring, inventory planning, equipment purchases, marketing spend, supplier terms, and expansion timing.
File types:
Excel – Single-User: .xlsx
Excel – Multi-User: .xlsx
Similar ProductsOther customers were also interested in...


 HenrySheykin
Grocery Store Financial Model Excel Template
The Grocery Store Financial Model helps entrepreneurs, founders, consultants, analysts, and retail b... Read more
Pizzeria Financial Model Excel Template
The Pizza Restaurant Financial Model Template helps entrepreneurs, restaurant owners, consultants, a... Read more
Candy Store Financial Model Excel Template
The Candy Store Financial Model helps entrepreneurs and planners turn a retail confectionery concept... Read more
Clothing Store Financial Model Excel Template
The Clothing Store Financial Model helps turn a retail apparel concept into a structured financial f... Read more

Food Truck Financial Model Excel Template
The Food Truck Financial Model helps entrepreneurs, founders, business owners, consultants, and anal... Read more
Confectionery Shop Financial Model Excel Template
The Confectionery Shop Financial Model helps turn a candy shop, sweet shop, dessert retail concept, ... Read more
 Pushkar
BAKERY – 3 Statement Financial Model with 5 ...
This Bakery Business Plan Model is a perfect tool for a financial feasibility study on launching a B... Read more
Gift Shop Financial Model Excel Template
The Gift Shop Financial Model helps users build a structured financial forecast for a retail gift st... Read more
Flower Shop Financial Model Excel Template
The Flower Shop Financial Model helps entrepreneurs, florists, business owners, consultants, and ana... Read more
Coffee Shop Financial Model Excel Template
The Coffee Shop Financial Model helps entrepreneurs, founders, business owners, consultants, and ana... Read more
Reviews
 Powerful Financial models
After working on the model I found it very powerful, comprehensive, and integrated.
2301 of 4666 people found this review helpful.
Help other customers find the most helpful reviews
Did you find this review helpful?
You must log in to submit a review.