
0 ITEMS

10 Lessons from Financial Modeling Case Studies

Real Businesses Use Financial Models to Plan, Raise Funds, and Invest
Over the years, our financial modeling team at eFinancialModels has built hundreds of custom financial models for founders, project developers, fund managers and corporate teams. Recently we reviewed a number of these projects, wrote them up as financial modeling case studies, and asked one question: what did we learn that applies beyond the single project?
The answer is the ten lessons in this article. Each lesson is explained with examples from the case studies, so you can see how it works in a real model and read the full case study when it is close to your own plan. Client names are withheld, and every chart and worked example uses illustrative values, not client data.
Key Takeaways
- Value drivers: every business has a few assumptions that move the result most, and they differ from one business to the next.
- Volume: a business can only sell what it can source, produce and place with customers, so contracts and capacity belong in the volume forecast.
- Unit economics: profit per bottle, per tonne or per event shows where the margin is made before the totals hide it.
- Timing: the same sale price earns a very different return when the cash comes back two years later.
- Working capital: growth ties up cash in inventory and receivables, so a model needs a balance sheet and a cash flow statement, not only a profit forecast.
- Profitable growth: growth creates value only when customer lifetime value clearly exceeds customer acquisition cost.
- Return breakdown: splitting a return into its sources shows which factors add to the net yield and which reduce it.
- Risk: where success is uncertain, as in biotech, probabilities belong in the projected cash flows.
- Scenarios: worst, base and best cases show what happens when assumptions miss and what the fallback is.
- Transparency: disclosed calculations and explained assumptions move the discussion to the plausibility of the plan.
The Case Studies Behind These Lessons
| Renewable energy Biogas plant Green hydrogen Solar park valuation | Manufacturing Battery recycling | Life sciences Biotech fundraising | Real estate Airbnb building Distressed real estate fund |
| Oil and gas Gas well project | Food and beverage Beverage plant Gin distillery Product rollout | Online and apps Subscription community app Nightlife events app | Private debt Private debt fund |
1. A Few Value Drivers Decide the Result of Every Business
A value driver is an input of the financial model that moves its result, such as the internal rate of return (IRR), the investor return or the valuation. A model has dozens of inputs, but only a few are key value drivers: the assumptions where a change moves the result the most. In every model we build, identifying them is one of the first tasks, because they show where management attention, due diligence and negotiations should focus.
Take the battery recycler. To find its value drivers, you first need to understand how the business earns its money. Used batteries come from collectors and manufacturers under sourcing contracts. The plant dismantles and shreds them into black mass, a material that contains lithium, cobalt, nickel and manganese. Buyers do not pay the full metal price for it. They pay a negotiated share of that price, the payable rate. Revenue is therefore metal content times payable rate times metal price.
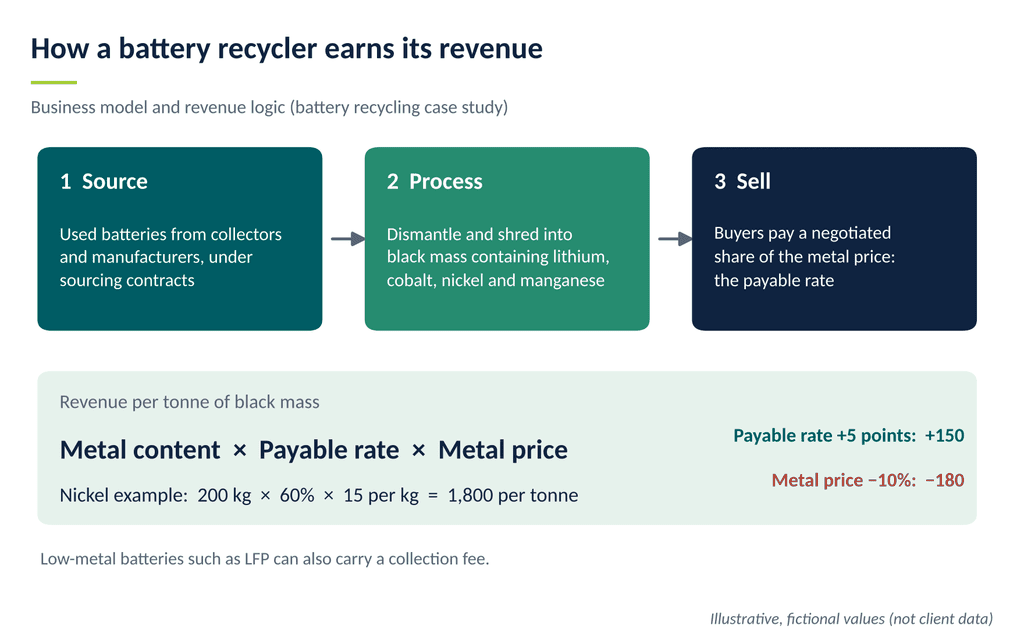
This logic changed the analysis. The first view of the business was metal prices times volumes, less unit costs. The model showed that payable rates and metal content set revenue per tonne just as much. In the nickel example of the case study, one tonne of black mass with 20% nickel earns 1,800 at a price of 15 per kg and a payable rate of 60%. Five points more on the payable rate add 150 per tonne. A nickel price that is 10% lower takes away 180. The metal price is set by the market, but the payable rate is negotiated, so the model shows management where it can act.
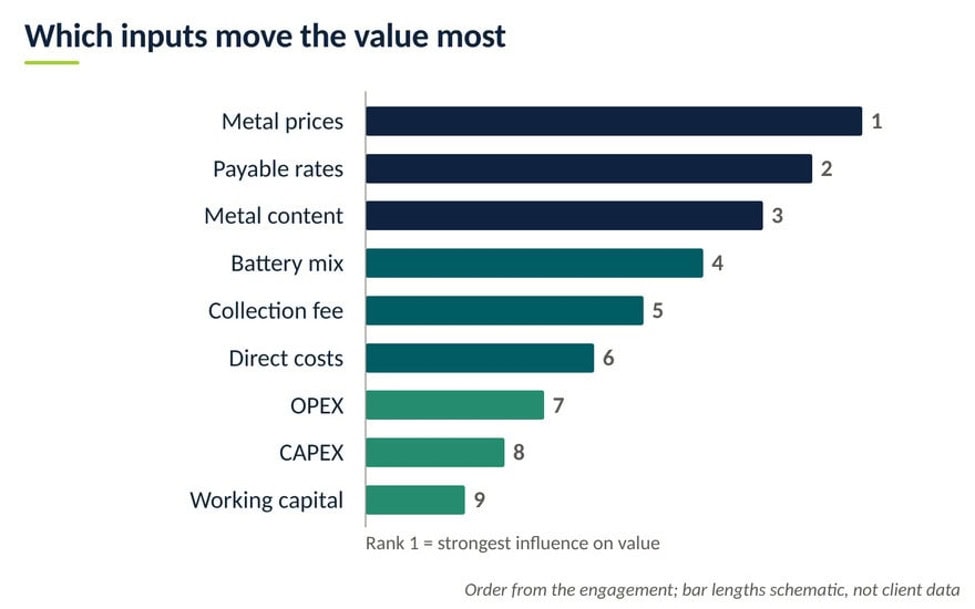
Other businesses have different key value drivers:
| Case Study | Key Value Drivers |
|---|---|
| Solar park valuation | Remaining years of the power purchase agreement (PPA) with its price, and the discount rate, the rate that converts future cash flows into today’s value |
| Gin distillery | Profit per bottle in each sales channel, and the export share |
| Biogas plant | Gas price, fixed or volatile, and the price mark-up for certified gas |
| Beverage plant | Revenue per bottle and the mix of sales channels |
| Green hydrogen | Tax credits and the cost of electricity |
| Product rollout | Marketing effectiveness and the payback period per location |
This is why value drivers cannot be copied from a template or from another industry. They come out of a careful analysis of the business model and its logic. We also go deeper than volume growth. Volume is often the largest number in a forecast, but it is a result, not a cause. A model should show why volumes are expected to grow. In the product rollout, the key question moved from how much volume the plan assumed to how well the marketing works at each location. Once the reasons behind the volume are clear, the key tasks for management are clear as well.
Case studies for this lesson: Battery recycling · Solar park valuation · Gin distillery · Biogas plant · Beverage plant · Green hydrogen · Product rollout
2. Contracts and Capacity Set the Limits of Volume Growth
A volume forecast that only applies a growth rate assumes that nothing stands in the way. In practice, a business cannot sell more in a period than it can source, produce and place with customers. Which of these limits applies depends on the business model, so volume has to be modeled differently from case to case. The case studies show five typical situations:
- Supply contracts limit volume. A battery recycler can only process the batteries it has sourced. The model links processing volumes to the sourcing contracts by battery type, so the utilization of each expansion phase traces back to contracted supply. Investors asked exactly this: which share of the installed capacity is covered by signed supply contracts?
- Production capacity limits volume. The beverage plant has a fixed capacity, so every bottle filled for another brand is a bottle not filled under its own brand. Sales can only grow as far as capacity allows, and the model tracks utilization against the sales plan. At the gin distillery, projected utilization shows when capacity must expand: the next funding round opens when the still runs near full use.
- The resource sets volume. In the biogas model, gas output follows the number of cows, their status and their feed. Each gas well ramps up to a peak and then declines. A green hydrogen plant depends on the hourly wind profile, and its electrolyzer can only use power up to its own capacity.
- Sales contracts secure the offtake. The solar park sells its power at a fixed price under a long-term PPA and at market prices afterwards. For green hydrogen, a shorter hydrogen purchase agreement leaves the later volume without a fixed price.
- Demand limits volume. The subscription app builds its paying subscribers from new cohorts and renewal rates. In the product rollout, volumes per location grow with traffic, competitors and the expected market share.
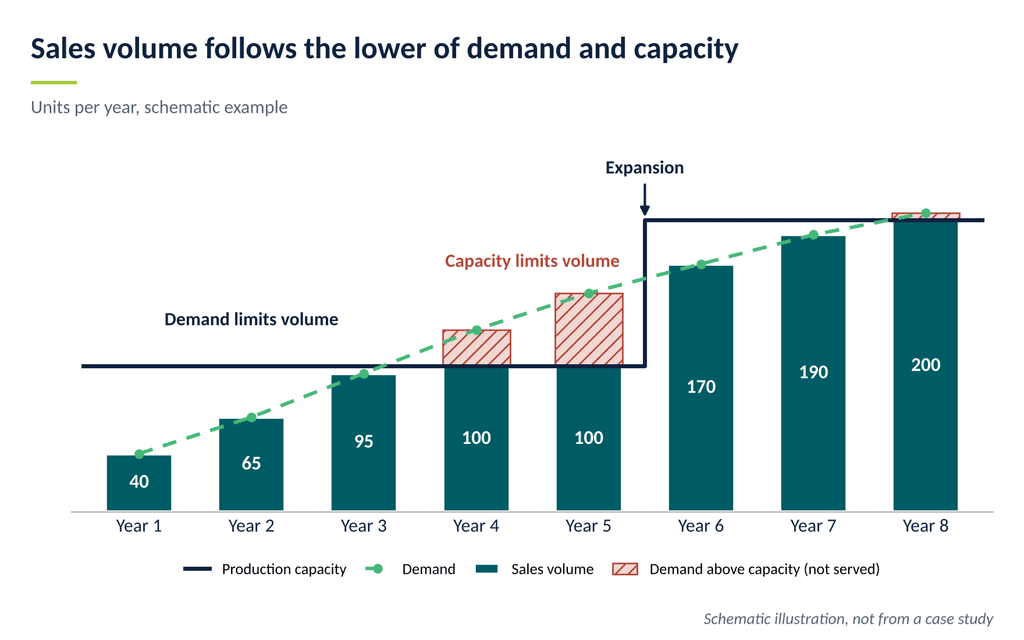
The chart shows the principle with two limits. In the first years, demand is below capacity, so demand sets the volume and marketing is the key task. In years 4 and 5, customers would buy more than the plant can produce, so capacity sets the volume and the expansion becomes the key task. A model that only applies a growth rate misses this switch, and with it the timing of the next investment.
The limit also matters for the size of an asset. In the gas well case study, output peaks early and then declines, so a processing plant sized to the peak flow would run at only 38% of its capacity on average. The hydrogen case shows the same trade-off: in its illustration, the lowest cost per kilogram comes from an electrolyzer sized at 75% of the wind farm’s capacity, even though 13% of the wind then stays unused.
Case studies for this lesson: Battery recycling · Beverage plant · Gin distillery · Biogas plant · Gas well project · Green hydrogen · Solar park valuation · Subscription community app · Product rollout
3. Unit Economics Show Where the Margin Is Made
Unit economics break revenue, cost and profit down to one unit of what the business sells: one bottle, one tonne, one event. This matters because totals hide differences. An income statement can show a healthy overall margin while one product or one sales channel earns almost nothing, and growing the wrong unit lowers the profit. A model that calculates per unit first and adds up afterwards shows where to grow and where to change price, cost or mix.
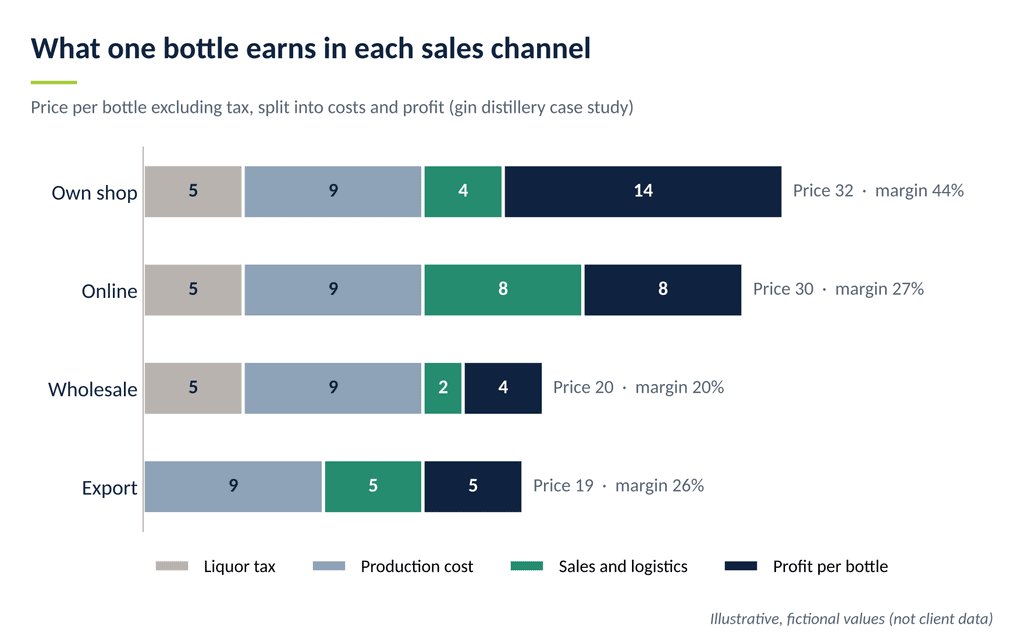
The gin distillery sells the same bottle through four channels. In the illustration of the case study, a bottle earns 14 in the own shop and 8 online, where sales and logistics cost more. Wholesale earns 4. Export earns 5 although its price is the lowest, because the customer often bears the liquor tax. The own shop has the highest profit per bottle but is limited in volume, while wholesale and export carry the volume that fills new capacity. The channel mix therefore decides the profit of the growth plan.
The same analysis runs through other case studies. At the beverage plant, the contribution per bottle of the own brand is 1.30 to 2.50, depending on the sales channel, against a co-packing fee of 0.30 per bottle, where the brand owner carries the product cost. The own brand also carries branding, marketing and sales costs and a slower start, so the fair comparison is what the same capacity earns on each route after these costs. For the battery recycler, profit per tonne differs by battery type, and low-metal batteries can fall below break-even without a collection fee. The nightlife events app case study works out the break-even of one hosted event: in its illustration, with revenue of 57 per guest, variable cost of 9 and fixed cost of 3,984, an event breaks even at 83 guests.
Case studies for this lesson: Gin distillery · Beverage plant · Battery recycling · Nightlife events app
4. When the Cash Comes Back Changes the Return
Investors measure their return with the internal rate of return (IRR): the annual rate of return at which the present value of all cash flows of an investment is zero. The IRR depends on when each cash flow occurs, and a profit forecast does not show this. A financial model therefore needs dated cash flows: what is paid when, and what comes back when.
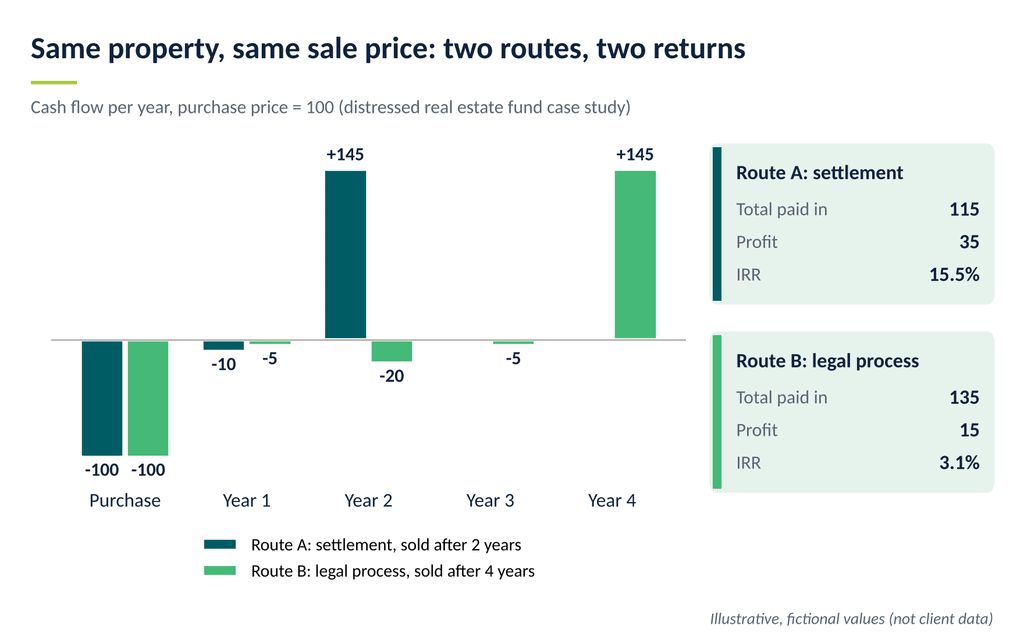
The distressed real estate fund shows the effect with one property on two routes. The property is bought at 100 and sold at 150 on either route, and running costs are 5 a year. On route A, the fund settles by negotiation: in year 1 it pays 10 (running costs of 5 plus the settlement of 5), and at the end of year 2 it pays another 5 of running costs and sells. On route B, it pays 15 for a legal process in year 2, on top of the running costs, and sells at the end of year 4. The sale price is identical, but the profit falls from 35 to 15 and the IRR from 15.5% to 3.1%. Most of this drop comes from time, not from cost: by our own calculation, route A would earn an IRR of only about 5% if its sale also took until year 4. The money multiple, 1.30 against 1.11, understates the difference because it ignores time.
Timing also matters within a year. The Airbnb building model works month by month, because fixed costs and loan payments continue every month while income follows the season. The thin low-season months set the size of the cash reserve. In the private debt fund, capital that is not lent earns nothing, so idle cash and early repayments lower the return even when no loan defaults, and a dividend can only be paid from cash actually received.
Case studies for this lesson: Distressed real estate fund · Airbnb building · Private debt fund
5. Growth Ties Up Cash in Net Working Capital
Net working capital is the cash tied up in day-to-day operations: inventory plus receivables from customers, less payables to suppliers. A growing business buys materials, builds stock and delivers to customers before those customers pay. Net working capital therefore grows with sales, and the cash for it has to come from somewhere. A company can be profitable and still run short of cash, because the profits it earns are reinvested in inventory and receivables.
This is why a profit forecast is not enough. A financial model needs a projected balance sheet and a cash flow statement next to the income statement. Only the three together show whether the business can fund its expansion from its own cash flow or needs to raise funding, how much, and when.
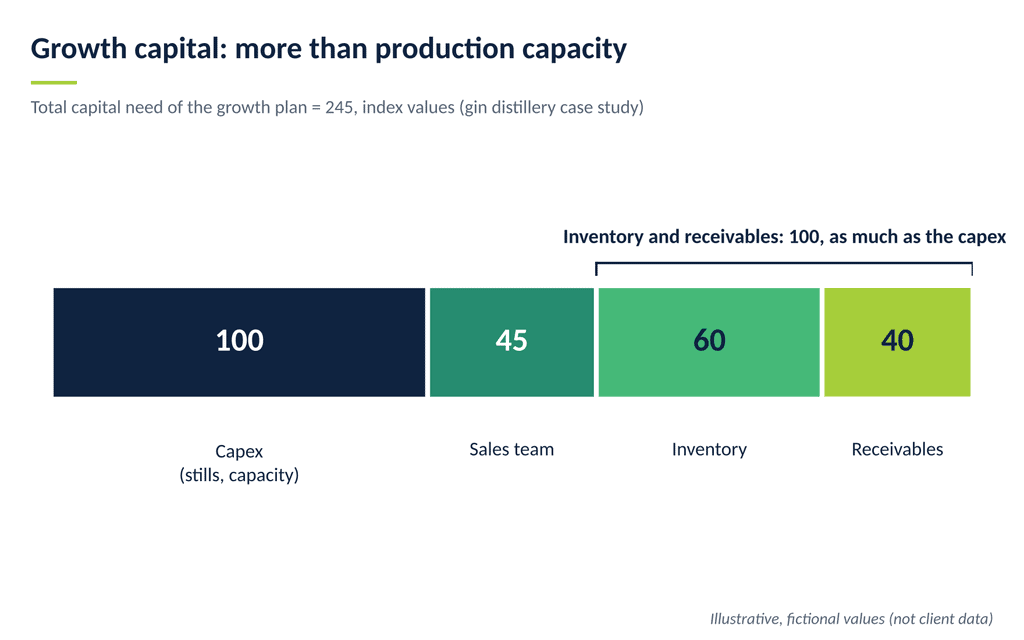
The gin distillery is a clear example. Spirit, botanicals and glass bottles are bought first, and liquor tax can fall due before customers pay. Finished bottles sit in inventory, and export customers pay later. The founders were surprised how capital-intensive growth is. In the illustration of the case study, the growth plan needs 245 in total: 100 for capex, 45 for the sales team, 60 for inventory and 40 for receivables. Inventory and receivables need as much capital as the production capacity itself.
The battery recycler faced the same effect: the plant ties up material before revenue arrives, so the funding need exceeds the capex, and the model forecasts receivables, inventory and payables to size it. Working capital is not the only cash that growth needs upfront. In the product rollout, each new location needs its marketing spend before it earns anything, and the profits of the open locations help to pay for the next ones. In the illustration with 12 locations, only the first three need outside funding of 300, and the remaining 900 comes from profits.
Case studies for this lesson: Gin distillery · Battery recycling · Product rollout
6. Growth Pays Only When Lifetime Value Exceeds Acquisition Cost
For businesses that buy their growth with marketing, such as apps and subscriptions, the central question is whether growth is profitable. Two figures answer it. Customer acquisition cost (CAC) is what it costs to win one paying customer. Customer lifetime value (CLV, also called LTV) is what this customer earns for the business over the time they stay. Growth creates value when CLV is clearly higher than CAC, and a financial model should show by how much. A common guideline for subscription businesses, from David Skok’s SaaS Metrics 2.0, is a CLV of more than three times CAC.
The founders of the subscription community app won their subscribers with paid ads and asked how much funding they should raise. The model answered a different question first. In the example of the case study, a subscriber on the monthly plan costs 40 to acquire and earns 47: 7 a month after app store fees, for an expected 6.7 months. That is about 1.2 times the acquisition cost. A subscriber on the yearly plan costs the same 40 to acquire and earns 84, or 2.1 times. Both plans stay below the guideline of three. In the worst case for the monthly plan, CAC rises to 50 and CLV falls to 35, so every new subscriber loses money.
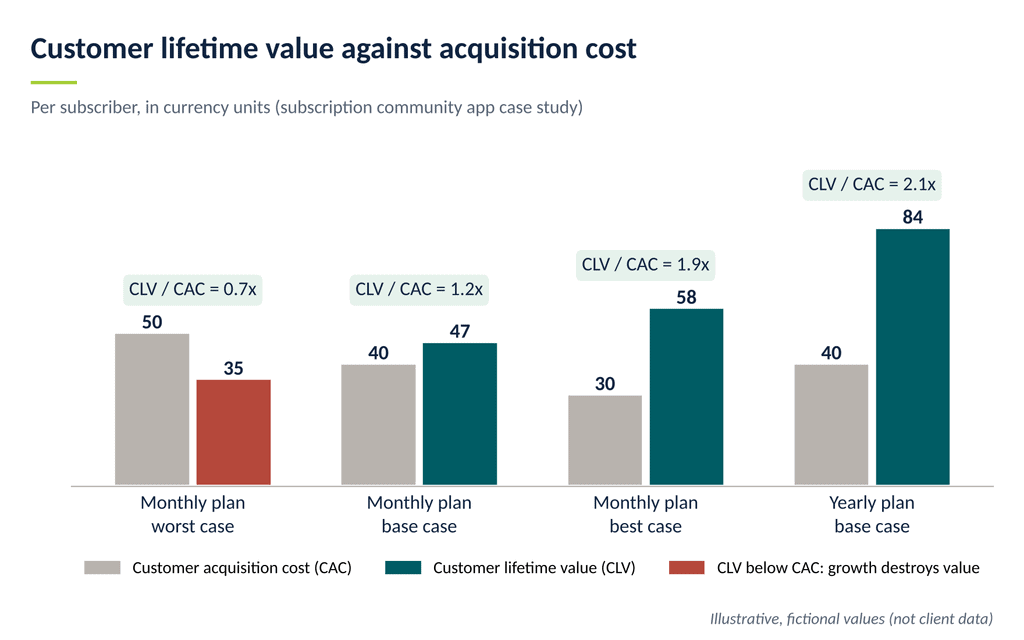
CLV in this example is revenue after app store fees times the expected number of periods. It still has to cover the indirect costs of the business, so a ratio just above 1 is not enough. For the founders, the funding question became a question of which lever to pull first: bring CAC down and CLV up. Bootstrapping turned out to be the preferred option, and fundraising stays an option once the numbers per subscriber work. Funding speeds up growth. It does not turn unprofitable growth into profitable growth.
Case studies for this lesson: Subscription community app
7. A Return Breakdown Shows Where the Yield Comes From
A single return figure says little about how it comes about. A return breakdown splits the figure into its sources and shows how much each factor adds or takes away. It tells management which factors to work on, and it tells investors how robust the return is.
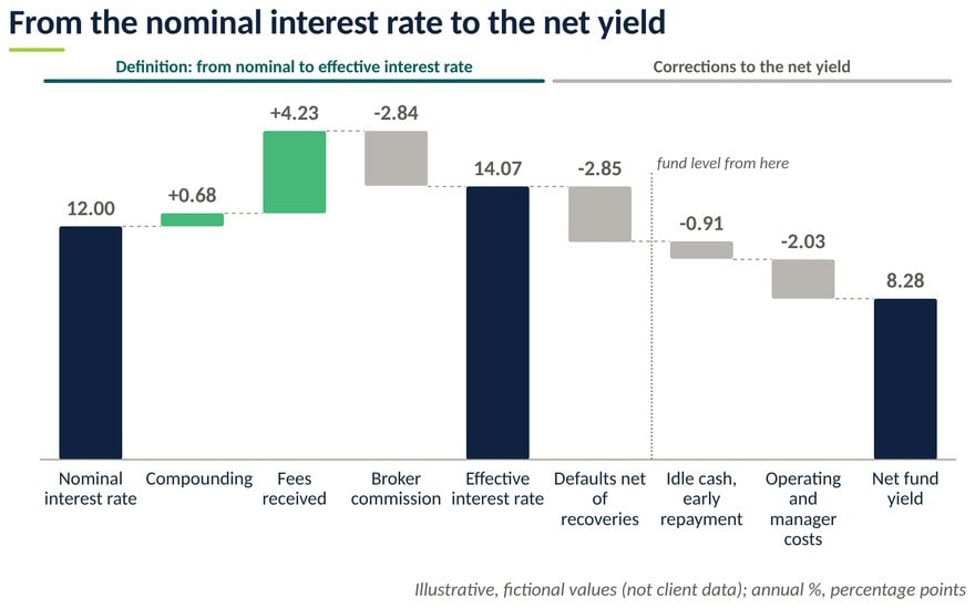
The private debt fund lends to small and medium-sized companies for a few months at a time. In the illustration of the case study, the loan agreement states a nominal interest rate of 12.00%. Compounding adds 0.68 points and fees received add 4.23, while the broker commission takes away 2.84. The result is an effective interest rate of 14.07%, the IRR of the loan’s cash flows, on which loan products are compared. At fund level, defaults net of recoveries (2.85), idle cash and early repayments (0.91), and operating and manager costs (2.03) reduce it to a net fund yield of 8.28%. Investors see at a glance that fees are worth more than a third of the nominal rate, and that defaults and costs together take away almost five points.
The same idea works at other levels. In the distressed real estate fund, five deals of 100 each are expected to return 560, a multiple of 1.12. The breakdown by deal shows that two of them lose money, and that the other three return 1.33. In the green hydrogen model, a transfer price for the power splits the project return between the wind farm and the hydrogen plant. The transfer price only divides a fixed total, but the split shows whether the hydrogen plant adds return on top of a wind farm that simply sells its power.
Case studies for this lesson: Private debt fund · Distressed real estate fund · Green hydrogen
8. High-Risk Projects Need Probabilities in the Cash Flows
In most businesses, risk is tested with scenarios. In some, the main risk is a yes-or-no outcome: a drug candidate clears a development stage, or the program stops. For pharma and biotech companies, this risk is so significant that a forecast which assumes success at every stage overstates the value several times over. Here, probabilities belong in the projected cash flows. This is the logic of a risk-adjusted net present value (rNPV): the value today of the expected future cash flows, each weighted by its probability.
In the biotech model, each program carries its own chance of success per stage as a visible input. Revenue, cost and capex are weighted by these chances and shown next to the full-likelihood view. In the simplified illustration of the case study, each program’s value is multiplied by its cumulative chance of success. Program C has the largest value if every stage succeeds (100). It still has four stages to clear, with a cumulative chance of 0.25, so its risk-adjusted value is 25. Program B is worth 72 at full likelihood and has a cumulative chance of 0.39, which gives 28. The risk-adjusted view changes which program is worth the most.
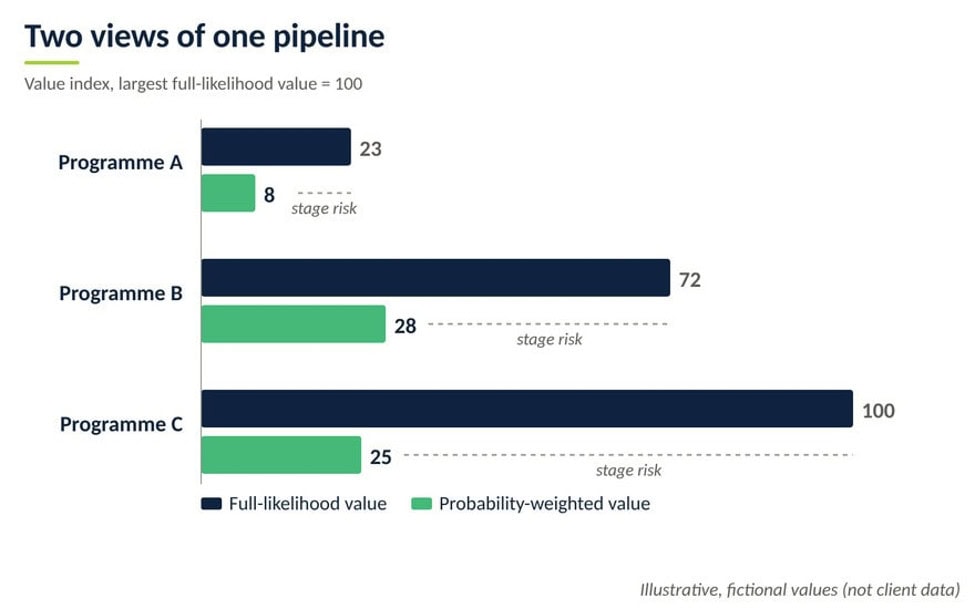
One caution applies. Probabilities value the pipeline, but they do not reduce the cash a committed stage needs. A stage that has started is paid before its result is known, so the cash plan funds committed stages in full and tests the runway with scenarios, such as a stage that slips or a funding round that closes later. Not every uncertain project needs probabilities either. The wells of the gas well project were considered fairly certain, so worst, base and best cases cover the spread in well performance.
Case studies for this lesson: Biotech fundraising · Gas well project
9. Scenarios Show What Happens When Assumptions Miss
No forecast turns out exactly as planned. Investors and lenders therefore want to see a range: what happens to the return and to cash if key assumptions miss, and what management does then. Scenario analysis answers this. A scenario changes one or several linked assumptions and recalculates the whole model, usually as a worst, base and best case. Three things make the scenarios in our case studies credible:
- They are built on the key value drivers. For the biogas plant, the worst case is uncertified gas sold at the market price: a price of 60 against an all-in cost of 100 per unit. The base case is certified gas at the market price (145), and the best case is certified gas on a fixed-price contract (165).
- The worst case is a real fallback, not an arbitrary discount. For the Airbnb building, the downside case is long-term letting, and it is run first. In the gas well project, a processing plant that does not earn its cost in the worst case is switched off and the gas is sold.
- They are internally consistent. The gas model moves linked prices together, because one price tested alone creates cases that the markets would never produce.
The solar park valuation shows how scenarios make a value easier to judge. Revenue is fixed for the PPA years and follows a low, base or high market price path afterwards. Depending on the path, 7% (low), 12% (base) or 20% (high) of the value rests on market prices. A buyer sees how much of the value is contracted and how much depends on the market.
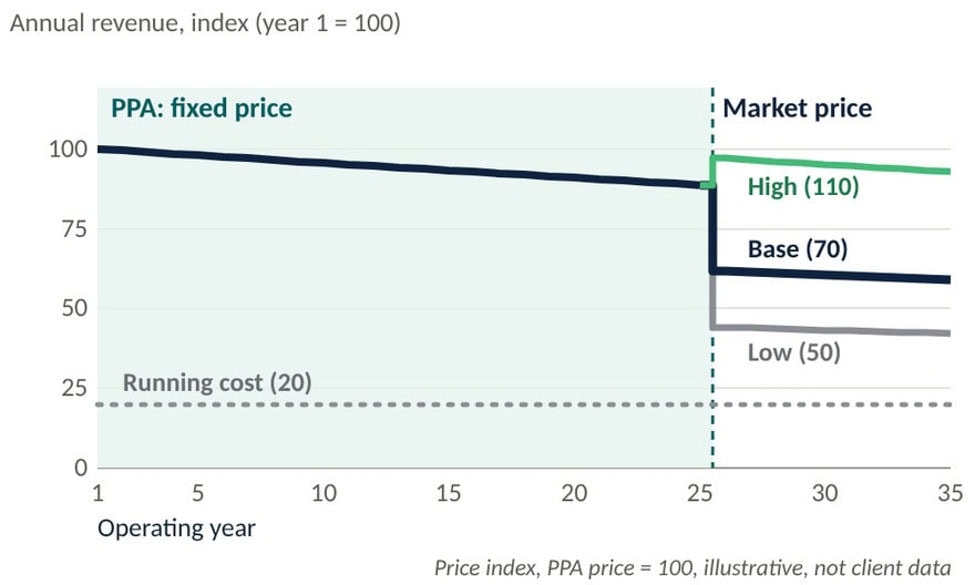
Scenarios show how a case could work out. They do not prove the assumptions behind it, which leads to the last lesson.
Case studies for this lesson: Biogas plant · Airbnb building · Gas well project · Solar park valuation
10. Transparent Assumptions Earn Trust
A financial model is read by people who did not build it: investors, lenders, buyers and sometimes a tax authority. They can only rely on a model they can follow. This requires two things. All calculations are disclosed, with no hidden steps and no hard-coded results. And assumptions are clearly separated from calculations, and each assumption is explained.
When the mechanics are transparent, the discussion changes. Readers stop asking whether the model calculates correctly and start discussing whether the assumptions are plausible. This is the discussion that matters. The better an assumption can be backed up, with contracts, historical data or benchmarks, the stronger the explanatory power of the financial model becomes.
The case studies show what this looks like in practice. In the solar park valuation for a tax authority, each parameter was set as an independent party would set it, so the value can be explained line by line. As the case study puts it: “A valuation is only as strong as its weakest explained input.” In the Airbnb building model, check rows roll into a master check, so an error shows at once and every investor reads the same numbers. The green hydrogen model runs every project through the same structure, which makes projects comparable. The battery recycler checked its unit costs against industry benchmarks. And the subscription app compares actual results with the forecast in a rolling forecast, which turns early assumptions into evidence.
Transparency also means showing an unwelcome result. For the nightlife events app, putting the plan into numbers showed how vague and unproven it still was. The founders could see this before the investor pitch, not during it.
Case studies for this lesson: Solar park valuation · Airbnb building · Green hydrogen · Battery recycling · Subscription community app · Nightlife events app
Browse Our Financial Modeling Case Studies
Every case study follows the same path: the client and the decision, why it was hard to model, the turning point, what drives the value, and the lessons and questions for anyone in a similar position. Every case study comes with a free PDF download, no email required.

Biogas Financial Model Case Study
Feasibility · Deal structure
A US developer needed to know whether a plant fed with dairy manure would pay off, and under which deal terms.

Green Hydrogen Financial Model Case Study
Project screening
A multinational’s technology team compares all its wind-to-hydrogen projects on the same basis with one model.

Solar Park Valuation Case Study
Valuation
A developer prepared a fair market valuation of an operating solar park to answer a tax authority.

Gas Well Project Financial Model Case Study
Investor pitch
A developer compared four uses of its gas (direct sale, power, processing and Bitcoin mining) before meeting investors.

Airbnb Building Acquisition Financial Model Case Study
Acquisition
A monthly model shows what a short-term rental building earns on its all-in cost, with seasonality and a downside case.

Distressed Real Estate Fund Financial Model Case Study
Fund structuring
A fund judged every property deal on its own and showed investors the range of returns and the profit split.

Battery Recycling Financial Model Case Study
Scale-up funding
A European battery recycler prepared for talks with existing and new investors about its scale-up.

Beverage Manufacturing Financial Model Case Study
Start-up plan
A pre-revenue founder found out where the margin of a bottling plant is made: own brand or co-packing.

Gin Distillery Financial Model Case Study
Growth funding · Exit
A gin distillery planned three funding rounds and saw what they cost in capital and founder equity.

Private Debt Fund Financial Model Case Study
Fund launch
A start-up with no track record showed investors what a fund of short-term loans to small and medium-sized companies would earn.

Biotech Financial Model Case Study
Fundraising
The founder of a development-stage biotech planned the next funding round on probabilities of success.

Community App Financial Model Case Study
Unit economics
A cohort model showed the founders of a subscription app which lever to pull before raising money.

Nightlife Events App Financial Model Case Study
Pre-pilot plan
The founders of a nightlife events app found out what their plan depended on before the pilot went live.

Product Rollout Financial Model Case Study
Growth strategy · Multi-site rollout
A food entrepreneur used the payback period per location to plan a rollout funded largely by its own profits.
Build Your Own Model in Three Steps
- Read the case study closest to your plan. Note the drivers that decided the result and the investor questions listed at the end. Check that your plan answers each one.
- Start from an expert-built template. Pick a template for your industry, enter your own assumptions, starting with the few drivers that decide the result, and test worst, base, and best cases before you meet investors or lenders.
- Need something specific? Our financial modeling experts build custom models around your plan, the same way they built the models in these case studies.
Conclusion: Turn These Lessons Into Your Own Financial Model
The models in these case studies were built for very different businesses, but the lessons repeat. Find the few value drivers that decide the result. Model volume from what limits it. Know what one unit earns, follow the cash and the working capital, and break the return into its sources. Show the range of outcomes, and keep every assumption visible and explained. A model built this way answers the questions of investors and lenders before they ask them.
If you want to apply these lessons, start with a financial model template for your industry:
- Renewable Energy: All Renewable Energy Templates · Solar · Biogas · Hydrogen · Wind
- Oil & Gas: Oil & Gas Financial Model Templates
- Real Estate: All Real Estate Templates · Airbnb
- Manufacturing & Product Rollout: Manufacturing Financial Model Templates
- Distillery: Distillery Financial Model Templates
- Private Debt & Financial Services: Financial Services Templates · Debt Fund
- Life Sciences: Life Science Financial Model Templates
- Online & IT: Information Technology Templates · Mobile App · SaaS
If your plan needs a structure that no template offers, contact our team for a custom financial model built around your plan.
Frequently Asked Questions
What is a financial model case study?
A financial model case study follows one business through a real decision, such as a feasibility check, a fundraising round, a fund launch or a valuation. It explains how the financial model was built for that decision and what it showed: the key value drivers, the scenarios, the turning point of the analysis and the questions that investors or lenders asked. The case studies on this page come from custom financial modeling projects of eFinancialModels.
Are these case studies based on real businesses?
Yes. Each case study is based on a real client project of the eFinancialModels financial modeling team, for example a battery recycler, a gin distillery, a solar park, a private debt fund and a biotech company. The clients are not named, identifying details are left out, and every chart and worked example uses illustrative values instead of client data. The modeling questions, the structure of the models and the lessons are the real ones.
What is a value driver in a financial model?
A value driver is an input of the financial model that moves its result, such as the IRR, the investor return or the valuation. The key value drivers are the few assumptions where a change moves the result the most. Every business has its own. For a battery recycler they are metal prices, payable rates and metal content. For a solar park they are the remaining PPA years with their price and the discount rate. A sensitivity analysis, which changes one input at a time and measures the effect on the result, shows which inputs they are.
How do you forecast sales volume in a financial model?
Start from what limits the volume, not from a growth rate. In each period a business cannot sell more than it can source, produce and place with customers. A good model therefore builds volume from its drivers, such as customers, locations, contracts or resource output, and then checks it against production capacity and supply or sales contracts. The lower figure is the volume the model should use, and it shows when the next expansion is needed.
What are unit economics?
Unit economics show the revenue, the cost and the profit of one unit of what a business sells: one bottle, one tonne, one subscriber or one event. They matter because totals hide differences between products and sales channels. In the gin distillery case study, the same bottle earns 14 in the own shop and 4 in wholesale in the illustration. A model that calculates per unit first shows where growth adds profit and where price, cost or mix should change.
Why does a financial model need a balance sheet and a cash flow statement?
Because profit is not cash. A growing business ties up cash in inventory and receivables, and it pays for capex before the revenue arrives. An income statement alone does not show this. Only a projected balance sheet and cash flow statement next to the income statement show how much cash the growth plan needs, whether the business can fund it from its own cash flow, and how much funding it has to raise and when.
What is a good LTV to CAC ratio?
Customer lifetime value (LTV or CLV) should be clearly higher than customer acquisition cost (CAC). A common guideline for subscription businesses is an LTV of more than three times CAC. A ratio close to 1 means that a new customer barely pays back the cost of winning them, before any indirect costs. In the community app case study, the illustration shows 1.2 for the monthly plan and 2.1 for the yearly plan, so the founders improved these figures before raising funds.
When should a financial model use probabilities instead of scenarios?
Use probabilities when the main risk is a yes-or-no outcome that decides whether later cash flows happen at all, as in pharma and biotech development. There, each stage has a chance of success, and the value of a program is its cash flows weighted by these chances (risk-adjusted NPV). Use scenarios when the outcome is a range, such as prices, volumes or costs. Many models need both: probabilities for the value, and scenarios for the cash plan and the runway.
What makes a financial model credible to investors and lenders?
Transparency. Investors and lenders rely on a model they can follow: all calculations are visible, assumptions are separated from calculations, and each assumption is explained and backed up with contracts, historical data or benchmarks. Check rows show that the statements reconcile. Scenarios show what happens when assumptions miss. When the mechanics are clear, the discussion moves from whether the model is right to whether the assumptions are plausible, which is the discussion that matters.
Which case study should I read first?
Start with the case study that is closest to your own decision. The overview at the top of this page groups the case studies by industry, and the cards above describe each one in a sentence. If you plan to raise funding for a plant, read battery recycling or the gin distillery. For a fund, read the private debt fund or the distressed real estate fund. For an app or a start-up, read the community app or the biotech case study.
Can I get a financial model like the ones in these case studies?
Yes, in two ways. You can start from an expert-built financial model template for your industry, enter your own assumptions and test your scenarios. eFinancialModels offers templates for renewable energy, real estate, manufacturing, financial services, life sciences, apps and many other industries. If your plan needs a structure that no template offers, the financial modeling team builds a custom model around your plan, the same way it built the models in these case studies.