
0 ITEMS

Battery Recycling Financial Model Case Study

Key Takeaways
- An early-revenue recycler with its own process technology needed a financial model to raise capital for its scale-up.
- What mattered: contracts behind the capacity, expected returns, the risk of rising costs and the capital each ramp-up phase needs, answered in one integrated model before the investor talks.
- Turning point: the model moved from metal prices times volumes to the negotiated terms that set revenue per tonne: payable rates and metal content.
- Outcome: a presentation-ready model and draft pitch deck for talks with existing and new investors.
PDF1.0 MB
Free download · No email required
Download the Battery Recycling Financial Model Case Study
✓ Model structure✓ Key assumptions✓ Results and takeaways
Investors in a recycling plant want to know what return to expect, where the risks lie and what the scale-up costs. One question comes first: is there contracted material to fill the plant? Then come the follow-ups: what do the contracts pay per metal, and how much cash does the plant tie up? A financial model is the preparation for that negotiation, and every answer needs to be in the numbers before the meeting starts.
The Client and the Decision
The client is an early-revenue battery recycler in Europe with its own process technology. The scale-up needed substantial new capital from existing and new investors at the same time. The decision on the table was how to present the scale-up so that investors would fund it. They pushed hardest on one point: supply contracts had to be in place to use the capacity the plant would install. The model had to show that phase by phase, then carry the case through returns, risk, working capital and valuation.
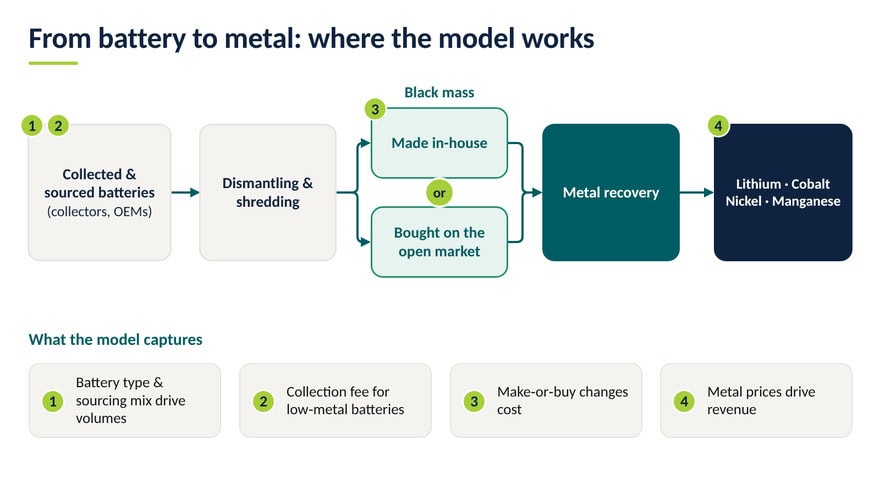
How battery recycling works. Used batteries come from collectors and manufacturers under sourcing contracts. Packs are dismantled and shredded into black mass, a powder containing metals such as lithium, cobalt, nickel and manganese. Black mass is also traded between companies, so a recycler can make it or buy it. Refining then recovers the metals, often as salts or other battery-grade materials. Each step changes volumes, cost or price, so the model follows the chain from battery to metal.
Why This Was Hard to Model
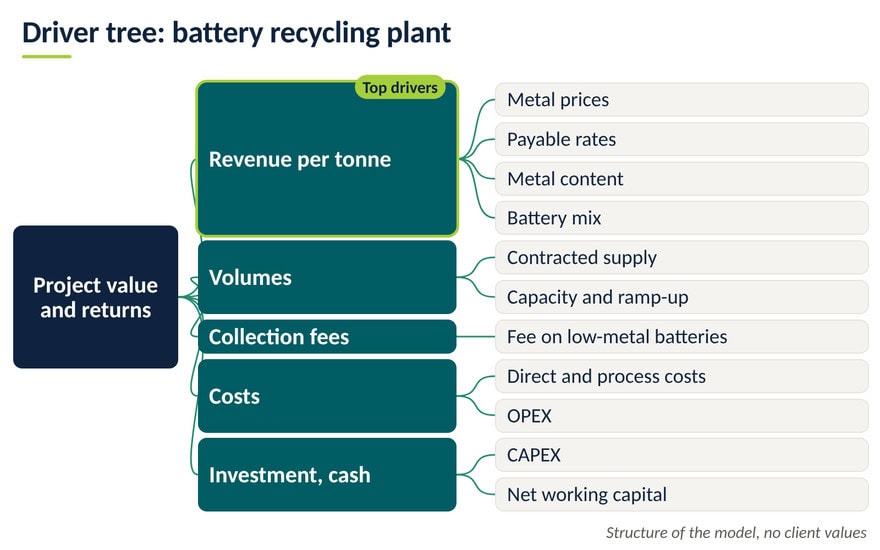
- Contracts that fill the installed capacity. Investors wanted to see the contracts behind each phase. Low-metal batteries also carry a collection fee, which changes any profit comparison between battery types. How we solved it: We linked processing volumes to the sourcing contracts by battery type, so the utilization of each phase traces back to contracted supply. We treated collection fees the same way everywhere, so battery types compare fairly.
- Revenue is metal content times payable rate times price. Each battery type contains different amounts of valuable metals. Buyers pay a negotiated share of the metal price, the payable rate, and metal prices are volatile, so one average revenue per tonne hides all three effects. How we solved it: We modeled recovered metal per battery type, applied the negotiated payable rates, and used price forecasts that carry the volatility.
- Returns, exit value and a high pre-money valuation. Investors want to know what they get back and when. The large capital requirement also led to a high pre-money valuation, which the founder had to justify. How we solved it: We modeled the investment structure and investor cash flows, estimated an exit value from comparable EV/EBITDA multiples, and prepared valuation considerations for purchase contracts and operating licenses.
- Scenarios for rising costs and mitigation. Cost increases are a key risk to the plan, and investors want to see how management would respond. How we solved it: We ran scenarios for rising costs and for mitigation measures, showing where the likely results lie.
- Ramp-up, capex and working capital. Each expansion step brings capital outlays and step costs. The plant also ties up material before revenue arrives, so the funding need exceeds the capex. How we solved it: We modeled each ramp-up phase with its own capex and costs, checked unit costs against industry benchmarks, and forecast receivables, inventory and payables to size the working capital.
- Make or buy the black mass. Black mass can be bought on the market or made in-house from collected batteries. Buying it makes the plant dependent on its suppliers. How we solved it: We modeled both routes side by side. Buying battery cells and processing them in-house proved cheaper and captures more of the value chain.
The Turning Point: From Price Times Volume to Negotiated Terms
We started from the usual logic of a recycling plan: metal prices times volumes, less unit costs. As the work went deeper, it became clear that the business was negotiating something more specific: payable rates and metal content, which set revenue per tonne, and process costs. We converted the model to those drivers. From then on, every negotiated term had its own line, showing what a change in a payable rate is worth and where the margin comes from.
What Drives the Value
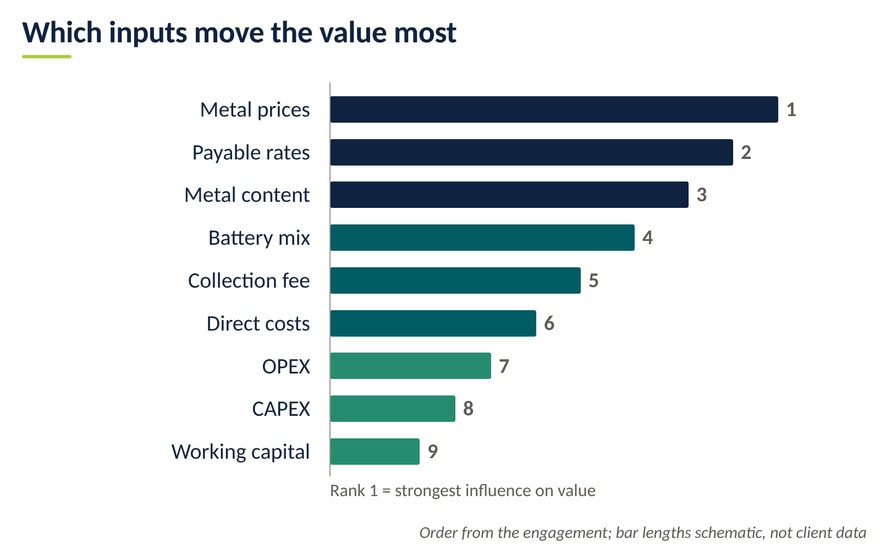
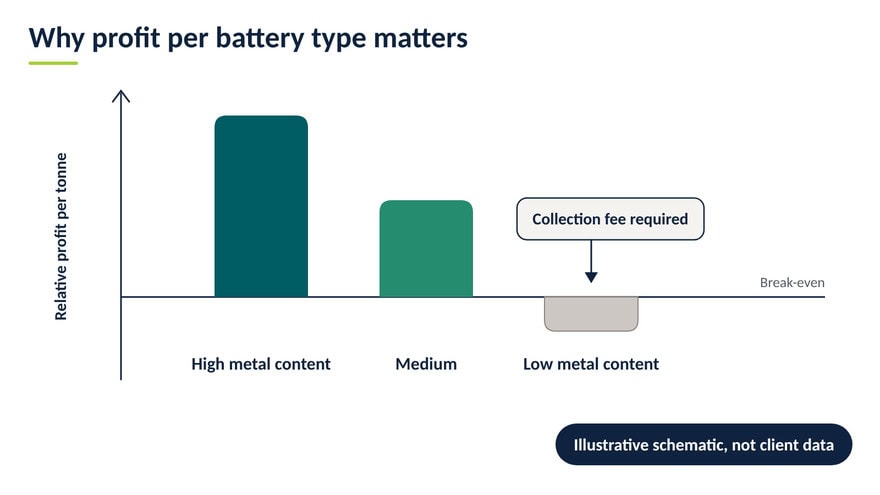
We ranked the drivers, from most to least influence on value: metal prices, payable rates, metal content, battery mix, collection fee, direct costs, OPEX, CAPEX and net working capital. The three inputs that set revenue per tonne outrank every cost line. Battery types also differ in what they earn: low-metal batteries can need a collection fee and fall below break-even, so the model shows profit by battery type.
A worked example shows why payable rates deserve their own line. The numbers below are fictional.
Worked example with fictional numbers: nickel value in one tonne of black mass
| Item | Value |
| Nickel content of the black mass | 20% = 200 kg |
| Nickel price (fictional, currency units) | 15 per kg |
| Payable rate agreed with the buyer | 60% |
| Nickel value paid per tonne | 200 x 15 x 60% = 1,800 |
| Effect of 5 points more on the payable rate (65%) | +150 per tonne |
| Effect of a 10% lower nickel price (13.50 per kg) | -180 per tonne |
In this example, a 5-point move in the payable rate is of a similar size to a 10% move in the metal price. The price is set by the market, the payable rate is negotiated, so it needs a line of its own. A model on average market prices shows what a plant could earn on paper. A model on the terms of each contract shows what it earns under the deals it negotiates, so each term can be tested first.
Scenarios: from one number to a range. The scenarios show how far the result can fall and how much management can protect.
Scenario logic (described without client values)
| Scenario | What changes | What it shows |
| Rising costs | Costs increase, no mitigation is applied | How far the result can fall |
| Base plan | Costs and prices as planned | The planned result, the reference for the other two |
| Rising costs with mitigation | Costs increase, mitigation measures are applied | How much of the result the measures protect |
How We Worked Together and the Result
We began with an in-depth discussion of the project, prepared with our own analysis of how battery recycling works and where the money is made. We then agreed the model structure and built it module by module, from revenue and costs to funding, returns and valuation. We discussed the model with the client many times, adjusted the scenarios as the investor discussion evolved, and delivered a ready-to-present model and a draft pitch deck. The funding round was ongoing at the time of writing. The founder has a ready-to-present model, built on the terms the business negotiates. It shows:
- revenue built from metal content, payable rates and metal prices per battery type;
- project and investor cash flows, investor returns and a likely exit valuation;
- a supported pre-money valuation and scenarios for rising costs and mitigation.
Lessons and Questions for Anyone Modeling a Battery Recycling Business
Three lessons.
- Model the terms you negotiate. Payable rates and metal content set revenue as much as metal prices do.
- Show the contracts behind the capacity. Investors look for contracted supply behind every phase of the ramp-up.
- Show a range, not one number. Scenarios for rising costs and mitigation show how far the result can move.
Questions investors ask before you build a battery recycling model.
- Which share of the installed capacity is covered by signed supply contracts?
- What happens to the return if costs rise, and which mitigation measures protect it?
- What return can investors expect, and how does it change with the exit year and exit multiple?
- How much capital does each ramp-up phase need, and when does the plant turn it into cash?
- What payable rate does each contract give per metal, and how is it reset?
- How much working capital does the plant tie up before revenue arrives?
- Is it cheaper to buy black mass or to make it from collected batteries?
- How does profit per tonne change with the battery mix and the collection fees?
Planning a similar project? Browse our Manufacturing financial models. For something specific, we build custom financial models. Write to us at [email protected].
FAQ
Short answers to the questions readers ask most often when they plan this type of model.
What is black mass?
Black mass is the dark powder produced when lithium-ion batteries are dismantled and shredded. It contains valuable battery metals such as nickel, cobalt, lithium and manganese, as well as graphite. It is also traded between companies, so a recycler can make it or buy it.
What is a payable rate?
A payable rate is the share of the metal price paid for the metal contained in a material such as black mass, set for each metal. At a payable rate of 60%, the seller receives 60% of the price for each kilogram of metal delivered. In this case the rates were negotiated, so the model treats them as a separate input.
What do investors check first in a battery recycling plan?
They first check whether the plant can be filled: signed supply contracts for each phase. After that come the expected return, what happens if costs rise, the capital each phase needs, working capital and valuation. A model that answers these in one place lets the founder meet the first question with numbers instead of promises.
Why model profit by battery type?
Battery types differ in metal content, and low-value batteries such as LFP can come with a gate (collection) fee. An average profit per tonne hides which batteries create value and which only fill the plant. Profit by battery type shows where the money is made.
Sources
Client details are anonymised to protect confidentiality. Charts, schematics and worked examples are illustrative and contain no client data.


