0 ITEMS

Financial Model Investors Want: The 5-Checkbox Framework

Investors want a financial model that ticks five boxes: unit economics that scale, transparent assumptions, a clear cash runway, scenario analysis and a team able to deliver the numbers. This guide defines each checkbox, shows how to build it step by step and applies them in a worked Excel example for an illustrative software startup.
Key Takeaways
- Unit economics come first: in the illustrative base case, lifetime value is 4.4 times acquisition cost, and acquisition cost is repaid in 7.6 months.
- Documented assumptions let an investor challenge every input, so each number carries a unit, a source type and a short rationale.
- Flat-burn runway is cash divided by monthly net burn; the illustrative base case shows 13.0 months, and the monthly model still holds cash at month 12.
- Three scenarios on one set of formulas expose the downside: the worst case repays acquisition cost in 14.0 months, above the 12-month SaaStr guideline.
- Team credibility completes the set, because investors back people who can deliver the forecast, not only the spreadsheet.
Investors check five boxes: unit economics, assumptions, runway, scenarios and team
Each checkbox answers one question an investor asks when opening a model. The framework assumes a recurring-revenue business raising equity; owners seeking bank debt, or running other business models, should confirm requirements with the lender or an accountant.
Checkbox 1: Unit economics that scale
Unit economics are the revenue and cost of serving one customer. In a software as a service (SaaS) business, lifetime value (LTV) is the gross profit, revenue minus the direct cost of serving the customer, that a customer generates before leaving, and customer acquisition cost (CAC) is the sales and marketing spend needed to win one customer. Professor Christina Wallace calls an LTV:CAC ratio of three or higher attractive (Harvard Business School Online, 2025). SaaStr says CAC payback, the months of gross profit needed to repay CAC, should be 12 months or less (SaaStr, 2025). Both are rules of thumb, not measured averages.
Checkbox 2: Assumption transparency and realism
Assumptions are the inputs a model takes as given, such as price, churn and spend. Churn is the share of customers lost each month. Investors read assumptions before outputs, so each input needs a value, a unit, a source type such as pilot data or founder estimate, and a rationale. Growth rates that rise without evidence read as hope, not a plan.
Checkbox 3: Cash runway and burn rate
Net burn is cash outflow minus cash inflow in a month. Flat-burn runway is cash on hand divided by net burn in the first forecast month, a shortcut that assumes burn stays flat. The cash-out month, read from a month-by-month model, is the month the balance turns negative, reported as beyond the horizon when that never happens within the modeled months. First Round Review describes 12 to 18 months of runway as a common rule of thumb, with 24 to 36 months in tighter markets (First Round Review, 2025). Investors interviewed by TechCrunch say a raise should leave 18 to 36 months of capital and the next raise should start with 9 to 12 months left (TechCrunch, 2023).
Checkbox 4: Scenario analysis and sensitivity testing
Scenario analysis runs a base, best and worst case through the same formulas. Sensitivity analysis, which changes one input at a time to measure its effect on the result, then shows which driver matters most, such as churn, price or acquisition cost.
Checkbox 5: Management team credibility
A spreadsheet cannot show whether founders can execute. Investors look for a track record, relevant domain experience and milestones already delivered, such as a shipped product or a signed pilot.
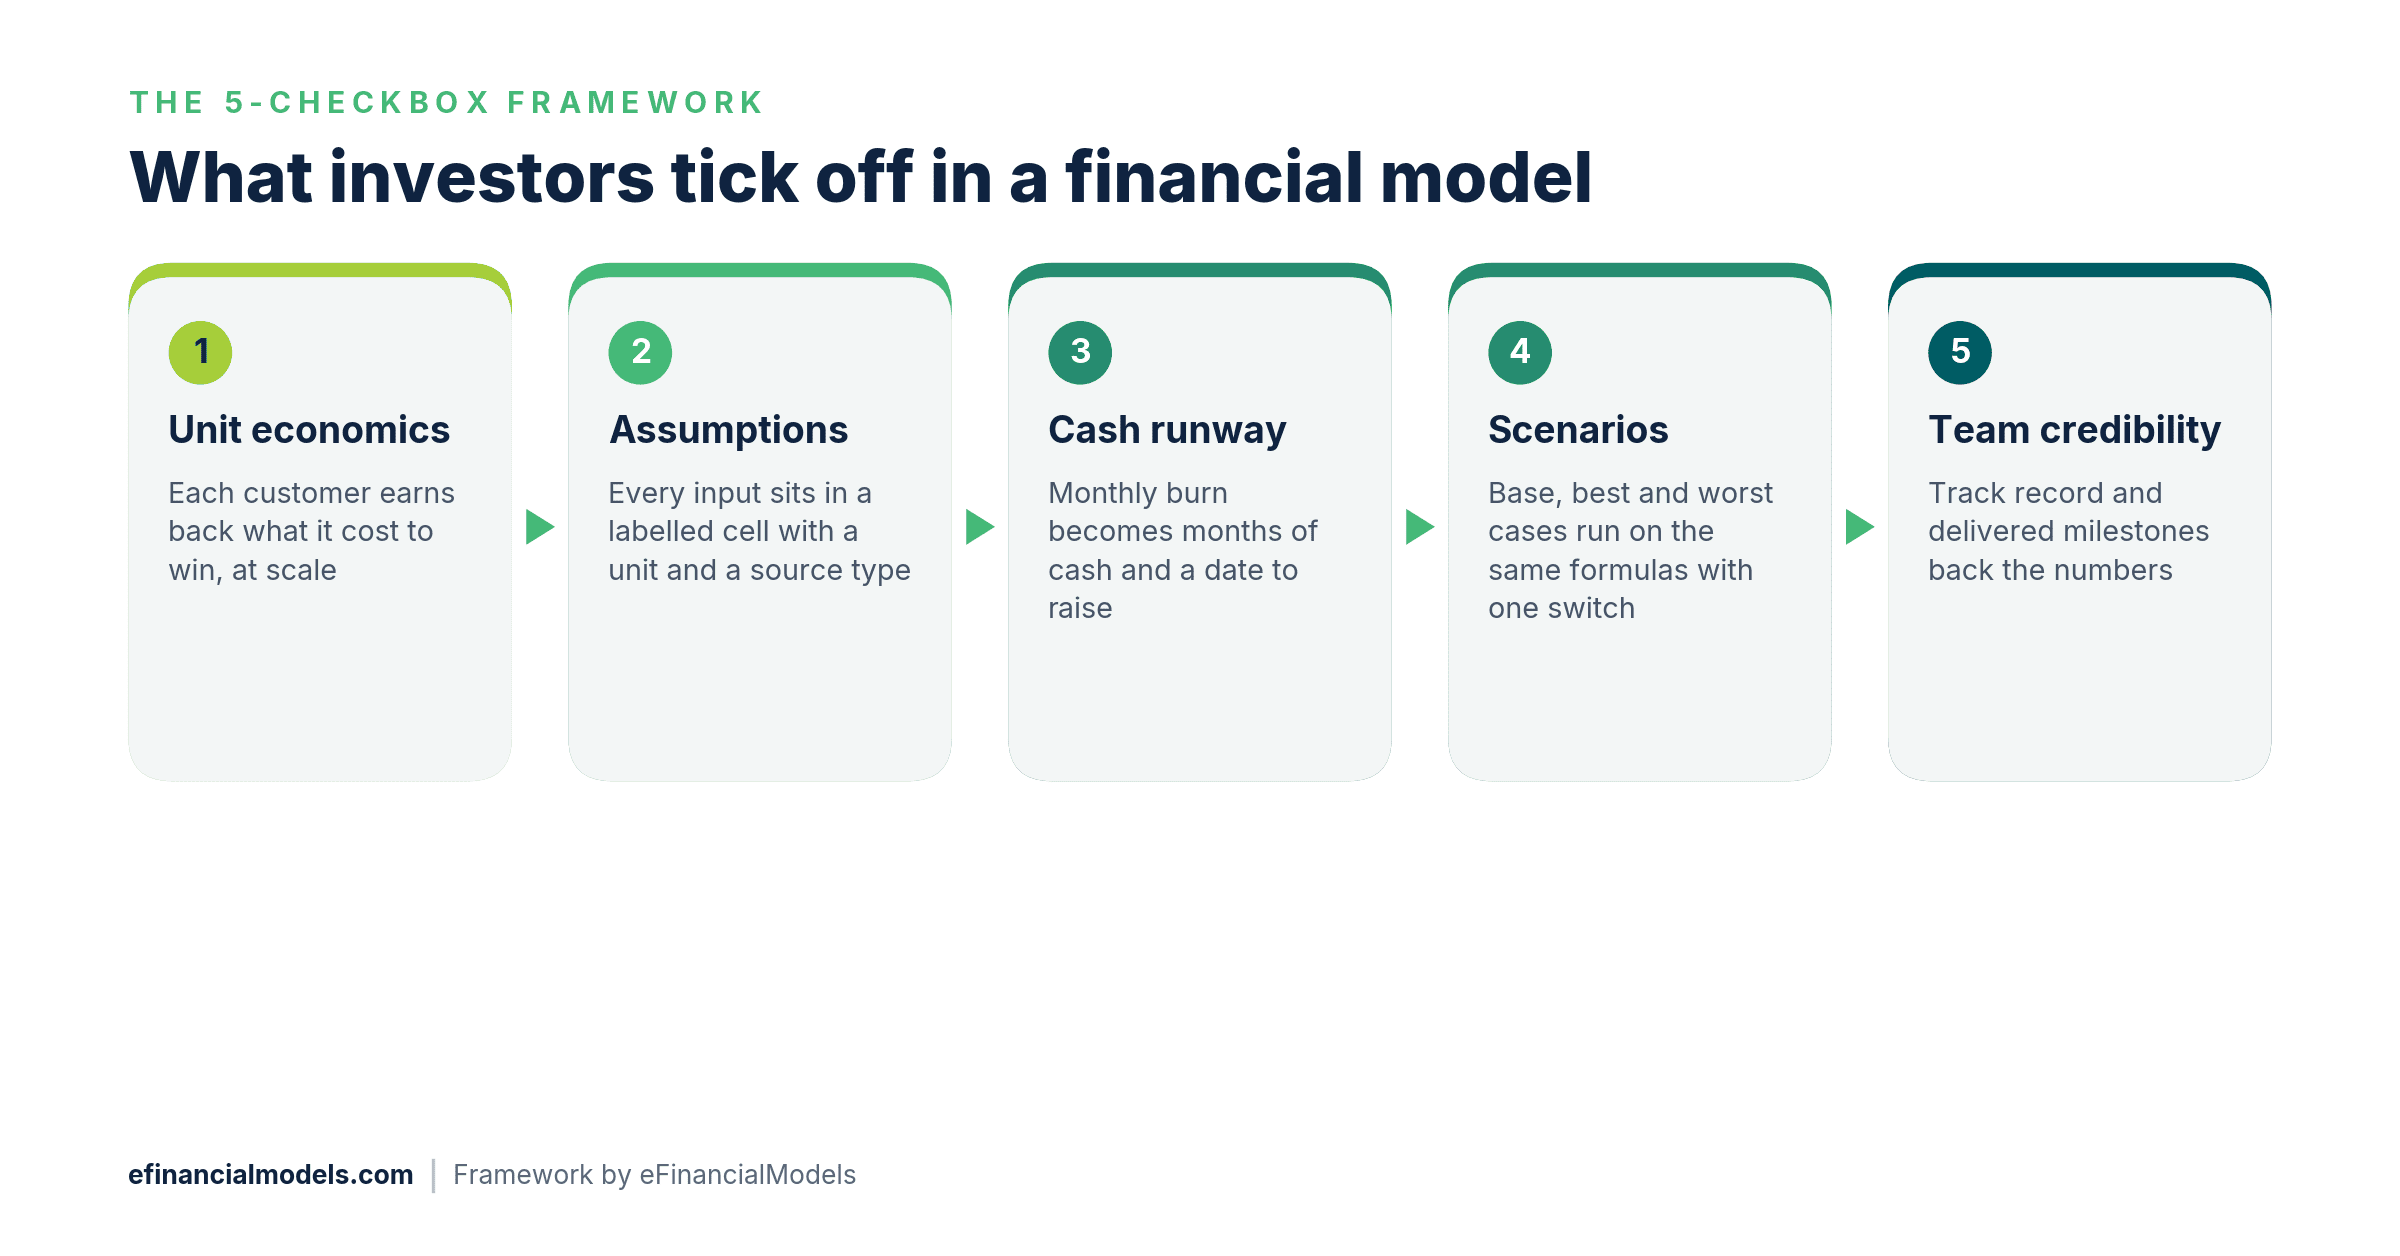
The five checkboxes in the order this guide builds them. Source: eFinancialModels Analysis
Five steps build each checkbox into the model
Step 1: Define unit economics
Calculate average revenue per account (ARPA) times gross margin (gross profit as a share of revenue), divide by monthly churn to get LTV, and divide sales and marketing spend by new customers to get CAC. CAC payback equals CAC divided by monthly gross profit per customer.
Step 2: Document assumptions
Create an assumptions tab with one row per input: value, unit, source type and rationale.
Step 3: Project cash flow and burn
Build a 13-week cash flow forecast, a week-by-week view of cash in and cash out for the next quarter, then extend it monthly. Divide cash by first-month net burn for flat-burn runway, and flag the month the balance turns negative in the monthly model.
Step 4: Create scenario analyses
Store base, best and worst inputs in one table and add a selector cell that switches the whole model.
Step 5: Present team credibility
Add a team tab with each founder’s relevant years, prior ventures and delivered milestones.
Worked example: an illustrative SaaS startup run through the checkboxes
The example is a fictional SaaS startup. All inputs are illustrative assumptions: USD 400,000 of opening cash, a price of USD 99 per customer per month, 80% gross margin, 100 opening customers, USD 12,000 of monthly sales and marketing spend (assumed to include sales salaries) and USD 28,000 of other fixed costs. The model is monthly, collects revenue in the month earned, holds costs flat and excludes tax, hiring and payment delays. The scenario table varies new customers per month (20, 28 and 12), monthly churn (3%, 2% and 5%) and price (USD 99, 105 and 89).
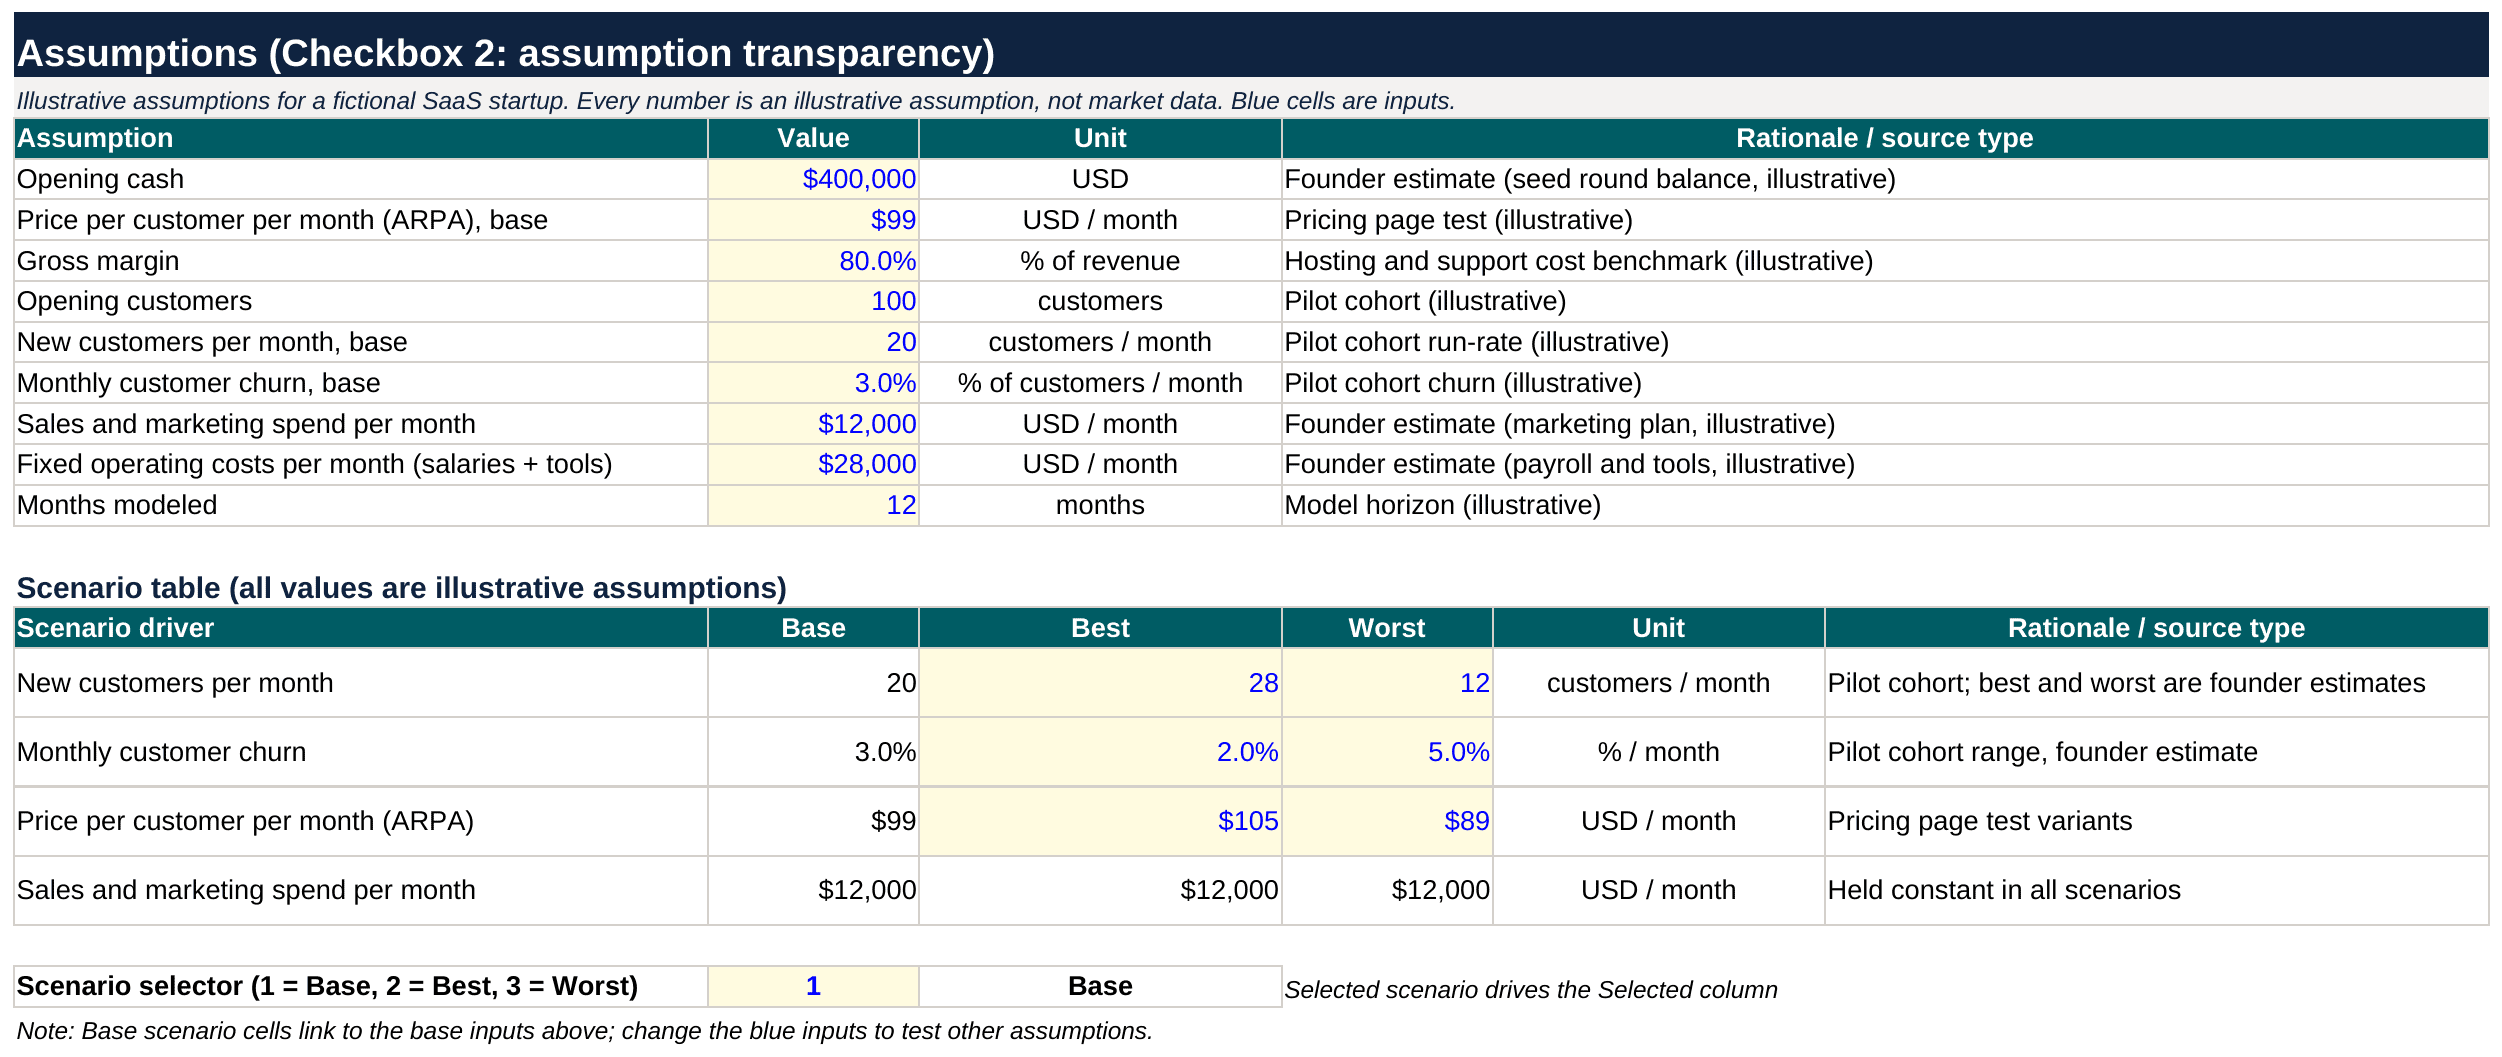
Every input sits in a labeled cell with a unit and a source type, so a reader can challenge each number. Source: eFinancialModels Analysis
The base case spends USD 12,000 to win 20 customers, so CAC is USD 600. Gross profit per customer is 99 x 0.80 = USD 79.20 a month. LTV is that gross profit divided by the 3% monthly churn: 79.20 / 0.03 = USD 2,640. That gives an LTV:CAC ratio of 4.4 (2,640 / 600) and a CAC payback of 7.6 months (600 / 79.20).
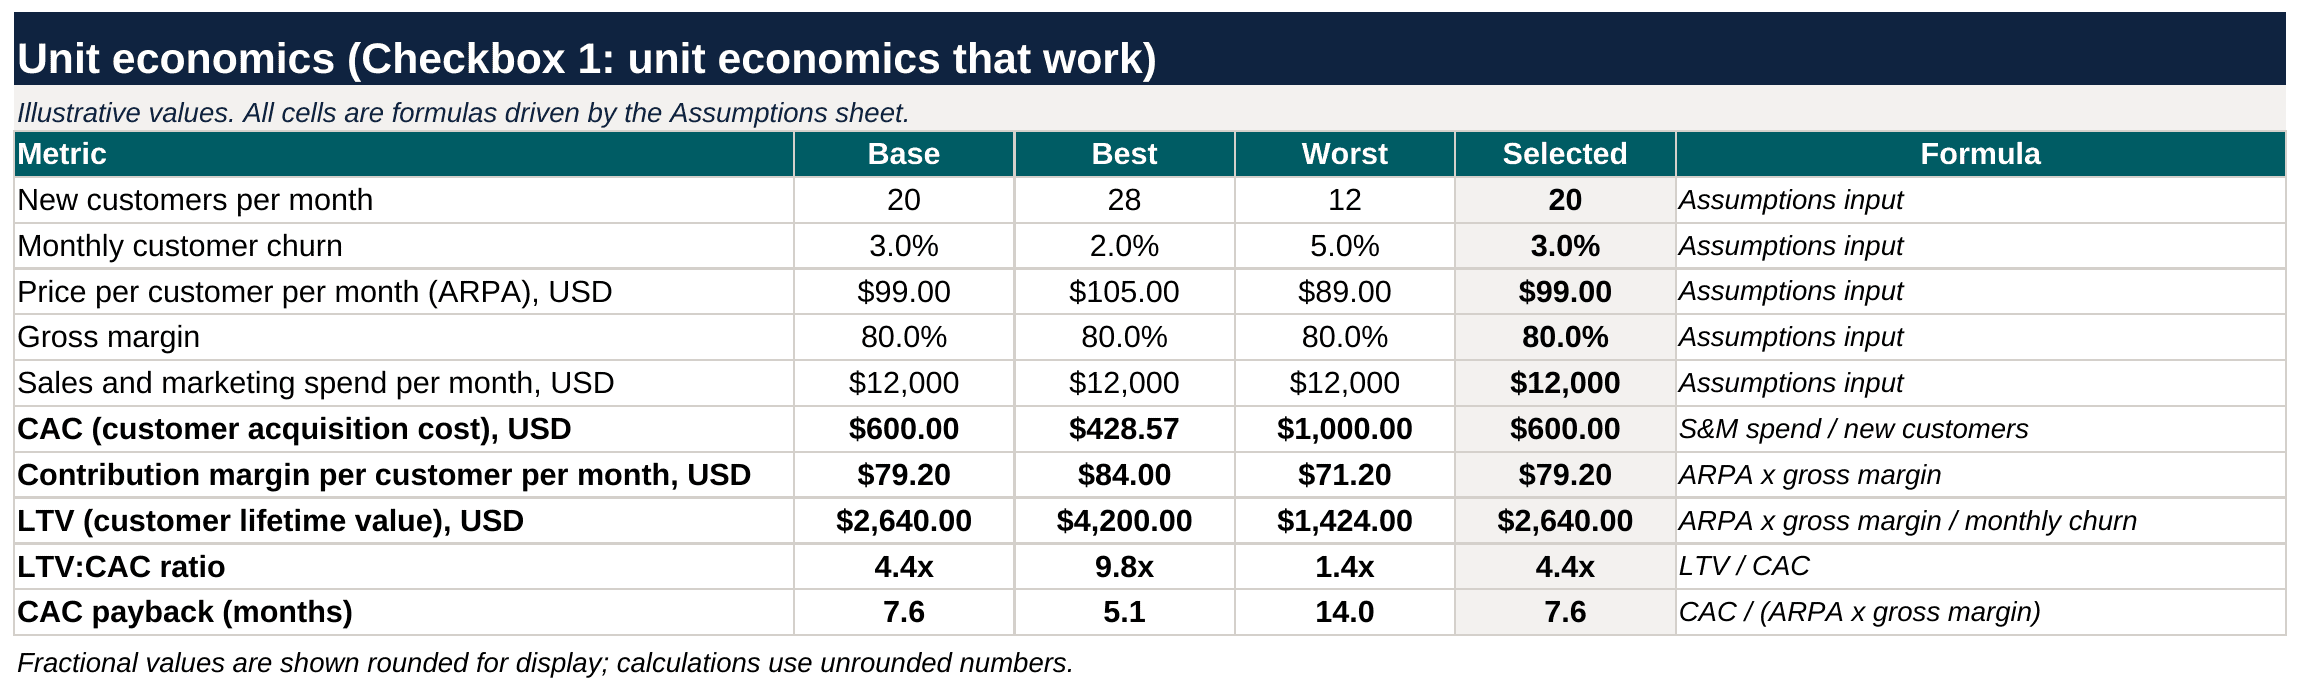
The same four formulas run for each scenario side by side, which makes the spread between cases visible at a glance. Source: eFinancialModels Analysis
| Result | Base | Best | Worst |
|---|---|---|---|
| LTV:CAC | 4.4 | 9.8 | 1.4 |
| CAC payback (months) | 7.6 | 5.1 | 14.0 |
| Customers at month 12 (rounded) | 273 | 380 | 164 |
| First-month net cash burn (USD) | 30,734 | 29,416 | 32,382 |
| Flat-burn runway (months) | 13.0 | 13.6 | 12.4 |
| Closing cash at month 12 (USD) | 109,329 | 179,262 | 38,004 |
| Cash-out month | Beyond month 12 | Beyond month 12 | Beyond month 12 |
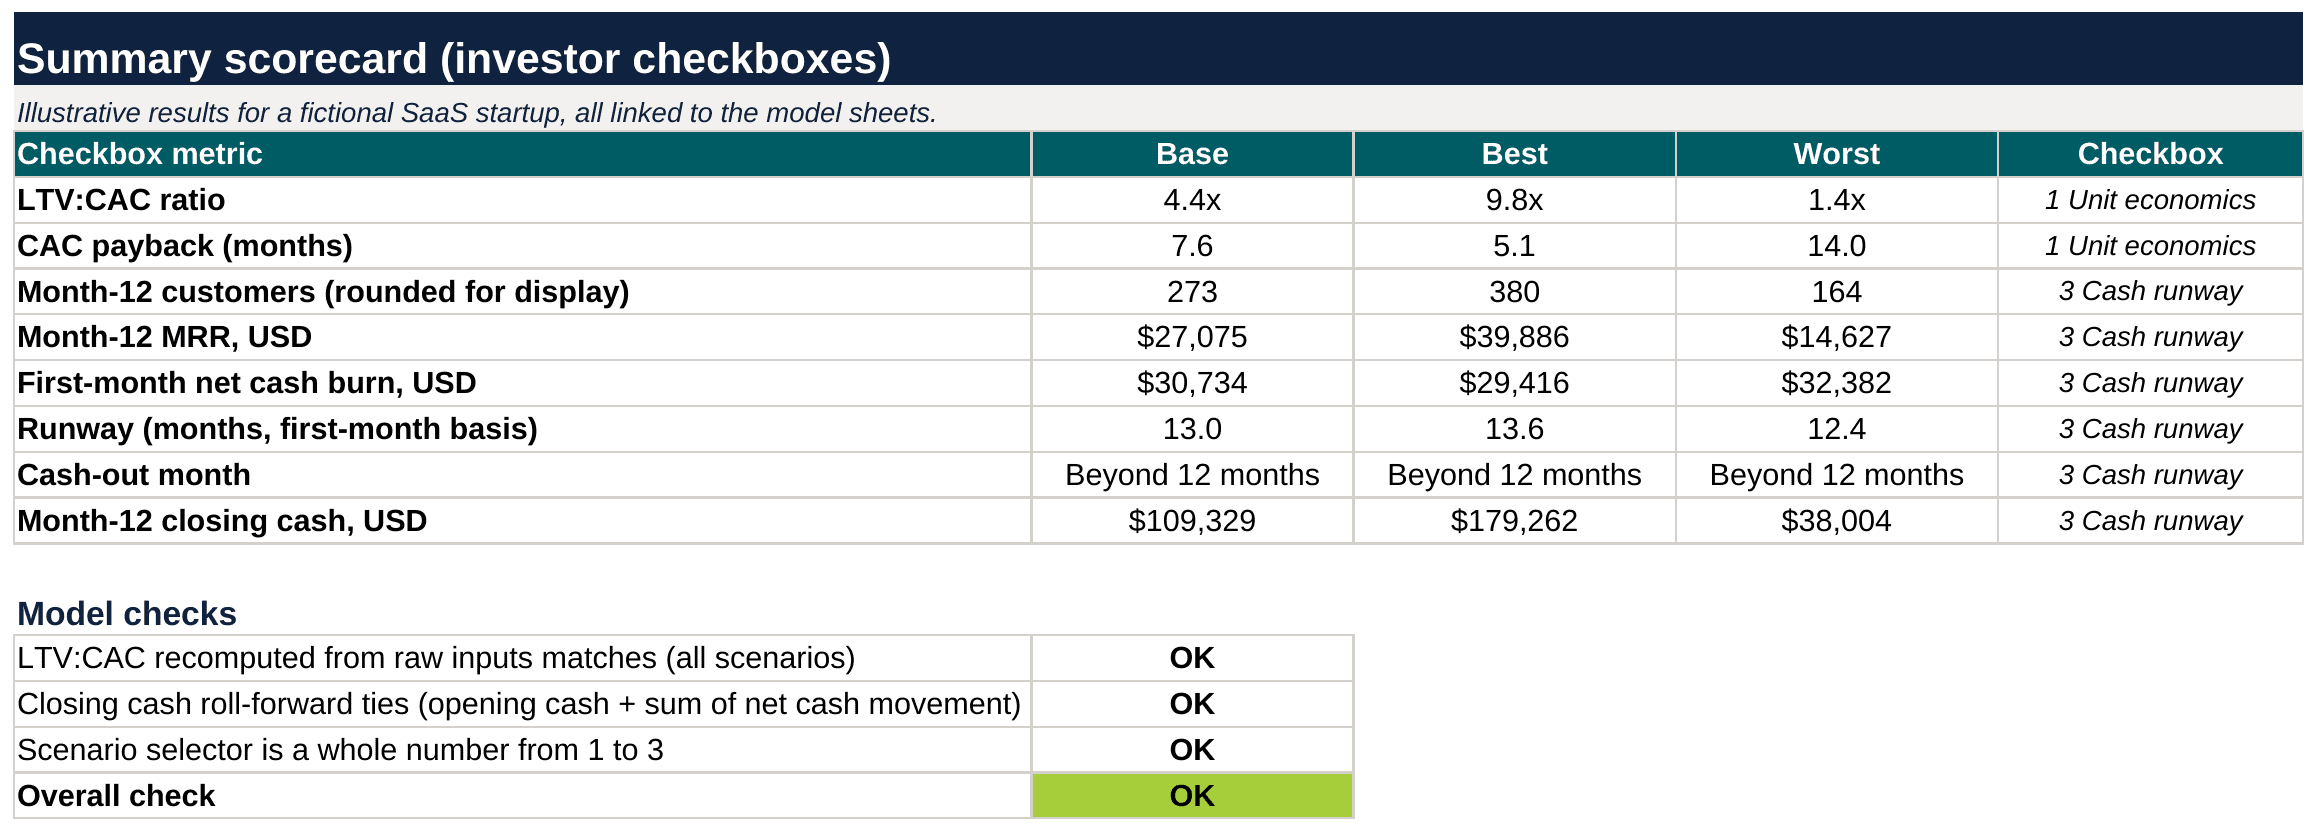
The scorecard condenses the model into the figures an investor reads first, with a reconciliation check beneath. Source: eFinancialModels Analysis
The base case clears both guidelines from the unit economics section. The worst case does not: a ratio of 1.4 and a payback of 14.0 months sit outside them, so new customers, churn and price, the inputs the scenarios vary, become the first things to test. Flat-burn runway applies the shortcut to the first forecast month of every scenario: 400,000 / 30,734 = 13.0 months in the base case. The monthly model gives the cash-out month. Revenue grows and burn falls, so no scenario runs out within the 12 modeled months and the cash-out month lies beyond month 12. All three flat-burn figures (12.4 to 13.6 months) sit inside the 12 to 18 month rule of thumb but below the 18 to 36 months investors say a raise should leave, so a raise would need to extend runway. The check cell reads OK.
Five mistakes turn investors off
- Growth assumptions with no justification, such as a steep monthly rise with no pipeline behind it.
- Missing or mis-calculated unit economics, such as an acquisition cost that leaves out sales salaries.
- Ignoring cash timing, because profit is not cash.
- A single-point forecast with no downside case.
- A black box model, where inputs sit inside formulas with no documented source.
Growth and retention claims draw the closest scrutiny. SaaStr suggests growing 7 to 15% a month and says net dollar retention (NDR), the share of starting revenue kept after churn and expansion, should be at least 100% at seed stage, with 120% or more the gold standard (SaaStr, 2025). These are rules of thumb.
Templates and tools speed up an investor-ready model
An Excel worksheet holds 1,048,576 rows by 16,384 columns (Microsoft, 2026). eFinancialModels lists ready structures in its financial model category, and the startup financial models tag and fundraising tag group templates for early-stage and investor-facing work.
Frequently Asked Questions
What is the most important checkbox for early-stage startups?
It depends on the stage. A startup with no revenue cannot prove unit economics, so documented assumptions and runway carry the most weight, because they show judgment and survival time. Once paying customers exist, the cohort data behind retention and acquisition cost becomes the strongest evidence and moves to the top. Scenario work and team credibility matter at every stage.
How detailed should assumption documentation be?
Price, churn, acquisition cost and the hiring plan each deserve a unit, a value, a source type and one sentence of reasoning, while a minor cost line needs only a value and a unit. A practical test is whether an investor could challenge any key input from the page alone. Where evidence is thin, the note should say so and name what will replace the guess.
How should scenario analysis appear in a pitch deck?
One slide is enough. Three columns for the base, best and worst cases should show the same four or five outputs, such as customers at month twelve, payback, year-end cash and the date funds run out. A line below should name the one or two inputs that drive the gap. Showing the downside case without being asked signals that the founder has already planned for it.
What if unit economics are still unproven?
Unproven economics should be labeled as hypotheses, not hidden. A founder can use early pilot cohorts, competitor price points or a small paid test to set provisional values, then show break-even CAC, the highest acquisition cost at which a customer still repays within the target period (monthly gross profit times target months). A dated plan to measure real cohorts gives investors a test to track.
How often should the financial model be updated for investors?
A monthly update after each close keeps actual results beside the forecast and shows variance, the gap between plan and outcome. A fundraising period calls for a refresh before each investor meeting, and a major change in churn, pricing or spend justifies an immediate revision. Version labels and a change log let investors see what moved and why, which builds trust in the next forecast.
Conclusion
Investors reward a model that proves unit economics, documents assumptions, shows runway, tests scenarios and backs the numbers with a credible team. Founders who want CAC, LTV, churn and scenario analysis in a ready monthly structure can start from the eFinancialModels SaaS Business Financial Model.