0 ITEMS

Apartment Hunting Spreadsheet: Track 10+ Rentals at Once
An apartment hunting spreadsheet puts every rental in one row, tests rent plus utilities against 30% of gross monthly income, and ranks the survivors by weighted score and first-year cost. In the worked example below, the highest-scoring of ten rentals fails that budget test, and a cheaper listing wins.
Key Takeaways
- One row per rental, holding rent, utilities, parking, fees, commute, size and ratings, lets a renter compare ten listings side by side.
- Spending over 30% of gross monthly income on rent plus utilities means cost burden, so the spreadsheet passes only listings at 30% or below.
- In the worked example, the top-scoring rental takes 34.6% of income, and the best listing inside the ceiling is Cedar Gardens, scoring 4.01 out of 5.
- First-year cost adds twelve months of all-in cost to the refundable deposit and application fee, giving Cedar Gardens USD 19,005, excluding broker, moving and pet costs.
- Two extra columns, viewed in person and payment requested, keep any listing that demands money before a viewing out of the scoring stage.
A spreadsheet keeps ten rentals comparable
A spreadsheet beats memory and browser tabs because every listing receives the same fields, so a renter compares like with like. Housing takes a large share of renter budgets: the Census Bureau reported that median gross rent rose to $1,487 a month in 2024 from $1,448 in 2023 after adjusting for inflation, and that the median share of income going toward rent stayed at 31% (U.S. Census Bureau, 2025). Gross rent, which this article also calls rent plus utilities, is the contract rent plus the estimated monthly cost of utilities that the renter pays (U.S. Census Bureau, American Community Survey report, 2025).
The pressure is widespread. In its Six Takeaways from America’s Rental Housing 2026 summary, the Harvard Joint Center for Housing Studies stated that cost-burdened renter households reached a record 22.7 million (49 percent) in 2024, and that 12.1 million renters (26 percent) spend more than half of their income on rent and utilities, which makes them severely burdened (Harvard Joint Center for Housing Studies, Six Takeaways from America’s Rental Housing 2026). A sheet that shows the budget effect of each listing before a viewing protects renters from falling in love with a unit they cannot afford.
The workflow has four steps: list every rental, apply the budget gate, score what is left, and compare first-year cost.
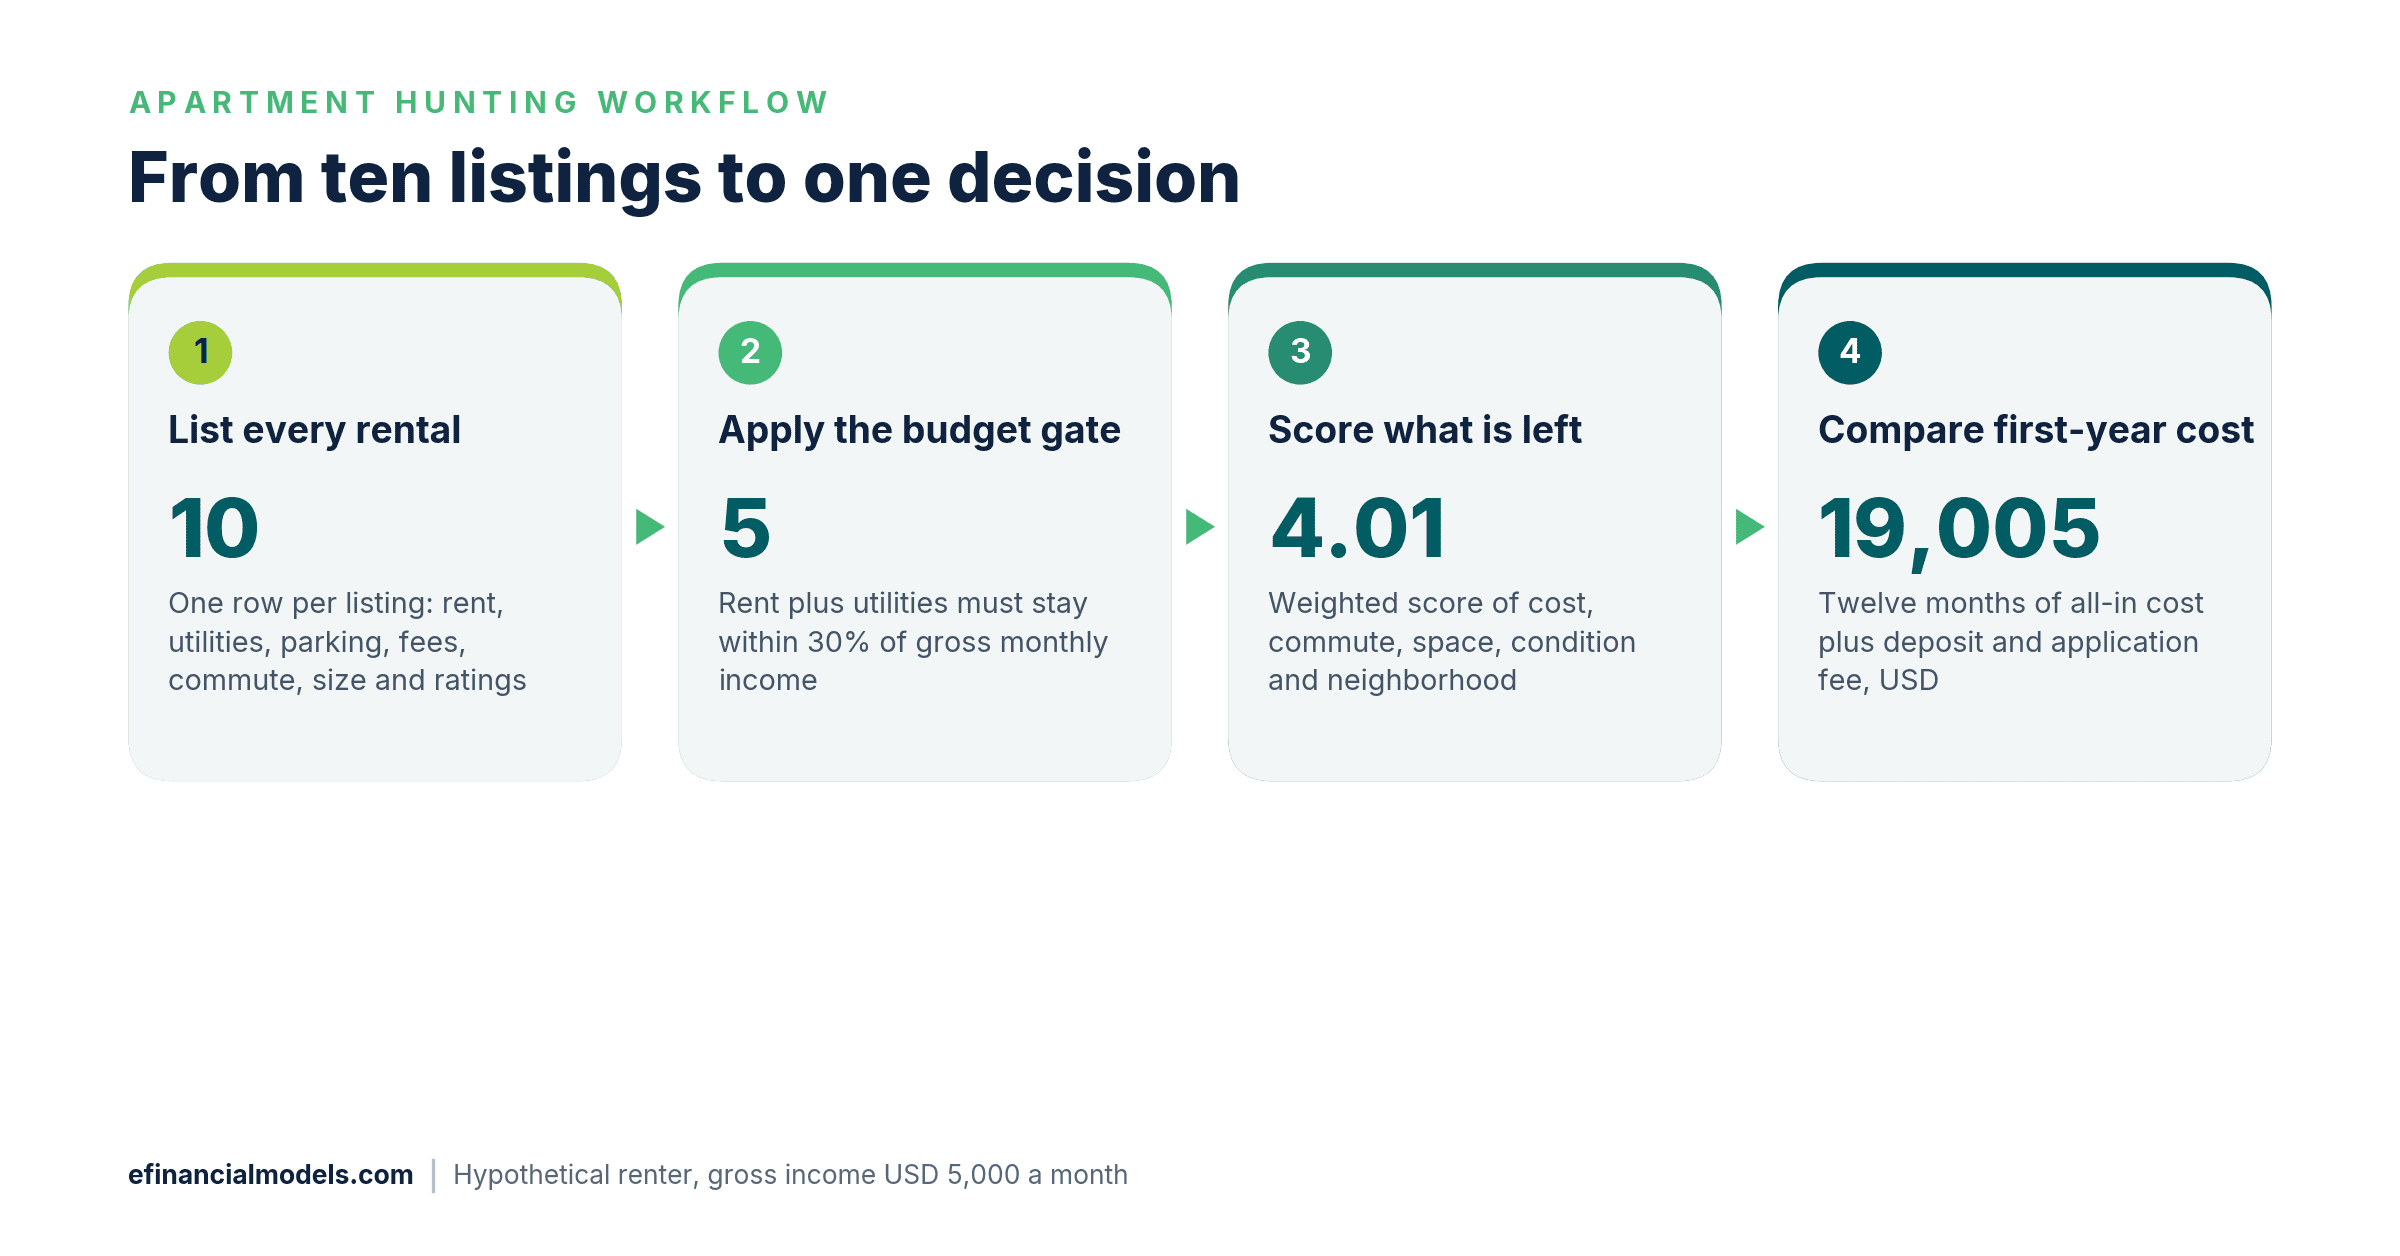
The workflow narrows ten rentals to five that pass the budget gate and one that wins on score and cost.
Record rent, utilities, fees, commute, size and ratings for every listing
Each rental needs one row and the same eight kinds of input. Blue cells hold typed inputs, and black cells hold formulas, so a renter always sees which numbers are assumptions.
| Column | What to enter | Why it matters |
|---|---|---|
| Monthly rent | Advertised contract rent | Base of the budget test |
| Utilities (estimate) | Monthly electricity, gas, water and other fuels the renter pays | Part of gross rent, so it counts in the test |
| Parking | Monthly fee, or zero | Raises the all-in monthly cost |
| Security deposit | Refundable amount held by the landlord | Cash needed before move-in |
| Application fee | One-off screening charge | Repeats for every application |
| Commute minutes | One way, at the usual travel time | Converts into hours lost each month |
| Square feet | Listed floor area | Feeds the space score |
| Condition and neighborhood ratings | Whole numbers from 1 to 5 after each viewing | Keeps subjective impressions comparable |
Keep rejected rentals in the sheet and mark them with a status column instead of deleting them, because a rejected row still shows what the market offers. Renters who want the same discipline across the rest of their money can browse the Personal Finance category at eFinancialModels.
Apply a 30% budget gate before scoring anything
The gate divides gross rent, which is rent plus utilities, by gross monthly income and passes a listing only when the result is 30% or lower. A household that pays more than 30% of its income toward housing costs is called cost burdened (U.S. Census Bureau, American Community Survey report, 2025), so the ceiling comes from the standard definition rather than a personal guess. The gate counts only rent plus utilities, and the all-in monthly cost adds parking and renter’s insurance afterwards.
A renter with heavy debt payments can lower it in one input cell, and the whole sheet recalculates.
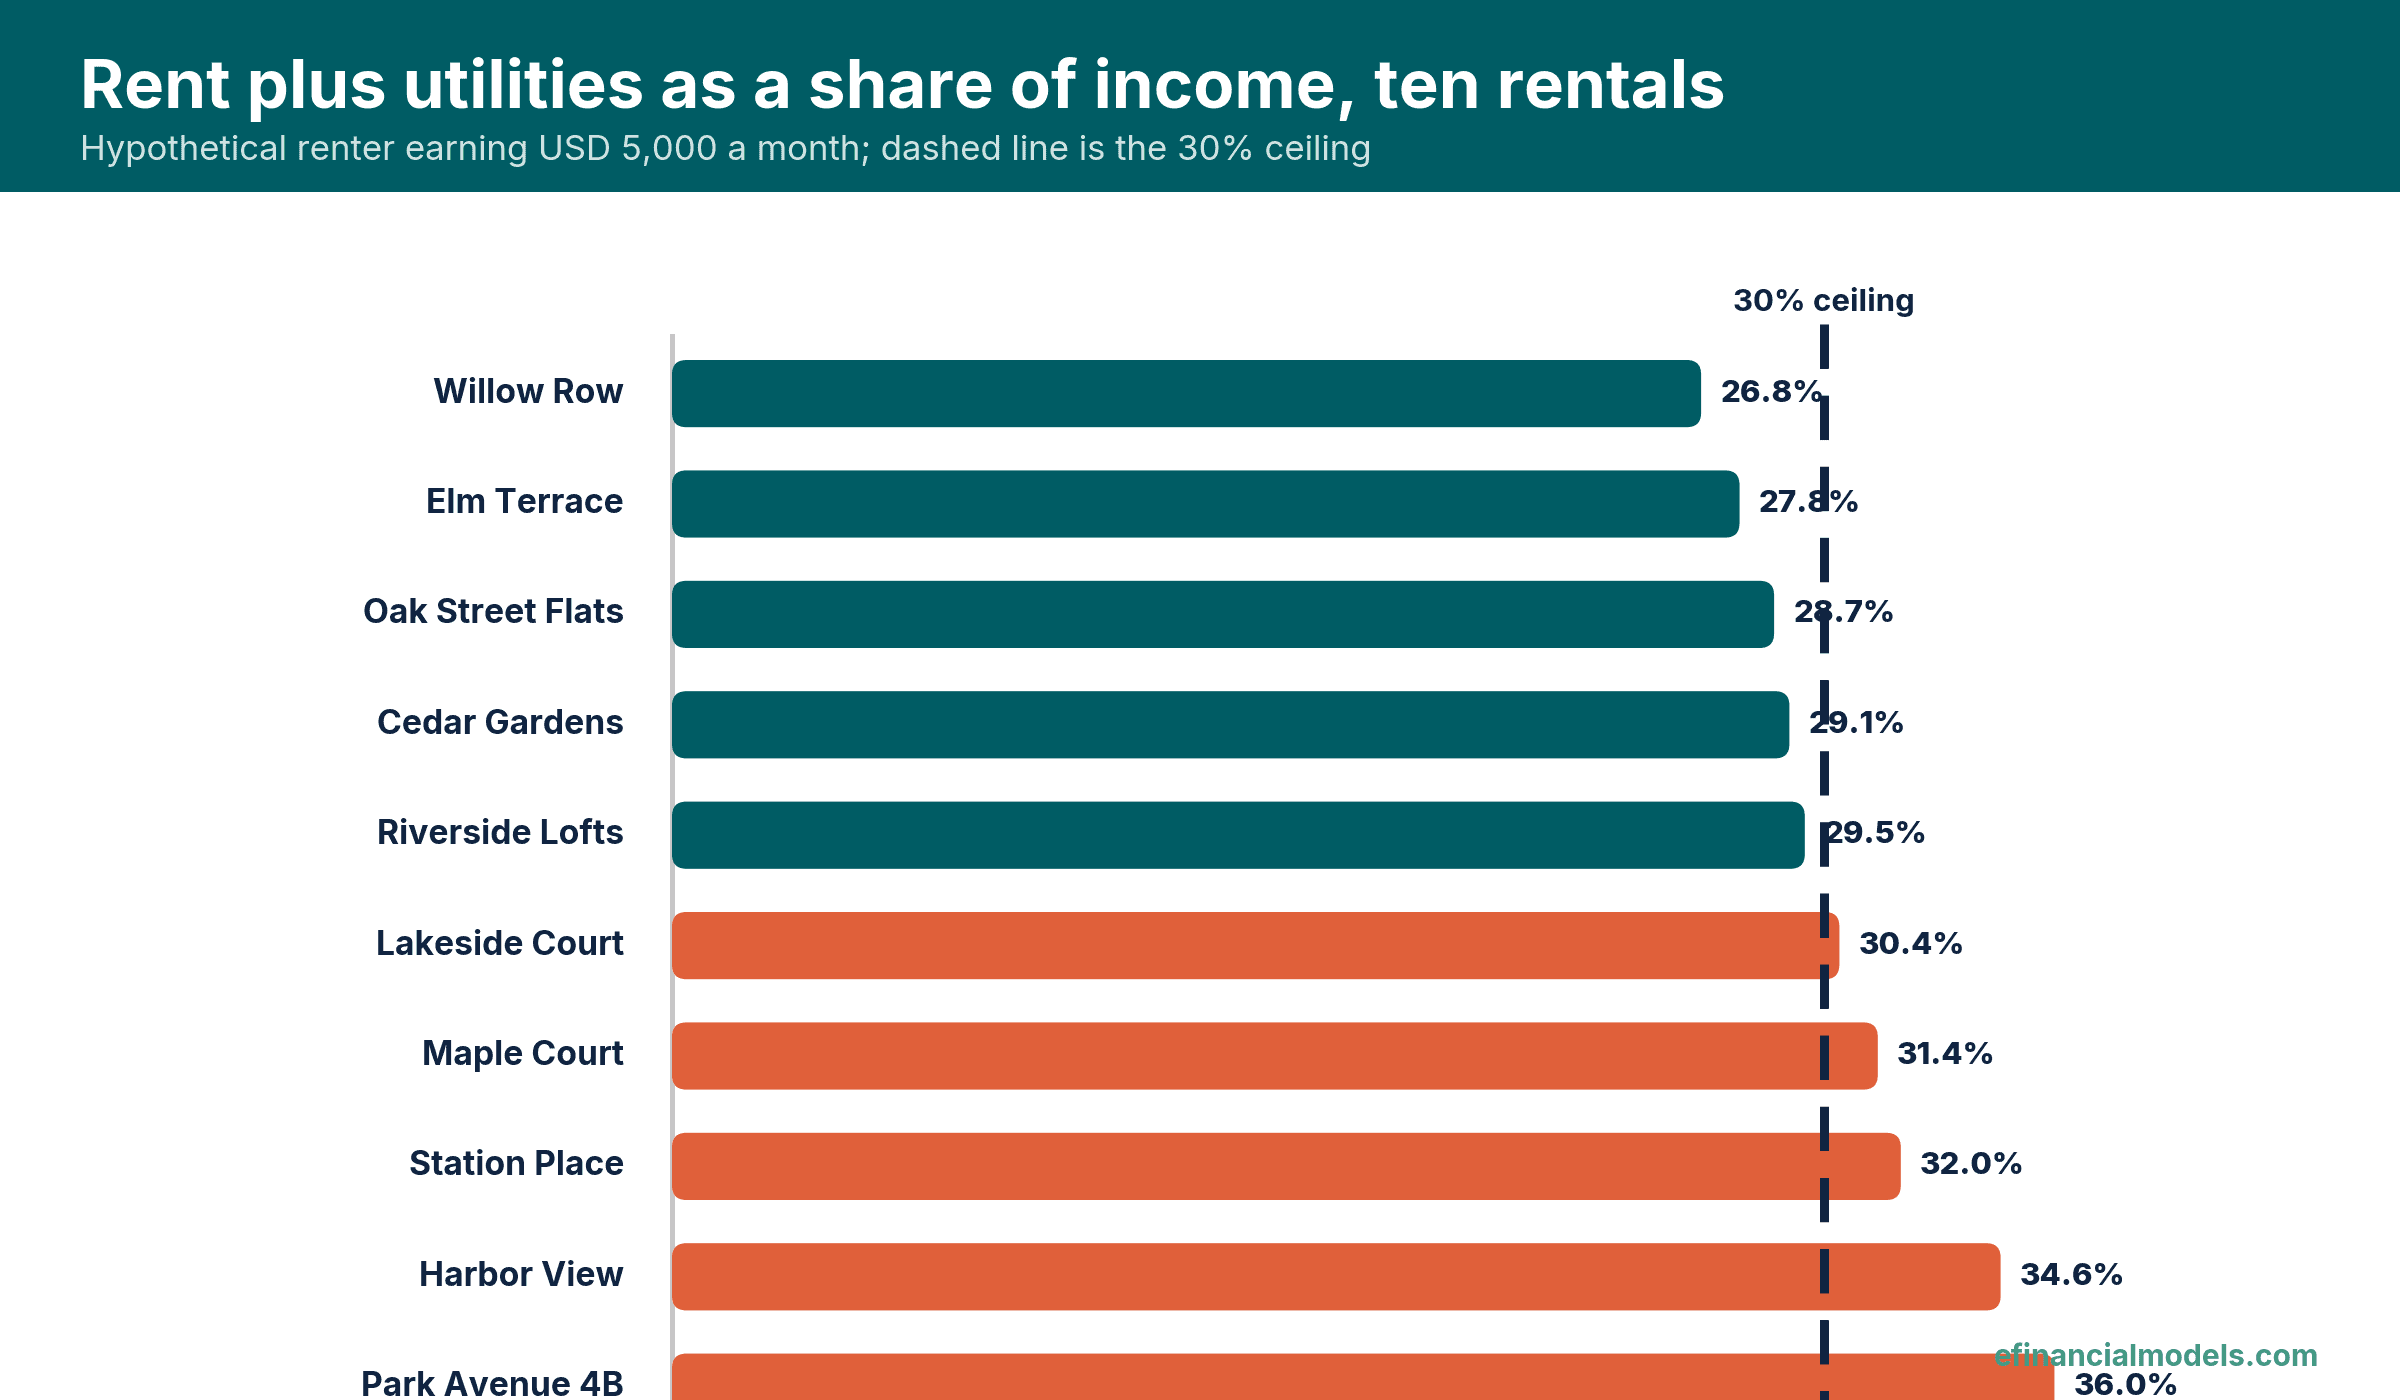
Five of the ten rentals fall under the 30% ceiling, and Park Avenue 4B is highest at 36.0%. Source: eFinancialModels Analysis
Worked example: ten rentals, one clear winner
The example assumes a renter with a gross income of USD 5,000 a month, a 30% ceiling and so a maximum of USD 1,500 for rent plus utilities. Every deposit equals one month’s rent, application fees run from USD 30 to USD 60, renter’s insurance costs USD 15 a month for every listing, the commute happens 21 days a month, and the weights are 35% cost, 20% commute, 15% space, 15% condition and 15% neighborhood. All figures are illustrative. The example tracks ten rentals, and adding rows extends the same formulas to any number of listings.
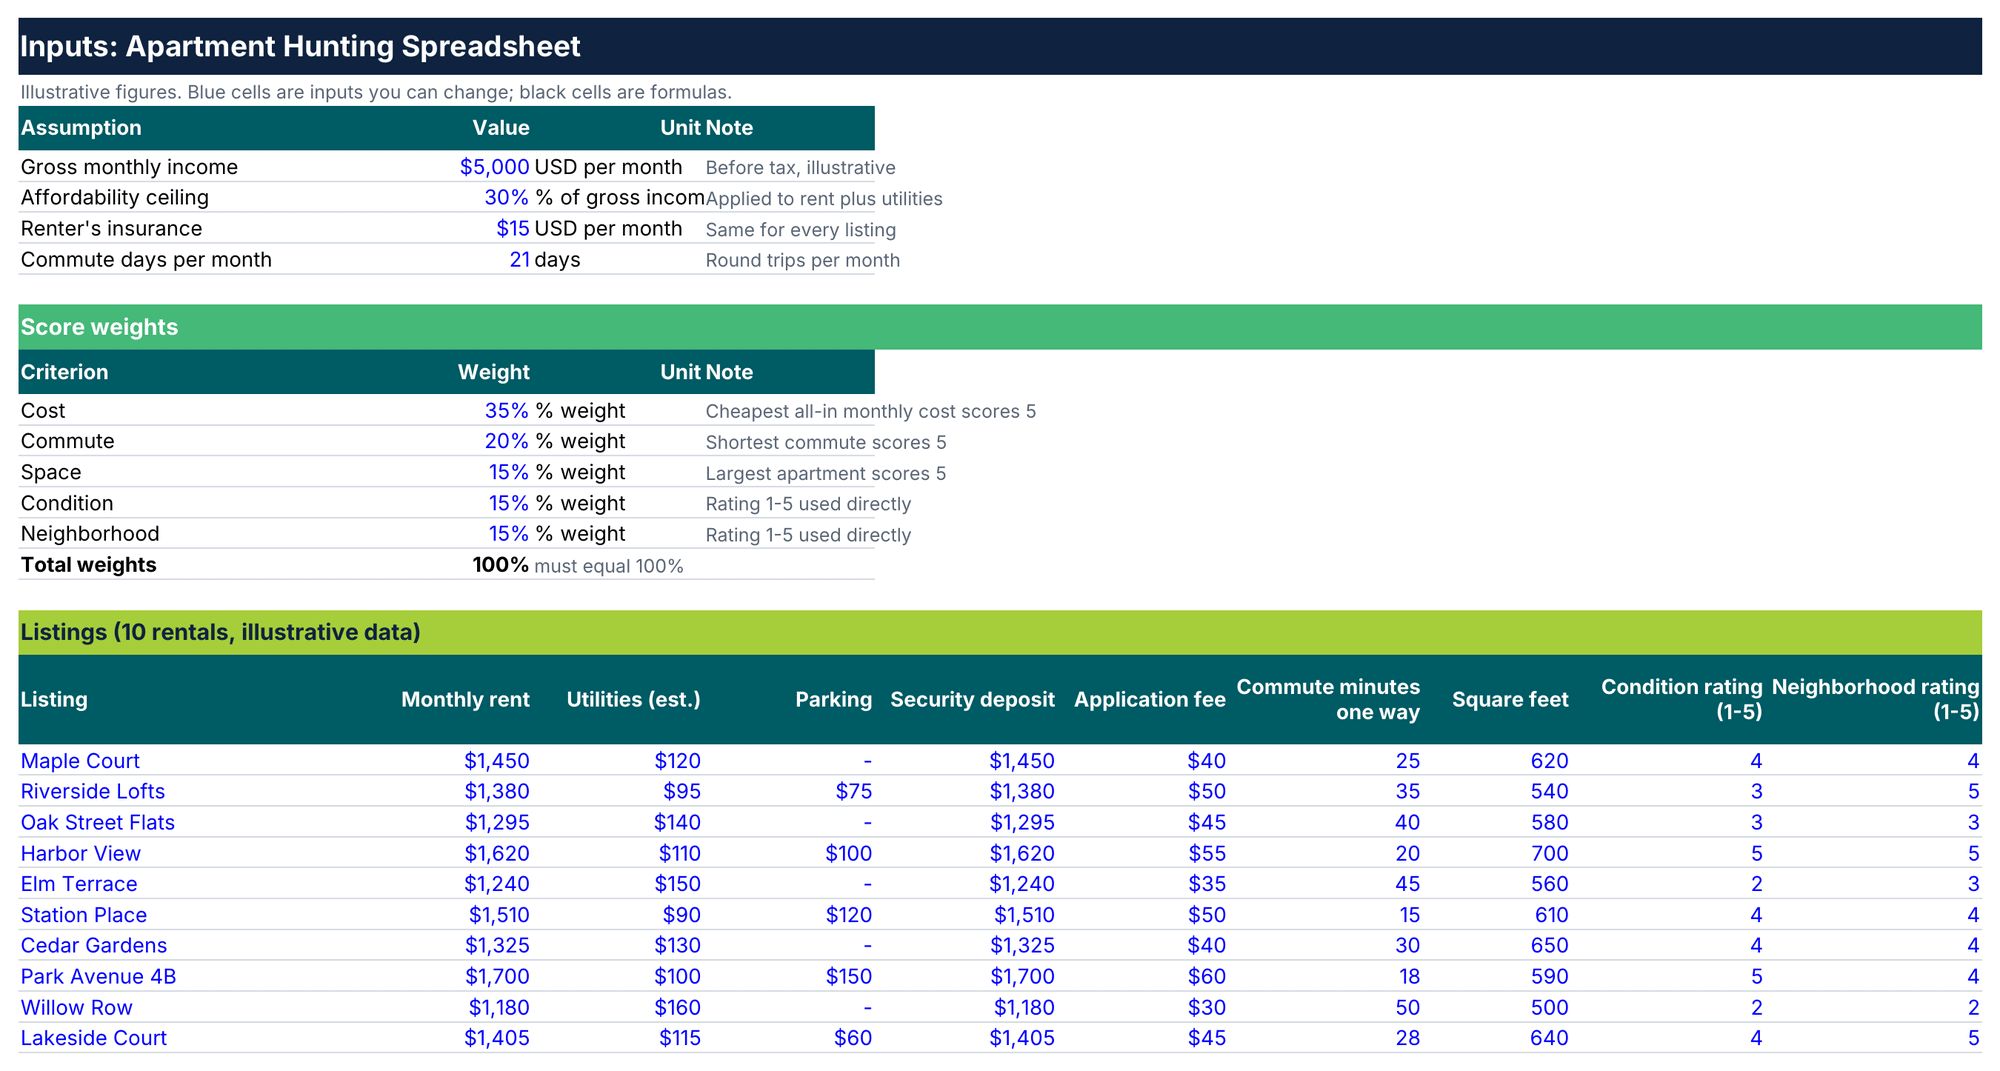
Every assumption of the worked example sits on one inputs sheet, and each blue cell can be changed. Source: eFinancialModels Analysis
The calculation sheet turns each row into five numbers. All-in monthly cost is rent plus utilities plus parking plus insurance. First-year cost is twelve months of all-in cost plus the deposit and the application fee, so it measures cash needed in the first year, and the deposit is refundable. Commute hours are minutes multiplied by two trips, 21 days and divided by 60. The cost score is 5 times the cheapest all-in cost divided by the listing’s own, the commute score does the same with minutes, and the space score is 5 times square feet divided by the largest size. Scores are relative to the best listing in the set, so adding a row can shift every score and the ranking.
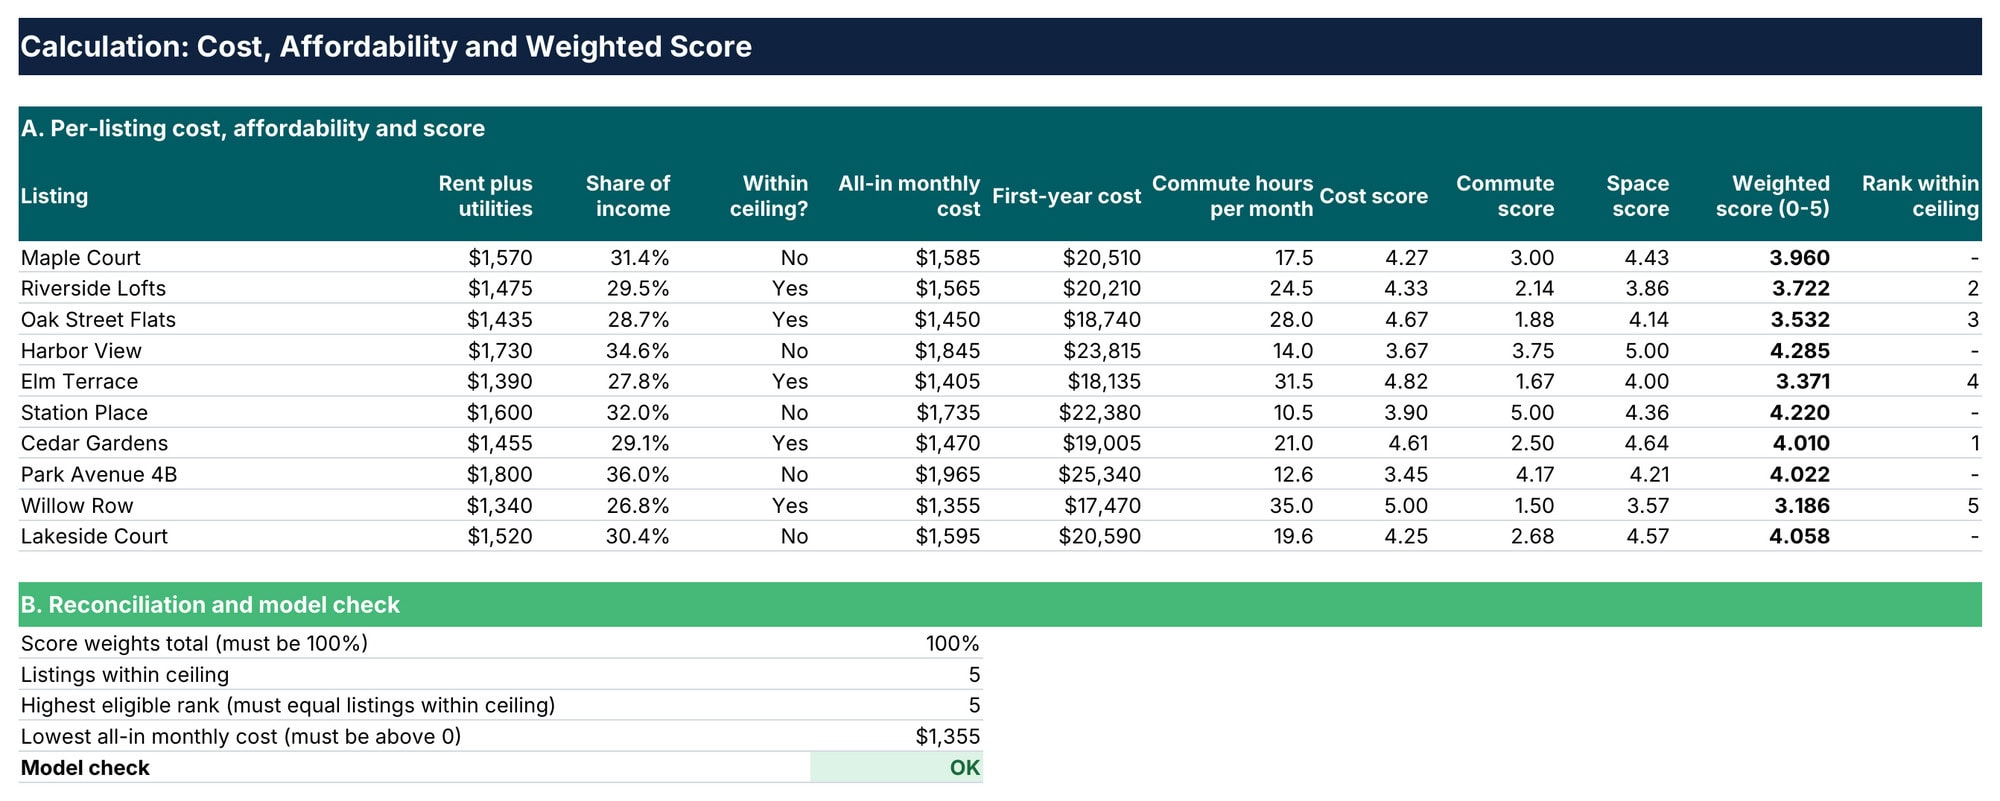
The calculation sheet runs each listing through the budget gate, the scores and the rank, and ends in the check cell. Source: eFinancialModels Analysis
| Listing | Rent plus utilities (USD) | Share of income | Within 30% | All-in monthly (USD) | First-year cost (USD) | Weighted score | Rank inside ceiling |
|---|---|---|---|---|---|---|---|
| Harbor View | 1,730 | 34.6% | No | 1,845 | 23,815 | 4.285 | – |
| Station Place | 1,600 | 32.0% | No | 1,735 | 22,380 | 4.220 | – |
| Lakeside Court | 1,520 | 30.4% | No | 1,595 | 20,590 | 4.058 | – |
| Park Avenue 4B | 1,800 | 36.0% | No | 1,965 | 25,340 | 4.022 | – |
| Cedar Gardens | 1,455 | 29.1% | Yes | 1,470 | 19,005 | 4.010 | 1 |
| Maple Court | 1,570 | 31.4% | No | 1,585 | 20,510 | 3.960 | – |
| Riverside Lofts | 1,475 | 29.5% | Yes | 1,565 | 20,210 | 3.722 | 2 |
| Oak Street Flats | 1,435 | 28.7% | Yes | 1,450 | 18,740 | 3.532 | 3 |
| Elm Terrace | 1,390 | 27.8% | Yes | 1,405 | 18,135 | 3.371 | 4 |
| Willow Row | 1,340 | 26.8% | Yes | 1,355 | 17,470 | 3.186 | 5 |
Harbor View scores highest at 4.285, yet its rent plus utilities of USD 1,730 equal 34.6% of income, so the gate removes it. Four of the five highest scores fail the gate, and only five of ten listings pass. Cedar Gardens ranks first among the survivors. Its cost score is 5 × 1,355 ÷ 1,470 = 4.61 and its commute score is 5 × 15 ÷ 30 = 2.50. The workbook combines these with the space score and the two ratings into the weighted score of 4.01 on the 0 to 5 scale.
The cheapest option is not the winner. Willow Row has the lowest first-year cost at USD 17,470, but its 50-minute commute costs 35.0 hours a month against 21.0 hours for Cedar Gardens, and its ratings of 2 and 2 pull the score to 3.186. Cedar Gardens costs USD 1,535 more over the first year, which buys 14 hours back each month.
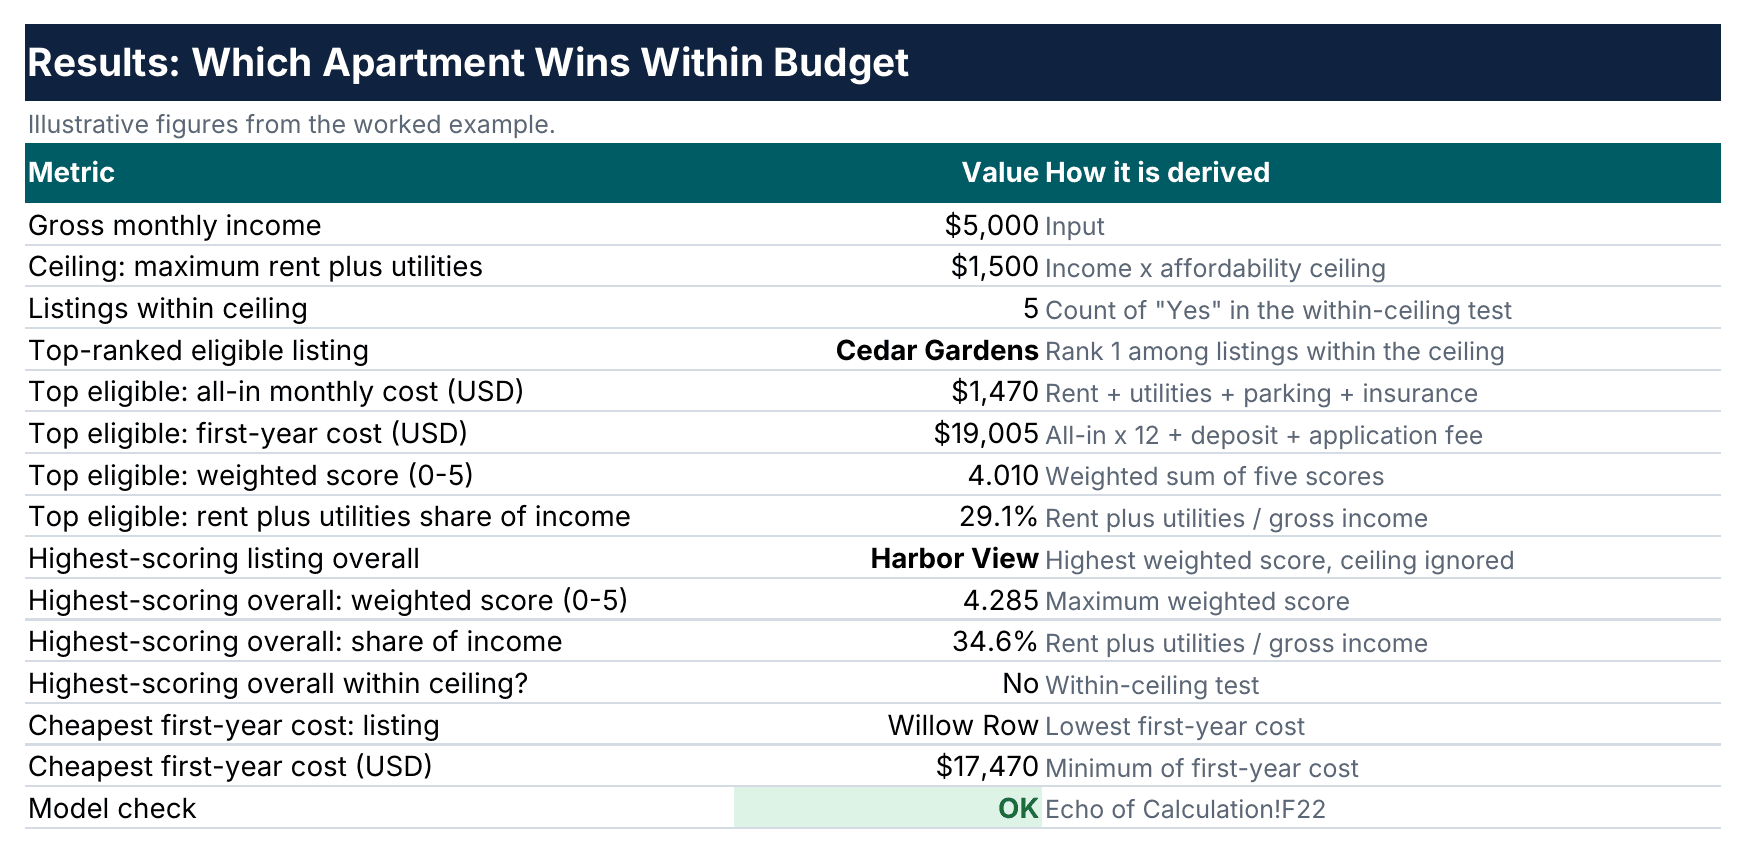
The results sheet shows that the highest raw score fails the ceiling while Cedar Gardens wins among the survivors. Source: eFinancialModels Analysis
Compare the spreadsheet with other apartment hunting tools
A spreadsheet suits renters who compare many listings with numbers, and other tools suit other jobs. The table shows when each one fits.
| Tool | Best for | Weak spot |
|---|---|---|
| Spreadsheet | Comparing costs, running the budget gate, ranking by weights | Needs a few minutes of setup |
| Notes or database app | Storing photos, links and viewing notes | Weak at calculations unless formulas are added |
| Saved lists on rental sites | Finding listings and watching price changes | Often omit utilities, fees and commute |
| Paper notebook | Quick notes during a viewing | Cannot recalculate when an input changes |
The tools work together: rental sites find listings, a notes app holds photos, and the spreadsheet makes the decision. Investors who study rentals from the owner’s side can browse the Real Estate category at eFinancialModels.
Keep scams and fee traps out of the spreadsheet
Add two columns, viewed in person and payment requested, so the sheet records the warning signs of a rental scam. A listing that asks for an application fee, deposit or first month’s rent before the renter has seen the unit, or that demands payment by wire transfer, gift card or cryptocurrency, is a reason to keep looking. A row with a payment request and no viewing never reaches the scoring stage.
Frequently Asked Questions
How many rentals should a renter track at once?
Ten to fifteen rows is a practical range. That is enough variety to reveal how prices differ across neighborhoods, and few enough that ratings stay consistent from one viewing to the next. Add a status column with values such as saved, viewed, applied and rejected, then filter the sheet to the active rows. Archiving a rejected rental instead of deleting it also helps when a better unit disappears and the renter wants to revisit an earlier option.
How should a renter estimate utilities for a listing?
Ask the landlord or property manager which utilities the rent includes, then request the average monthly bills for electricity, gas, water and other fuels from the current tenant or the utility provider. Enter one monthly estimate and note any utility the landlord pays. Use the same method for every listing, because mixing real bills for one unit with guesses for another distorts the ranking and can push a listing across the ceiling unfairly.
Which weights should the score use?
The weights express what the renter values, so they should change with the household. A renter who works from home can cut the commute weight to zero and raise space, while a renter without a car may weight commute heavily. The five weights must total 100%, and the check cell shows an error when they do not. After changing them, test whether the winner changes; a winner that survives several weight sets is a safer choice.
What if the top-scoring listing fails the budget gate?
Treat the gate as a decision rule and not as a suggestion. The renter can negotiate rent, ask for a longer lease in exchange for a discount, or add a roommate whose income raises the household total. Each change goes into the input cells, and the sheet recalculates the share of income. Raising the ceiling just to admit a favorite listing defeats the purpose, so the ceiling stays fixed while the other inputs move.
What should a renter record during a viewing?
Record facts that a photo hides: water pressure, noise at the usual commute hours, mobile signal, natural light, storage and the state of appliances. Convert the impressions into the two ratings immediately after leaving, before the next viewing blurs them. Write the rating rules once, for example a 3 means acceptable with minor repairs, so that ratings from different days remain comparable inside the same sheet.
Conclusion
An apartment hunting spreadsheet gives each rental one row, a 30% budget gate, a weighted score and a first-year cost, and the worked example shows that the best-scoring unit can fail the gate while Cedar Gardens passes with USD 19,005 of first-year cost. Renters who want to carry the chosen rent into a full monthly plan can start from the eFinancialModels Personal Budgets template collection, which includes an Actual vs Budget template and a free Excel budget template for tracking income against expenses.