0 ITEMS

Balance Sheet in Excel: How to Build One in 7 Steps

A balance sheet in Excel is built by listing assets, liabilities and equity as separate blocks for each reporting date, summing every block with formulas and adding a check cell that confirms assets equal liabilities plus equity. In the illustrative example below, seven steps turn assumed line items for a fictional coffee roaster into total assets of 459,000 US dollars, a balance check that reads OK and a current ratio of 2.36.
Key Takeaways
- A balance sheet balances when total assets equal total liabilities plus equity, so every Excel build needs a formula-driven check cell.
- A classified layout, with current and non-current sections, is the version that supports working capital and ratio analysis.
- In the illustrative example, 459,000 of total assets equals 239,000 of liabilities plus 220,000 of equity at 31 December 2025.
- Keeping typed inputs apart from formula outputs makes errors easier to find and the workbook easier to audit.
- Comparing two dates shows direction: the example’s current ratio rose from 2.10 to 2.36 and total liabilities to equity fell from 1.42 to 1.09.
A Balance Sheet Is One Equation Plus a Check Cell
A balance sheet lists what a business owns, what it owes and what remains for its owners at one date. The U.S. Securities and Exchange Commission (SEC) states the equation as assets equal liabilities plus shareholders’ equity in its Beginners’ Guide to Financial Statements, and the same guide defines liabilities as amounts of money that a company owes to others. See also the financial statements tag.
Many businesses seek funding. The U.S. Small Business Administration (SBA) Office of Advocacy counted 34.8 million small businesses in the United States in its November 2024 report release, and a June 2025 release reported that the number of small businesses in the U.S. exceeds 36 million.
Use a Classified Layout Unless a Reader Asks for Another
A classified balance sheet separates current assets and liabilities from non-current ones, and it is the layout most small businesses should build because ratios depend on that split. The equation is identical in every layout; the layout changes how lines are grouped, not whether the sheet balances. Under US generally accepted accounting principles (GAAP), PwC’s financial statement presentation guide notes that most entities present a classified balance sheet, which separates current and noncurrent assets and liabilities.
International Financial Reporting Standards (IFRS) use the title statement of financial position. The IFRS Foundation lists that statement among the requirements of International Accounting Standard (IAS) 1, and an open financial accounting textbook explains that one criterion for a current liability is that it is due to be settled within 12 months after the reporting period. The IFRS Foundation also states that IFRS 18 is effective for annual reporting periods beginning on or after 1 January 2027, so readers reporting under IFRS should confirm which standard applies to their periods.
| Layout | What it shows | Best fit in Excel |
|---|---|---|
| Unclassified | One list of assets, one list of liabilities, then equity | Quick personal or very small business checks |
| Classified | Current and non-current blocks on each side | Lender packs, ratio analysis, annual reporting |
| Statement of financial position | IFRS title for the same statement, same equation | Reporters who follow IFRS and need editable labels |
Worked Example: Seven Steps for a Fictional Coffee Roaster
In this illustrative example, Harbor Street Coffee Roasters, a fictional company with assumed US dollar amounts, builds a classified balance sheet at 31 December 2025, with 2024 for comparison.
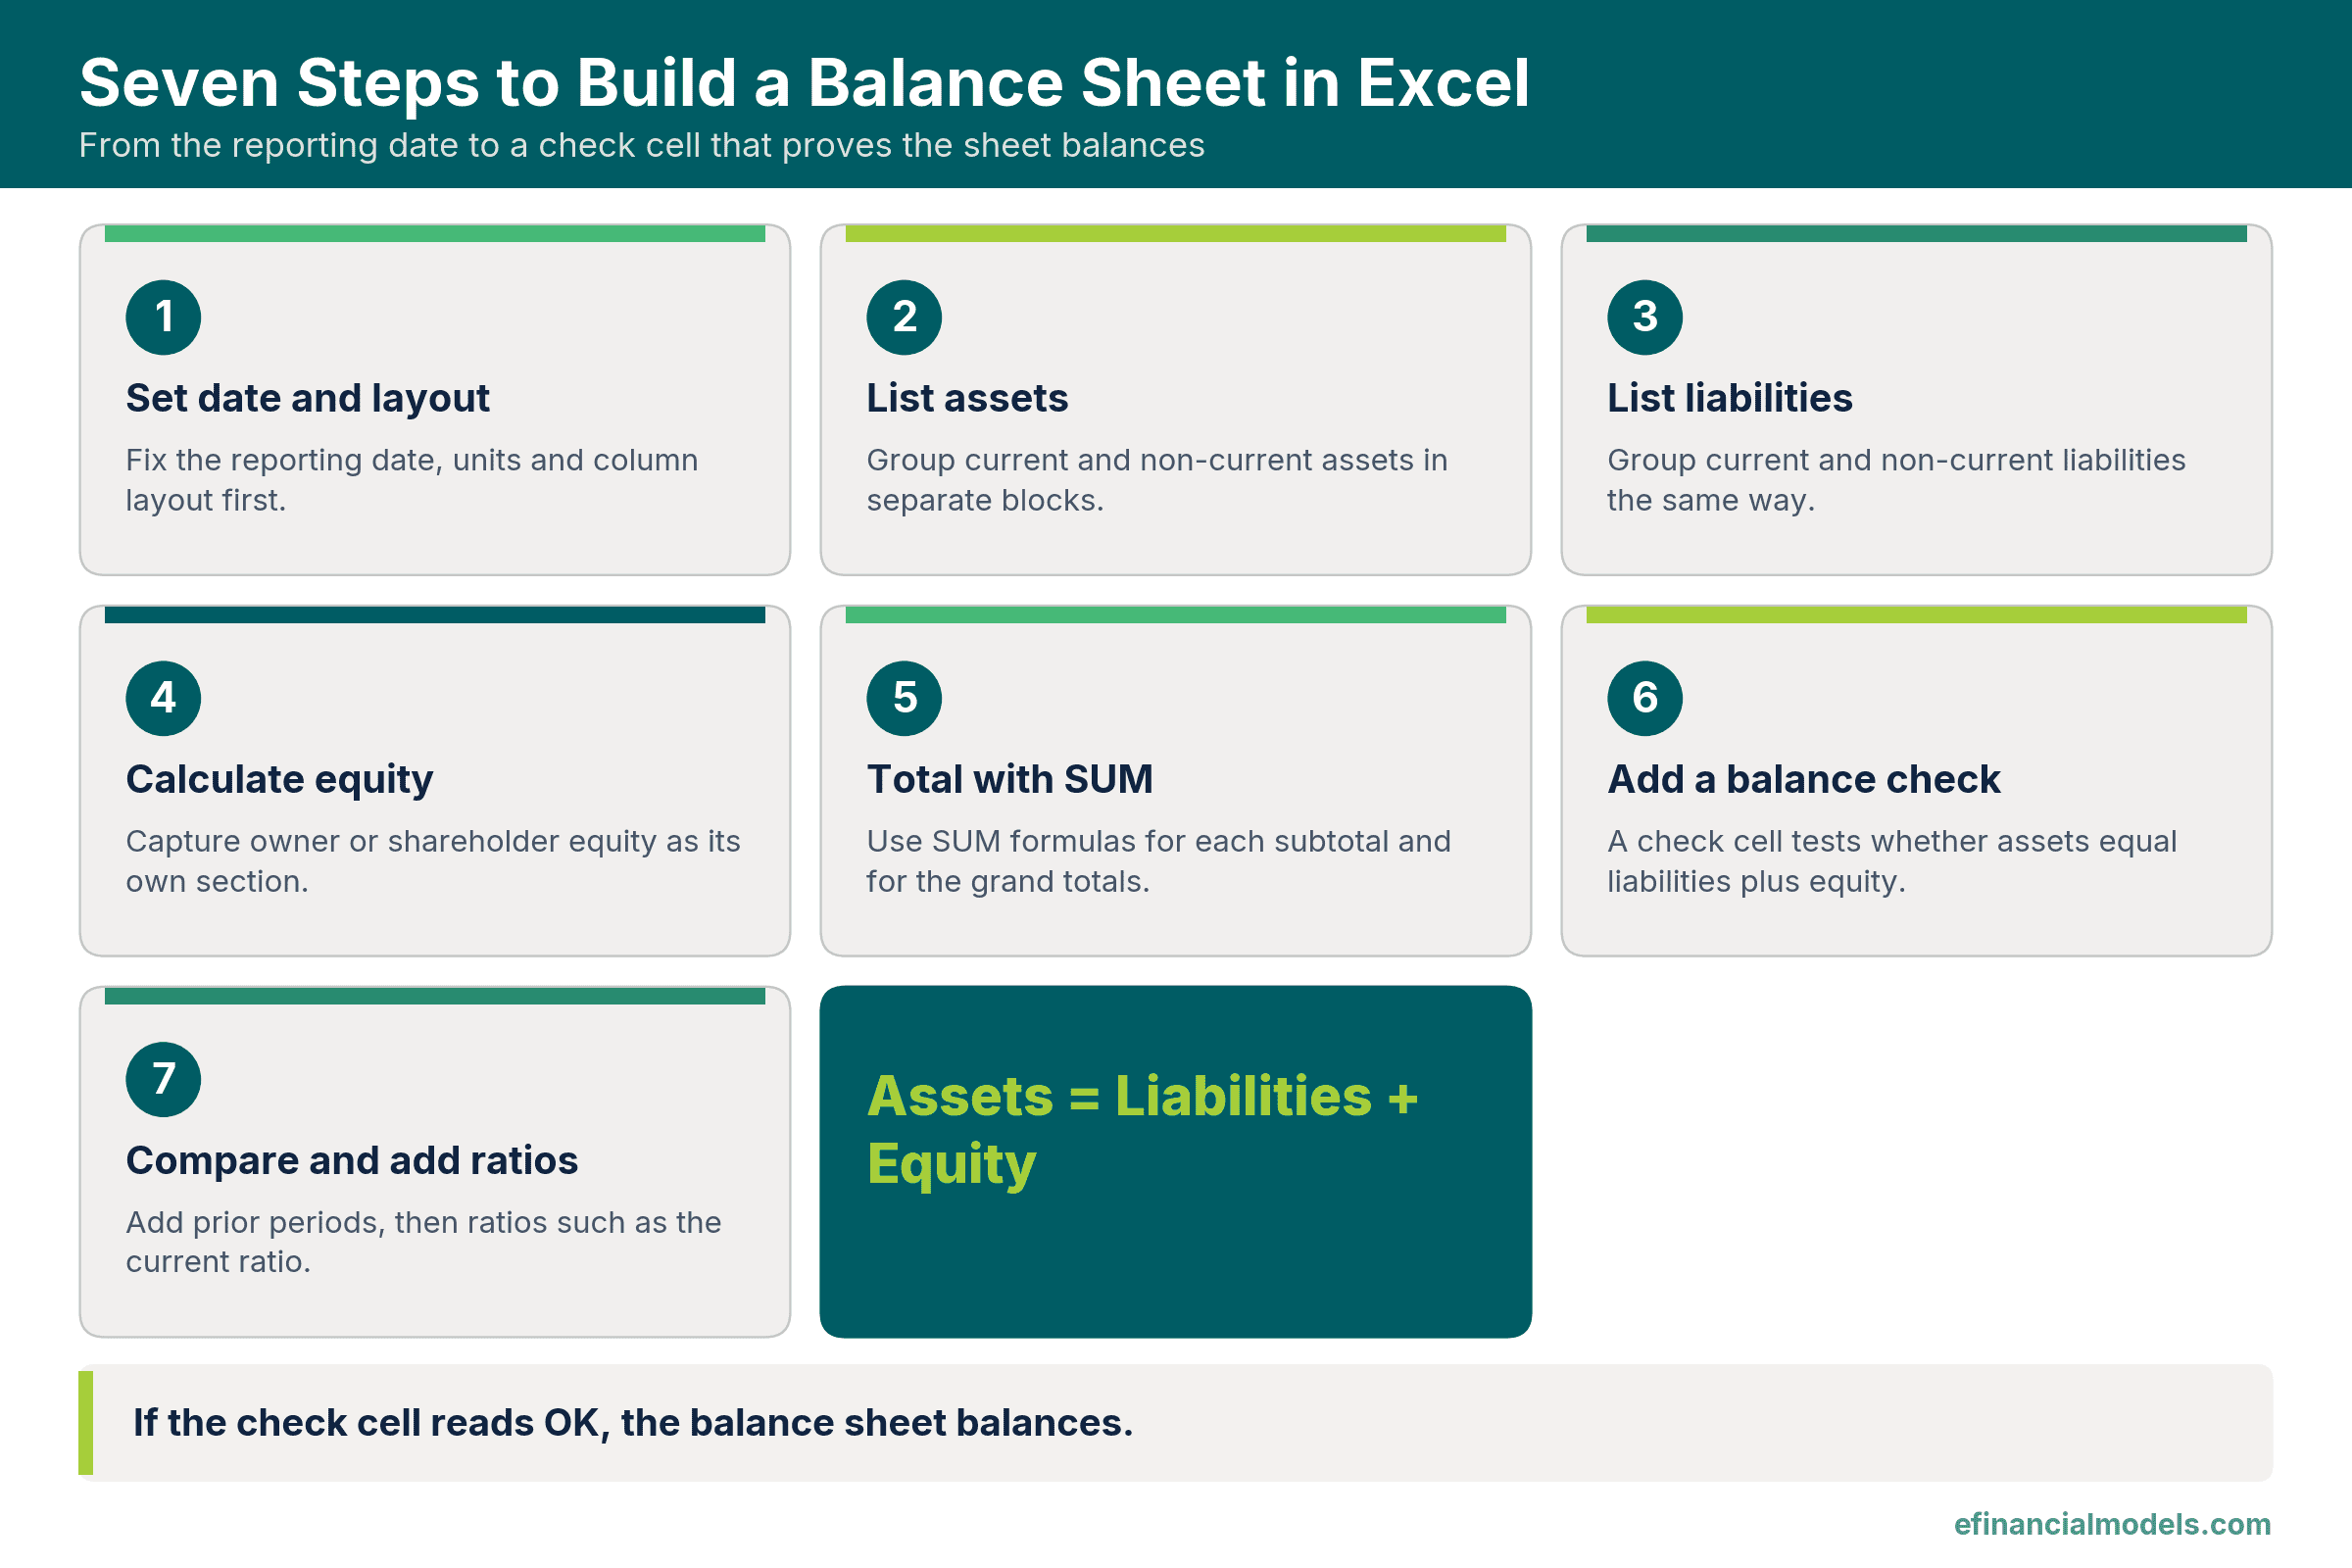
The seven steps in order; the check cell at step six shows whether the sheet balances.
Step 1: Set the reporting date and layout
Column A holds the line labels, column B holds 31 December 2025 and column C holds 31 December 2024, so a new period is one more column. Excel named ranges label the three blocks as inputs, calculation and results, which Microsoft Support says makes formulas easier to understand and maintain; the formulas use plain cell references.
Step 2: List current and non-current assets
Current assets are listed from the most liquid, meaning the easiest to turn into cash. At 31 December 2025 the example holds cash of 85,000, accounts receivable of 62,000, inventory of 78,000 and prepaid expenses of 9,000. Accumulated depreciation, the part of an asset’s cost already charged as depreciation, is entered as a positive input and subtracted. The subtotals follow in four lines:
- Total current assets: 85,000 plus 62,000 plus 78,000 plus 9,000 equals 234,000.
- Net property and equipment: 320,000 of cost minus 120,000 of accumulated depreciation equals 200,000.
- Total non-current assets: 200,000 plus 25,000 of intangible assets equals 225,000.
- Total assets: 234,000 plus 225,000 equals 459,000.
Step 3: List current and non-current liabilities
The example shows accounts payable of 48,000, accrued expenses of 21,000 and the current portion of debt of 30,000, so total current liabilities are 99,000. Long-term debt of 140,000 is non-current, which makes total liabilities 239,000.
Step 4: Calculate equity
Equity is made of owner’s capital of 100,000 and retained earnings of 120,000, the profit kept in the business. Total equity is 220,000. Retained earnings rose by 49,000 from 71,000.
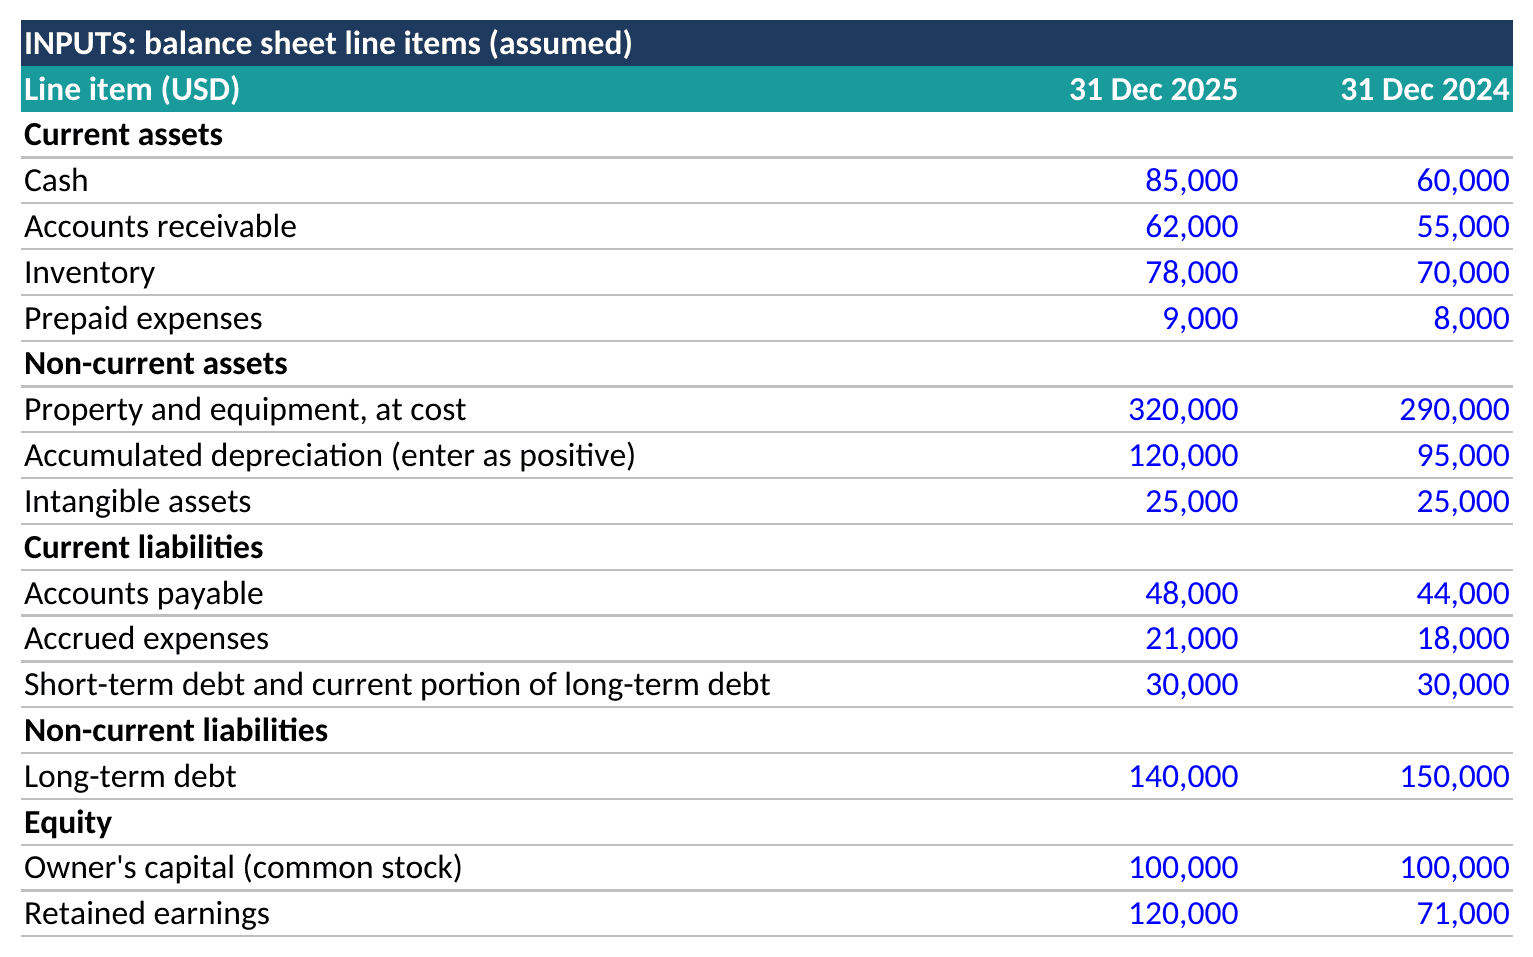
Blue cells are the only typed numbers; everything below is calculated from them. Source: eFinancialModels Analysis
Step 5: Total every block with SUM formulas
SUM is the Excel function that adds individual values, cell references, ranges or a mix of all three, according to Microsoft Support. Total current assets use =SUM(B7:B10), net property and equipment use =B12-B13, and total assets add the current and non-current totals.
Step 6: Add a balance check cell
The check cell compares the two totals and prints a word. IF is Excel’s logical test function, described by Microsoft Support. CHECK is the warning word the sheet prints when the totals differ, and OK is the word it prints when they match. ROUND is the function that rounds a number to a set number of decimals. The formula =IF(ROUND(B30-B34,2)=0,"OK","CHECK") rounds the difference to two decimals first, so tiny floating-point gaps raise no alarm.
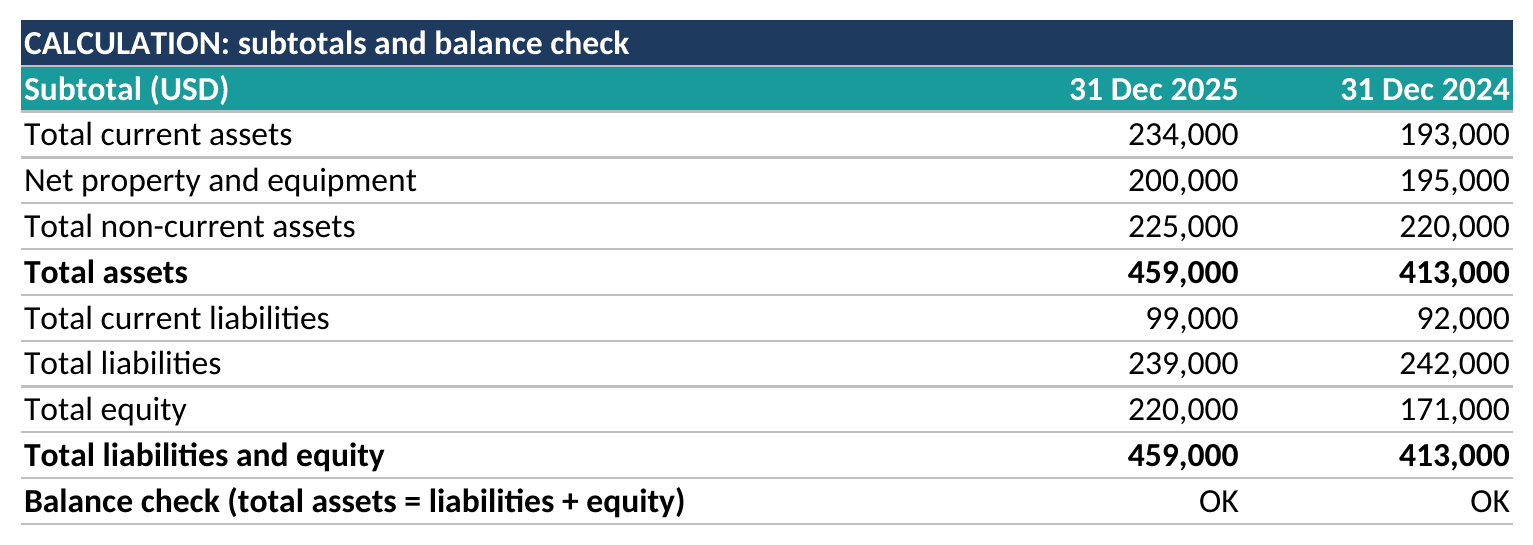
The check row confirms that assets equal liabilities plus equity before any ratio is read. Source: eFinancialModels Analysis
Step 7: Compare periods and add ratios
At 31 December 2024 the same lines give total current assets of 193,000, total assets of 413,000, total current liabilities of 92,000, total liabilities of 242,000 and total equity of 171,000. Working capital, which is current assets minus current liabilities, is 234,000 minus 99,000, or 135,000 in 2025, against 193,000 minus 92,000, or 101,000, in 2024. The current ratio, current assets divided by current liabilities, is 2.36 against 2.10. Debt-to-equity, measured here in its broad form as total liabilities divided by total equity, fell from 1.42 to 1.09 because total liabilities eased from 242,000 to 239,000 while equity grew by 49,000, from 171,000 to 220,000. The equity ratio, total equity divided by total assets, rose from 41.4% to 47.9%, and total assets grew from 413,000 to 459,000, an increase of 46,000, or 11.1%.
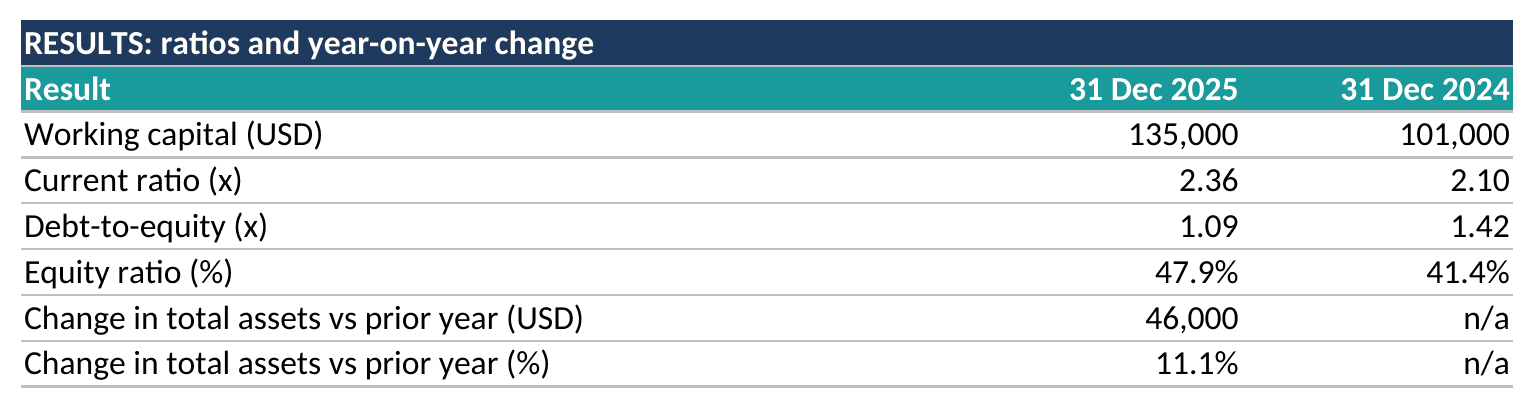
Ratios and the change in total assets are formulas that update whenever an input changes. Source: eFinancialModels Analysis
Data Validation and SUMIFS Make the Sheet More Reliable
Raymond Panko’s review of spreadsheet research, posted to arXiv in 2008, reports that early field audits found errors in 24% of the 367 spreadsheets audited. Two safeguards are worth building in. First, data validation restricts the type of data or the values entered into a cell. Second, SUMIFS is the function that adds all arguments meeting multiple criteria, as Microsoft Support explains, and it lets a ledger export feed each line by account code.
Templates Compared: Manual Builds, Free Files and Purpose-Built Models
| Approach | Strength | Limit |
|---|---|---|
| Manual build | Every formula is visible and tailored | Setup time and error risk fall on the builder |
| Free downloadable template | Fast start with a standard layout | Fixed lines that may not fit an industry |
| Accounting export | Actual balances from the ledger | Layout and checks stay outside the workbook |
| Purpose-built model | Balance sheet fed by forecasts and checks | Needs its assumptions reviewed before use |
Owners who want the balance sheet to feed a forecast can browse the three statement model tag or the accounting category on eFinancialModels.
Frequently Asked Questions
How is a balance sheet different from an income statement?
A balance sheet is a snapshot of financial position on one date, while an income statement covers a period and shows revenue less costs. In Excel the two usually sit on separate sheets, with net profit from the income statement flowing into retained earnings, so a profit that never reaches equity is a common reason a balance sheet fails to balance.
How often should the workbook be updated?
A month-end refresh suits most owners, because monthly balances reveal drift in cash, receivables and debt early, while the reporting frequency a lender expects depends on the loan agreement. Saving one dated copy per close also keeps a clear audit trail for accountants. Each update adds a column and needs an OK in the check cell before any ratio reaches a report or dashboard.
Why does the check cell show CHECK when the numbers look right?
The usual causes are a total range that misses a new row, accumulated depreciation typed with the wrong sign, a text value stored in an amount cell, or a rounding gap that appears when inputs come from a ledger export with cents. A difference that exactly equals one input usually points to a row left outside a SUM range, and a difference of exactly twice an input points to a sign error.
Can one workbook show both US GAAP and IFRS labels?
Yes, provided the figures themselves are identical and only the presentation differs. A label column can hold a US GAAP title in one cell and an IFRS title in another, with a selector cell choosing which set prints. Measurement differences between the two frameworks are a separate task that needs an accountant, because a relabelled sheet does not restate any amounts.
Can the same template serve different industries?
The skeleton transfers well, because the equation, the check cell and the current and non-current split never change. What changes is the line list: stock-holding businesses need inventory detail, subscription businesses need deferred revenue, and asset-heavy businesses need fixed asset classes. Keeping the line labels in editable input cells lets one structure serve several industries without rewriting formulas, so a retailer, a software company and a manufacturer can share one skeleton.
Conclusion
A reliable balance sheet in Excel needs a classified layout, separated inputs, SUM formulas and a check cell that must read OK before anyone reads a ratio. Readers who want spreadsheet templates to build on can browse the eFinancialModels General Financial Model Bundle, a collection of Excel financial model templates.