0 ITEMS

Investment Decision Criteria: 6 Numbers That Matter

An investment is worth making when it earns more than the hurdle rate, returns its cash before the business runs short, and still passes when the forecast turns out wrong. Six numbers test those conditions, a hurdle rate that sets the bar and five measures, most of them judged against it, and in the illustrative example below a 250,000 USD expansion passes in the base case, yet a 26.01 percent cut to every inflow would take its net present value to zero.
Key Takeaways
- Net present value (NPV) decides whether a project adds value; accept it only when NPV is positive at a justified hurdle rate.
- In the illustrative example, the internal rate of return (IRR) is 22.5 percent against a 12.0 percent hurdle rate, and NPV is 87,899.79 USD.
- Payback takes 3.32 years in the illustrative base case, but discounted payback takes 4.31 years, so the simple measure flatters the project.
- Sensitivity tests set the safety margin: a 26.01 percent cut to every inflow, residual value included, takes the illustrative NPV to zero at 12.0 percent.
- Forecasts run optimistic, so cut expected inflows by an illustrative 20 percent, add a 15 percent cost overrun and rerun the five measures.
Six Numbers Answer Six Different Questions
The infographic lists the six numbers in the order this guide covers them, and each answers a different question about the investment.
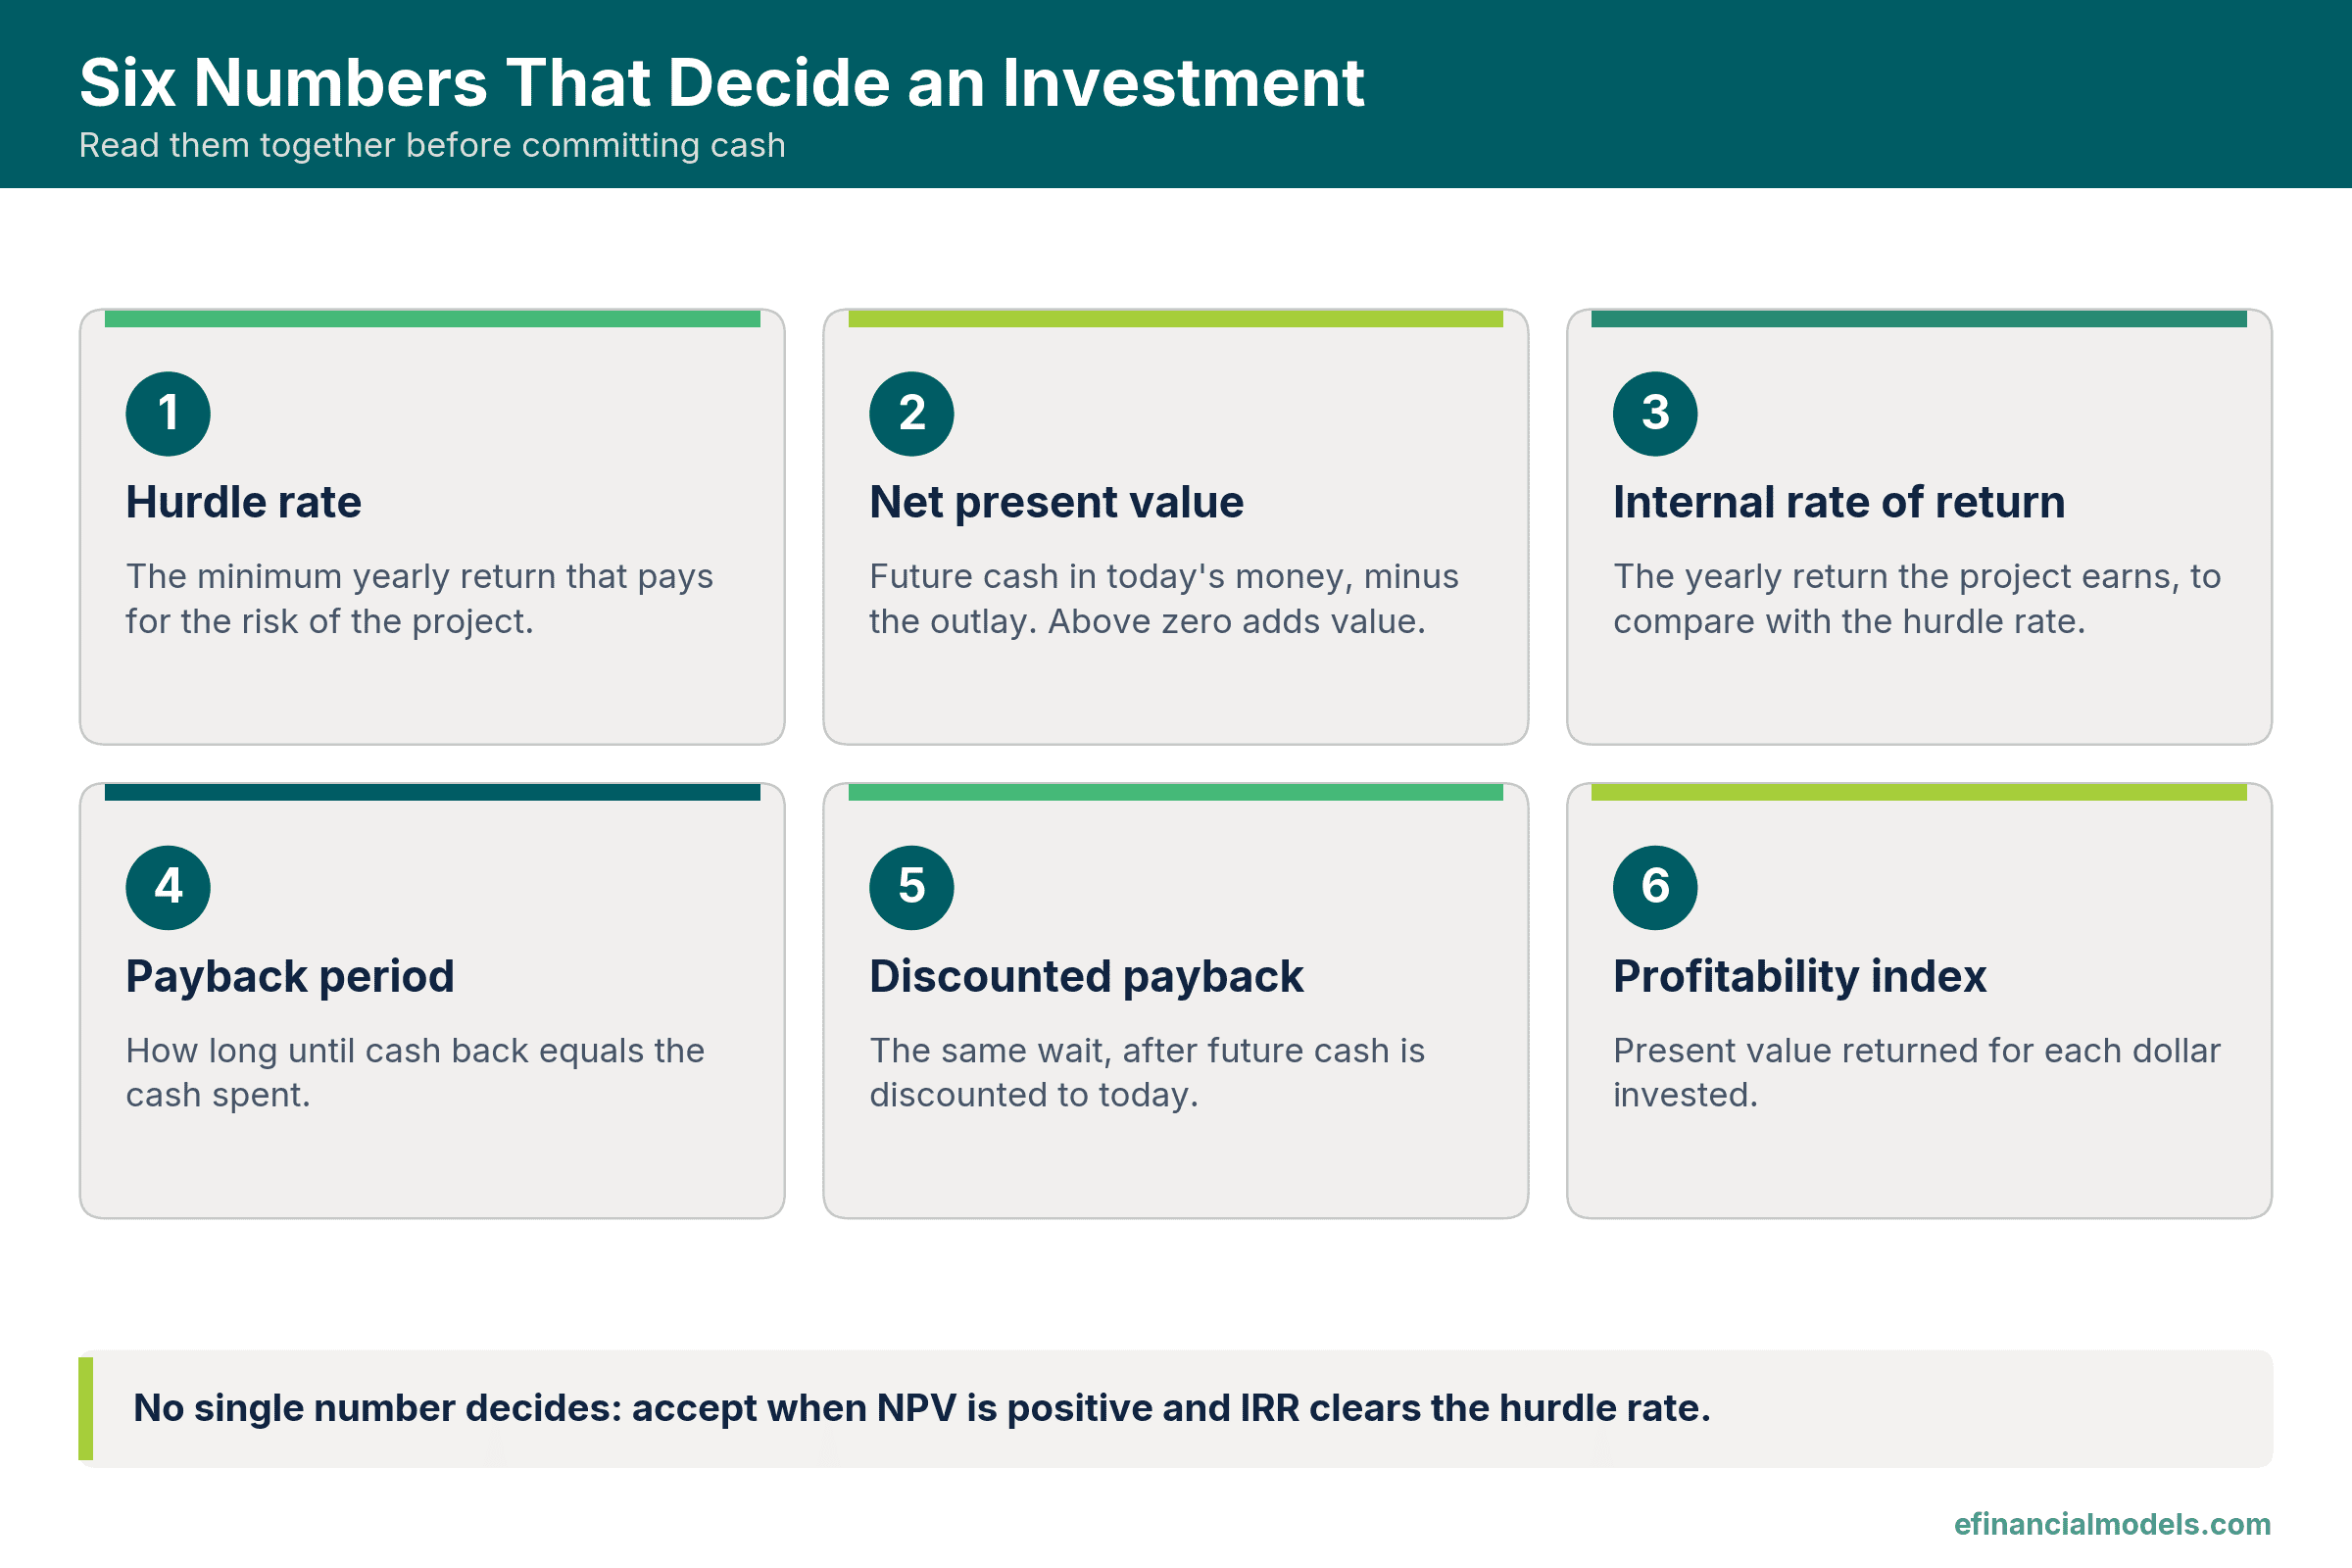
Each criterion answers a different question, so the six are read together.
The Hurdle Rate Sets the Bar for Most Other Numbers
The hurdle rate is the minimum yearly return an owner requires before accepting a project, and it is used as the discount rate, the rate that converts future cash into today’s money. It starts from the cost of capital, which is the return that lenders and owners expect for funding the business, and that in turn builds on the risk-free rate, which is the yield on a government bond.
Benchmarks help set the floor: the yield on a government bond of similar life is the starting point, and a growth-stage business adds premiums for its own size and project risk, because its cash flows are less diversified than those of a listed company.
Padding the bar has a price: a hurdle rate higher than justified leaves good investments untaken, so the premiums should be argued, not rounded up.
Net Present Value Shows How Much Value a Project Adds
Net present value (NPV) is the sum of a project’s future net cash inflows, each discounted at the hurdle rate, minus the initial investment. A positive NPV means the project earns more than the hurdle rate and adds that amount of value; a negative NPV means it destroys value. The Rice University textbook Principles of Finance defines NPV as the present value of a project’s cash inflows minus the present value of its cash outflows.
NPV is the only one of the six numbers measured in money, so it serves as the primary decision rule, using the incremental after-tax cash the project itself creates.
Internal Rate of Return Compares the Project With the Hurdle Rate
The internal rate of return (IRR) is the discount rate at which a project’s NPV equals zero, so it is a yearly percentage, not a profit amount. A project passes when its IRR is above the hurdle rate, and the gap is its margin of safety. The same Principles of Finance glossary gives that definition.
The measure has a known flaw. A project can have only one NPV but more than one IRR. Multiple IRRs appear when cash flows change sign more than once, which makes NPV the safer tie-breaker. eFinancialModels lists internal rate of return models for comparison.
Payback and Discounted Payback Measure Time, Not Value
The payback period is the time until cumulative cash inflows equal the initial investment, and the discounted payback period is the same wait counted after each inflow is discounted at the hurdle rate. Both ignore cash that arrives after the recovery point, so they screen risk rather than measure value. eFinancialModels lists payback period templates for this screen.
Time matters because cash is contested. The Federal Reserve Banks’ 2026 Report on Employer Firms, which reports findings from the 2025 Small Business Credit Survey, found that the most common reasons US small employer firms sought financing were to meet operating expenses (56 percent) and to pursue an expansion or new opportunity (46 percent).
The Profitability Index Ranks Projects When Cash Is Limited
The profitability index is the present value of a project’s cash inflows divided by the present value of its cash outflows, as the same glossary defines it. A value above 1.0 means NPV is positive, and a higher value means more value per dollar invested. When cash covers only some of several positive projects, ranking by this index tends to select the set that uses scarce cash best.
Sensitivity Analysis Tests Whether the Forecast Can Be Wrong
Sensitivity analysis is the practice of changing one input at a time, such as inflows, cost or the hurdle rate, to see which results flip from accept to reject. It matters because forecasts lean optimistic. The UK Treasury’s Green Book describes optimism bias as the proven tendency for appraisals to be over-optimistic about key assumptions.
The direction of that error is the lesson: costs tend to rise and benefit assumptions tend to be too rosy, so a cut in inflows and a cost overrun belong in every review.
Worked Example: A 250,000 USD Expansion Under Four Scenarios
In this illustrative example, a growth-stage manufacturer spends 250,000 USD at year 0 on equipment and fit-out. The project adds net cash inflows after tax of 55,000, 75,000, 90,000, 95,000, 95,000 and 80,000 USD in years 1 to 6, plus 20,000 USD of residual value, the resale value of the equipment, in year 6. The hurdle rate is 12.0 percent, and the owner can fund a wait of at most 5.0 years, applied to both payback measures. All figures are nominal, arrive at year end and exclude working capital, the cash tied up in stock and receivables. Three stress scenarios follow the base case: operating inflows 20 percent lower with the residual value unchanged, an investment 15 percent higher and a 16.0 percent hurdle rate. NPV figures are shown to the cent. The stress sizes are illustrative, and an owner should size them from the business’s own past forecast misses.
The workbook keeps inputs, calculations and results on three separate sheets.
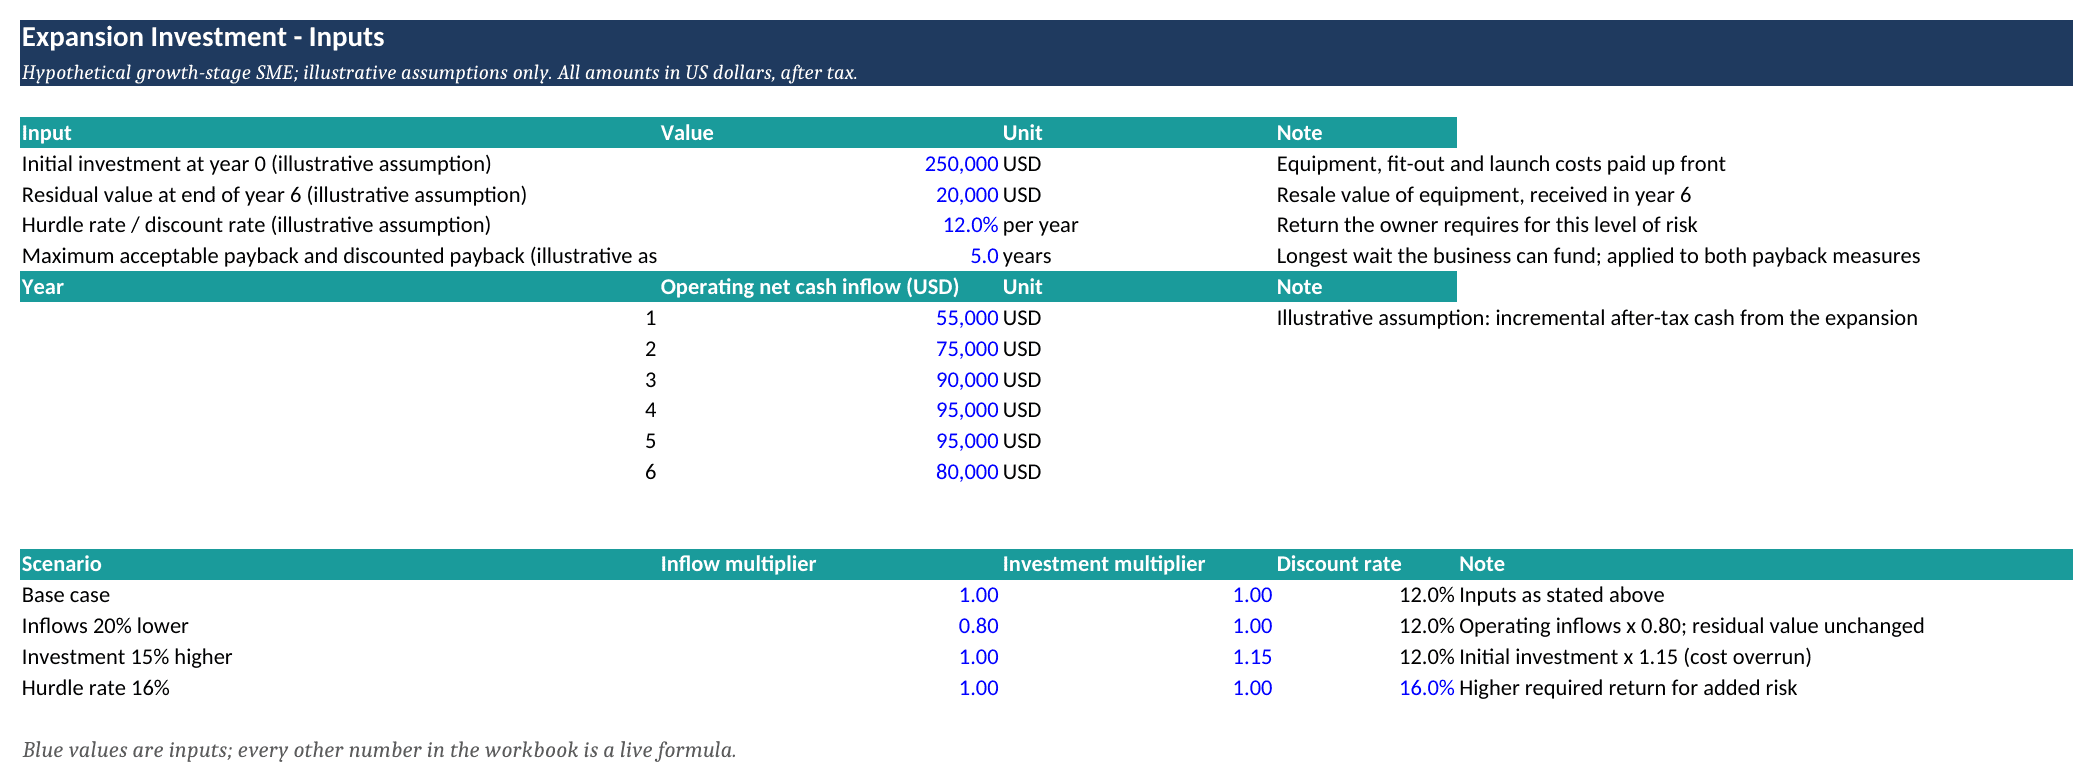
Inputs for the expansion example, with blue cells as the only hard-coded numbers.
Each cash flow is divided by 1 plus the discount rate, raised to the year number.
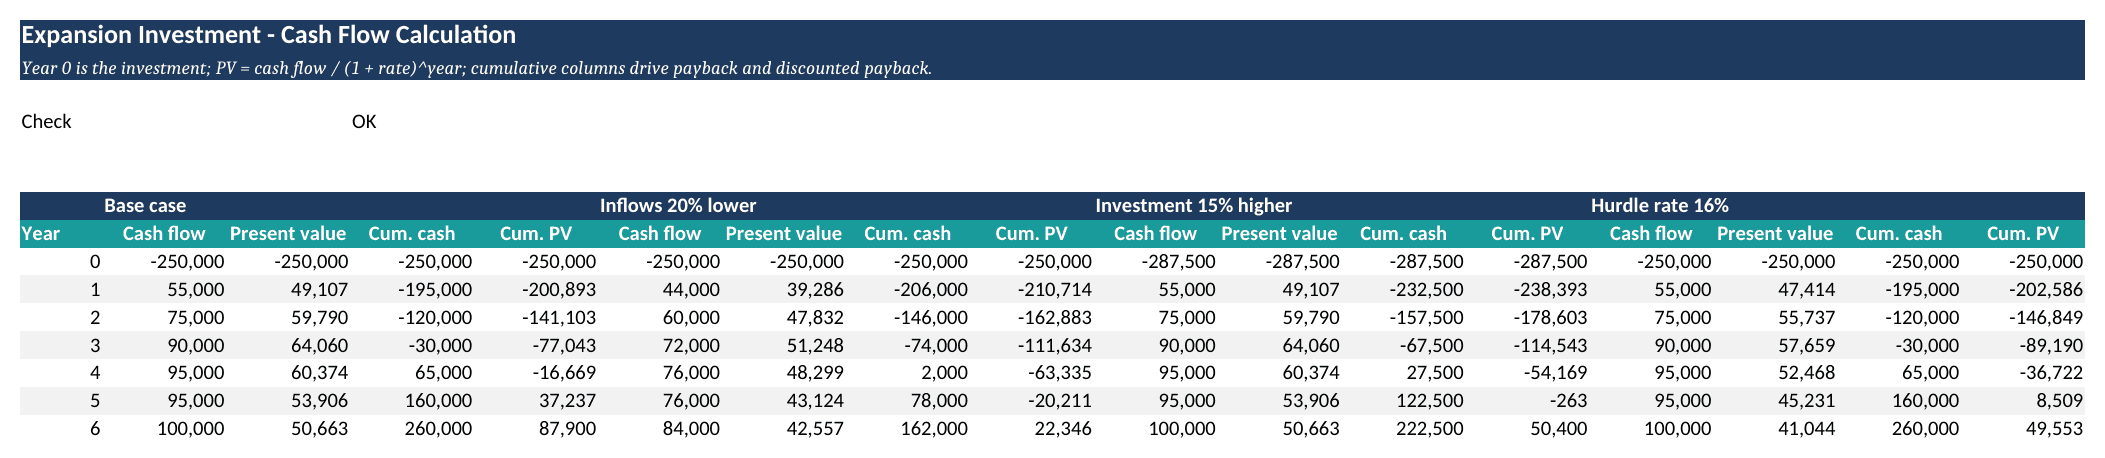
Year-by-year cash flows and present values that feed every criterion.
In the base case, the project has an NPV of 87,899.79 USD, an IRR of 22.5 percent, a payback of 3.32 years, a discounted payback of 4.31 years and a profitability index of 1.35. After year 3 the project is still 30,000 USD short, and the 95,000 USD inflow of year 4 closes that gap 0.32 of the way through the year.
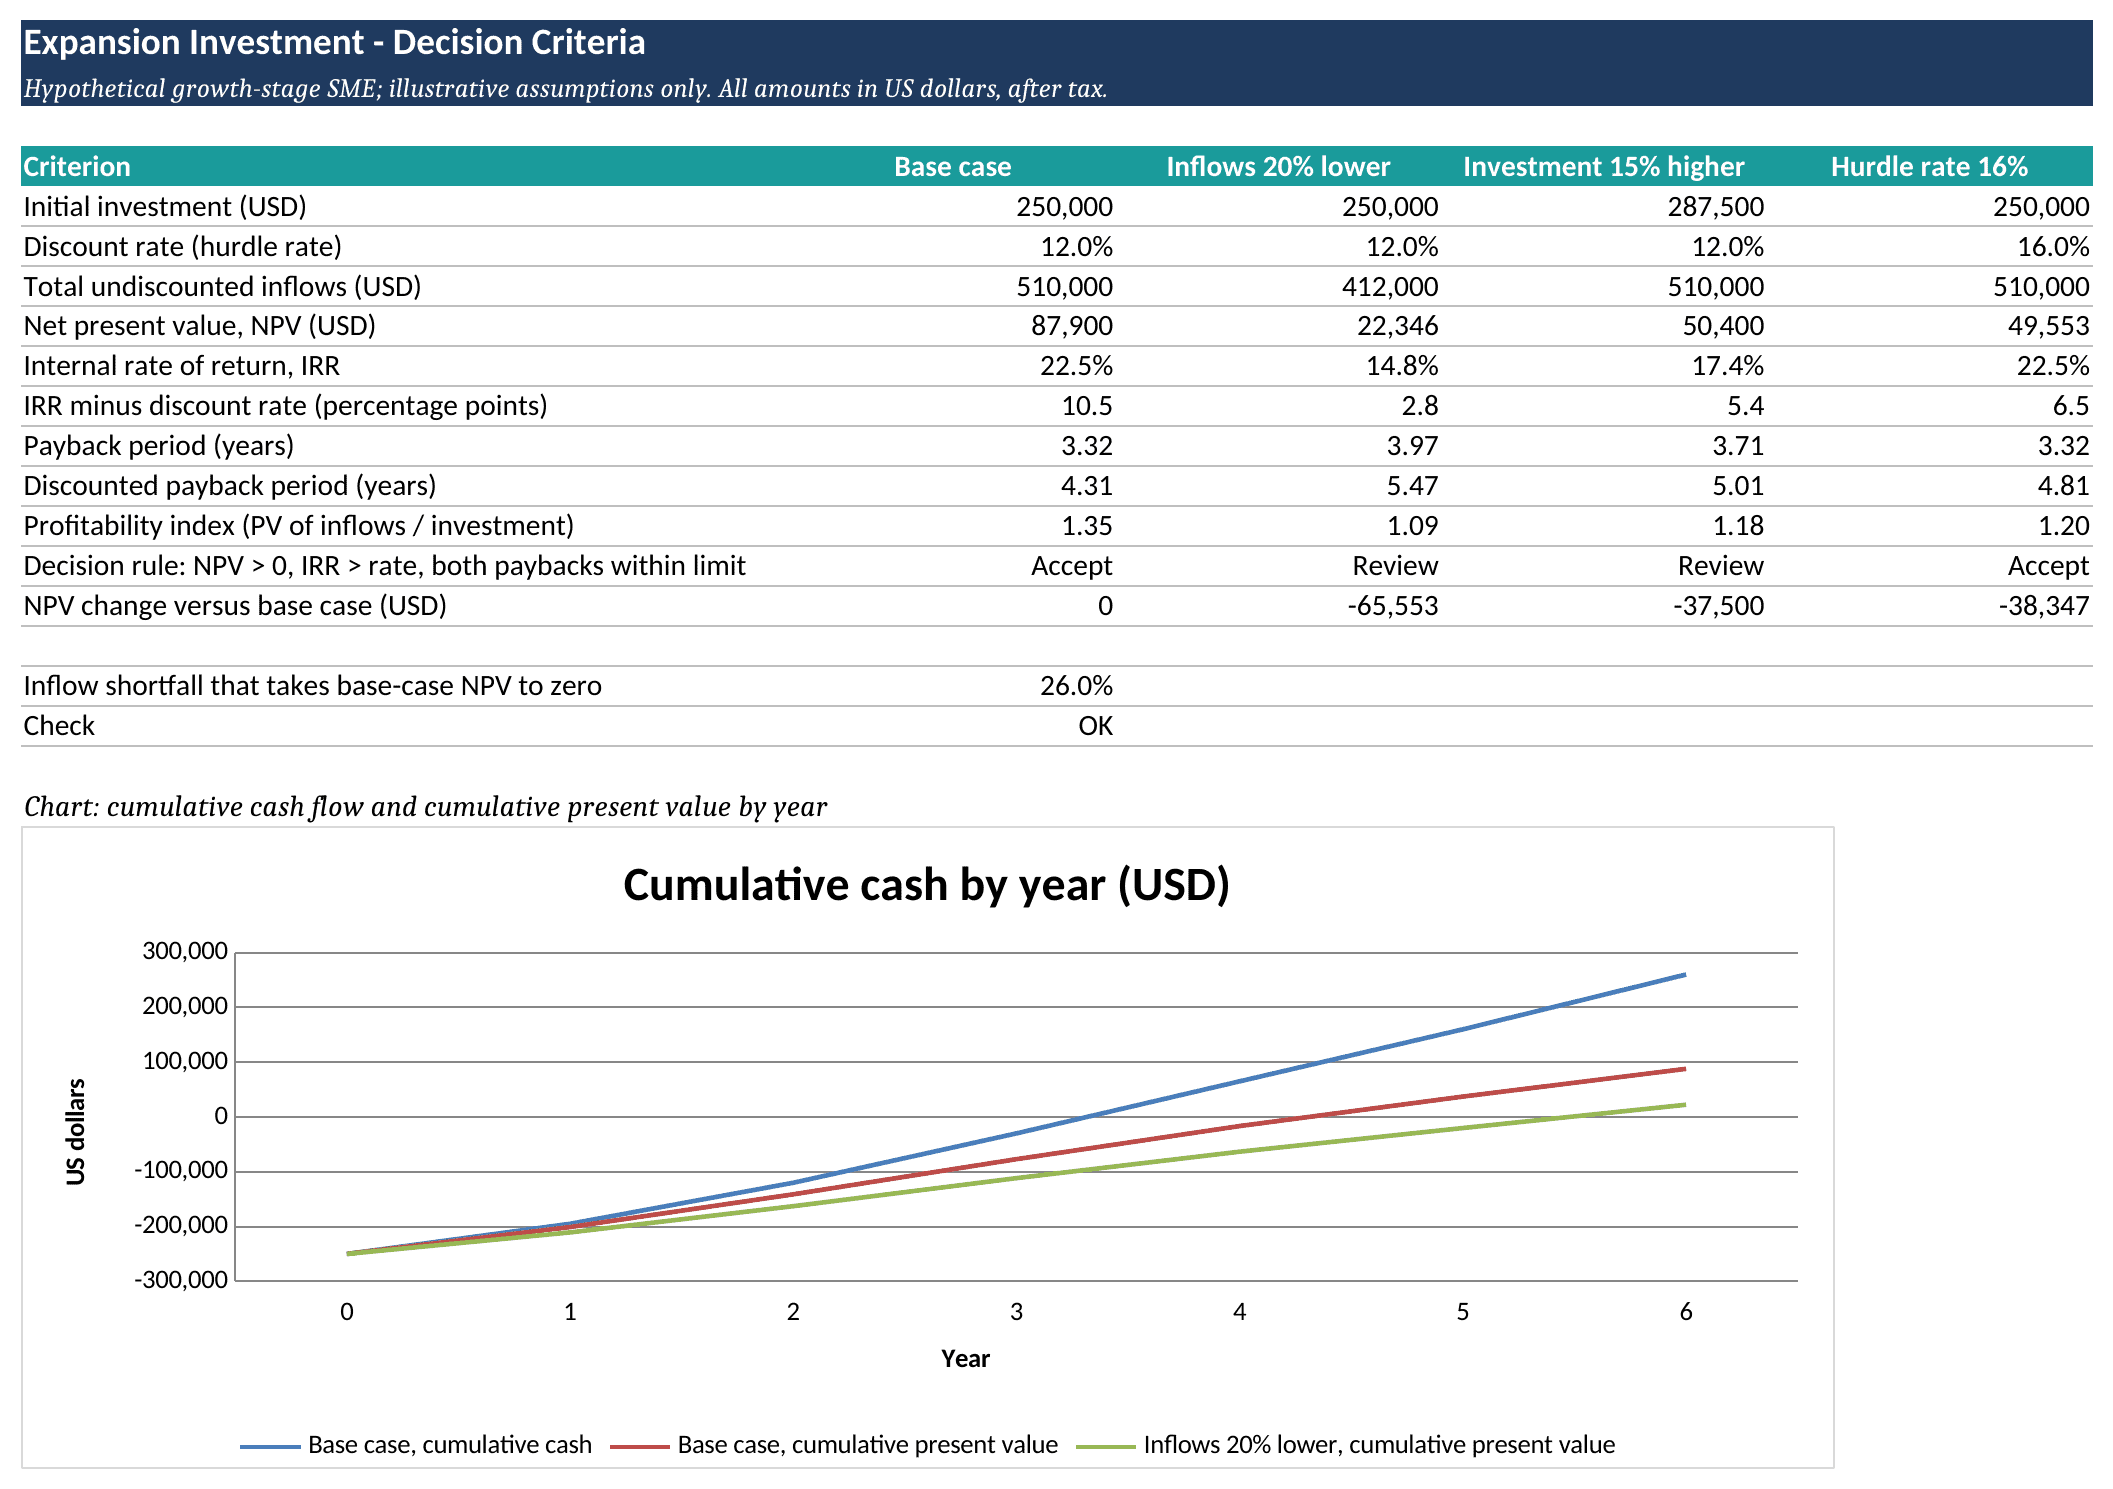
Decision criteria for each scenario, with the check cell reading OK.
| Criterion | Base case | Inflows 20% lower | Investment 15% higher | Hurdle rate 16% |
|---|---|---|---|---|
| NPV | 87,899.79 USD | 22,346.35 USD | 50,399.79 USD | 49,552.82 USD |
| IRR | 22.5% | 14.8% | 17.4% | 22.5% |
| Payback (years) | 3.32 | 3.97 | 3.71 | 3.32 |
| Discounted payback (years) | 4.31 | 5.47 | 5.01 | 4.81 |
| Profitability index | 1.35 | 1.09 | 1.18 | 1.20 |
| NPV above zero, IRR above hurdle rate, both paybacks within 5.0 years | Accept | Review | Review | Accept |
All four scenarios have a positive NPV and an IRR above the hurdle rate, but two exceed the 5.0-year limit on discounted payback, so they need review: a positive NPV does not guarantee the cash horizon fits. The IRR cushion over the hurdle rate falls from 10.5 percentage points in the base case to 2.8 points when inflows are 20 percent lower, and NPV drops to 22,346.35 USD. A 15 percent cost overrun cuts NPV to 50,399.79 USD, and a 16.0 percent hurdle rate cuts it to 49,552.82 USD, while payback stays at 3.32 years because it ignores the rate. Base-case NPV reaches zero when every inflow, residual value included, falls by 26.01 percent.
Frequently Asked Questions
Which criterion should win when NPV and IRR disagree?
NPV should win in most cases, because it measures value added in dollars at a stated hurdle rate. IRR can rank a small project above a larger one that creates more money, and it implicitly assumes interim cash is reinvested at the IRR itself, which is rarely realistic. When two options exclude each other, compare their NPVs at one common rate, then use IRR only to see the margin.
What hurdle rate should a growth-stage business use?
Build it in layers rather than copying a listed-company figure. Start with the yield on a government bond of similar life, add a premium for business risk and another for the risk of this project, and compare the result with the borrowing cost of the loan that would fund it. The bar should never sit below that cost. For illustration, an assumed 5 percent bond yield plus 3 points for business size and 4 points for project risk gives the 12 percent used in the example; a lender or accountant can confirm the premiums.
Should financing, tax and inflation sit inside the cash flows?
Tax belongs in the cash flows, and financing does not. Use the incremental after-tax cash the project creates, and leave out interest and loan repayments, because the hurdle rate already charges for the money used. Counting both would penalise the project twice. Incremental working capital, the cash tied up in stock and receivables, is an outflow at the start that returns at the end, and a real appraisal includes it. Keep inflation consistent as well: nominal cash flows, which include price increases, take a nominal rate, and real cash flows take a real rate. Lease-versus-buy choices and tax depreciation allowances sit outside this guide, and an accountant is the person to ask.
Conclusion
An investment is worth it when NPV is positive at a justified hurdle rate, the IRR leaves a real margin above it, both paybacks fit the cash the business can spare, and the result survives a pessimistic forecast. Readers can run these numbers on their own project with the Net Present Value Calculator in Excel from eFinancialModels, which needs a cash flow forecast, a discount rate and a forecast period to calculate the net present value in USD.