0 ITEMS

What Investors Want to See in a Financial Model by Type

Investors want a financial model that shows revenue, costs, cash flow, assumptions, sensitivities and exits clearly, then weighs each part by what their own capital needs: runway for angels, scale for venture funds, cash generation for private equity and repayment capacity for banks. This guide compares 17 investor types, explains four in depth and builds a $500,000 seed-raise example in Excel.
Key Takeaways
- Investors check the same seven components, with repayment scenarios replacing exit scenarios for lenders, and clear presentation decides whether the model gets read.
- Emphasis differs: angels read runway, venture funds read unit economics, private equity reads earnings and debt capacity, and banks read repayment capacity.
- Check size, investment horizon and control change what a model must show, so choose the target investor first.
- In the example, a $500,000 raise returns 6.0x over six years to an angel and 7.5x over eight to a venture fund.
- In a Federal Reserve survey of US small employer firms, 42% of 2025 financing applicants received the full amount sought.
Investor expectations matter because most small firms struggle to raise capital
Capital is not easy for small firms to secure. In the Federal Reserve Banks’ 2025 survey of US small employer firms, 60% of firms sought financing, 38% applied for a loan, line of credit or merchant cash advance, and 42% of applicants received the full amount they sought, according to the Federal Reserve Banks’ 2026 Report on Employer Firms.
Every investor expects seven core model components
Seven components form the baseline that all investors check:
- Revenue projections estimate future sales from drivers such as customers and price.
- Cost structure separates fixed from variable costs, so margins and break-even show.
- Cash flow forecast shows cash in and out by period and sets the runway.
- Key assumptions sit in labelled cells that investors can challenge.
- Sensitivity analysis is a test of how results change when one assumption moves.
- Exit scenarios show how investors get cash back, or how lenders get repaid, at low, base and high values.
- Presentation clarity means a summary sheet, stated units and a reconciling check.
Investor type comparison: what each investor prioritises
Check size is the amount one investor commits. Investment horizon is how long the investor holds: short means under three years, medium three to seven years and long more than seven. Control is the say over decisions, through board seats or loan covenants. Structure is the instrument, such as shares, convertible notes or debt, and target returns are the returns the investor needs from it.
Check sizes are relative to typical rounds at each stage, which Crunchbase News tracks: small means below a typical seed round, mid means up to a typical Series A round, large means above that and very large means several times that. These are total round sizes, used only as a scale rather than one investor’s cheque. Venture capital (VC) funds back young growth companies, private equity (PE) funds buy mature ones, and impact investors weigh environmental, social and governance (ESG) results alongside return.
| Investor type | Check size | Stage focus | Horizon | Control | What the model must show |
|---|---|---|---|---|---|
| Angel investors | Small | Pre-seed, seed | Medium | Low | Founder credibility, burn, use of funds |
| Venture capital funds | Mid | Seed to growth | Long | Board seat | Unit economics, growth drivers, exit size |
| Family offices | Mid to large | Any, often later | Long | Moderate | Cash yield, downside, governance |
| Private equity funds | Very large | Mature companies | Medium | High | Earnings, cash generation, debt capacity |
| Corporate investors | Mid to large | Growth | Medium | Moderate to high | Strategic fit, synergies |
| Sovereign wealth funds | Very large | Mature, infrastructure | Long | Low to moderate | Stable cash flow, governance |
| Pension funds | Very large | Mature, funds | Long | Low | Steady yield, risk limits |
| Endowments and foundations | Large | Funds, growth | Long | Low | Long-run return, fees, liquidity |
| Infrastructure funds | Very large | Operating assets | Long | Moderate | Contracted cash flow, debt service |
| Private credit funds | Large | Established firms | Short to medium | Covenants | Cash coverage, collateral, downside |
| Hedge funds | Large | Liquid or listed | Short | Low | Valuation gaps, catalysts, liquidity |
| Distressed investors | Large | Troubled firms | Short to medium | High | Recovery value, restructuring plan |
| Secondary market investors | Large | Existing stakes | Short to medium | Low | Holding valuation, cash timing |
| Corporate venture capital | Mid | Seed to growth | Medium | Low to moderate | Strategic fit, growth, exit path |
| Impact and ESG investors | Small to large | Seed to mature | Medium to long | Low to moderate | Measurable impact beside return |
| Crypto and digital-asset funds | Mid | Early token or equity | Short to medium | Low | Token economics, runway, liquidity |
| Bank lenders | Varies by loan | Established firms | Short to medium | Covenants | Repayment capacity, liquidity, collateral |
The table shows typical practice, and ranges vary by mandate and country. Founders will realistically meet angels, venture funds, corporate investors and banks; the other rows are shown for context.
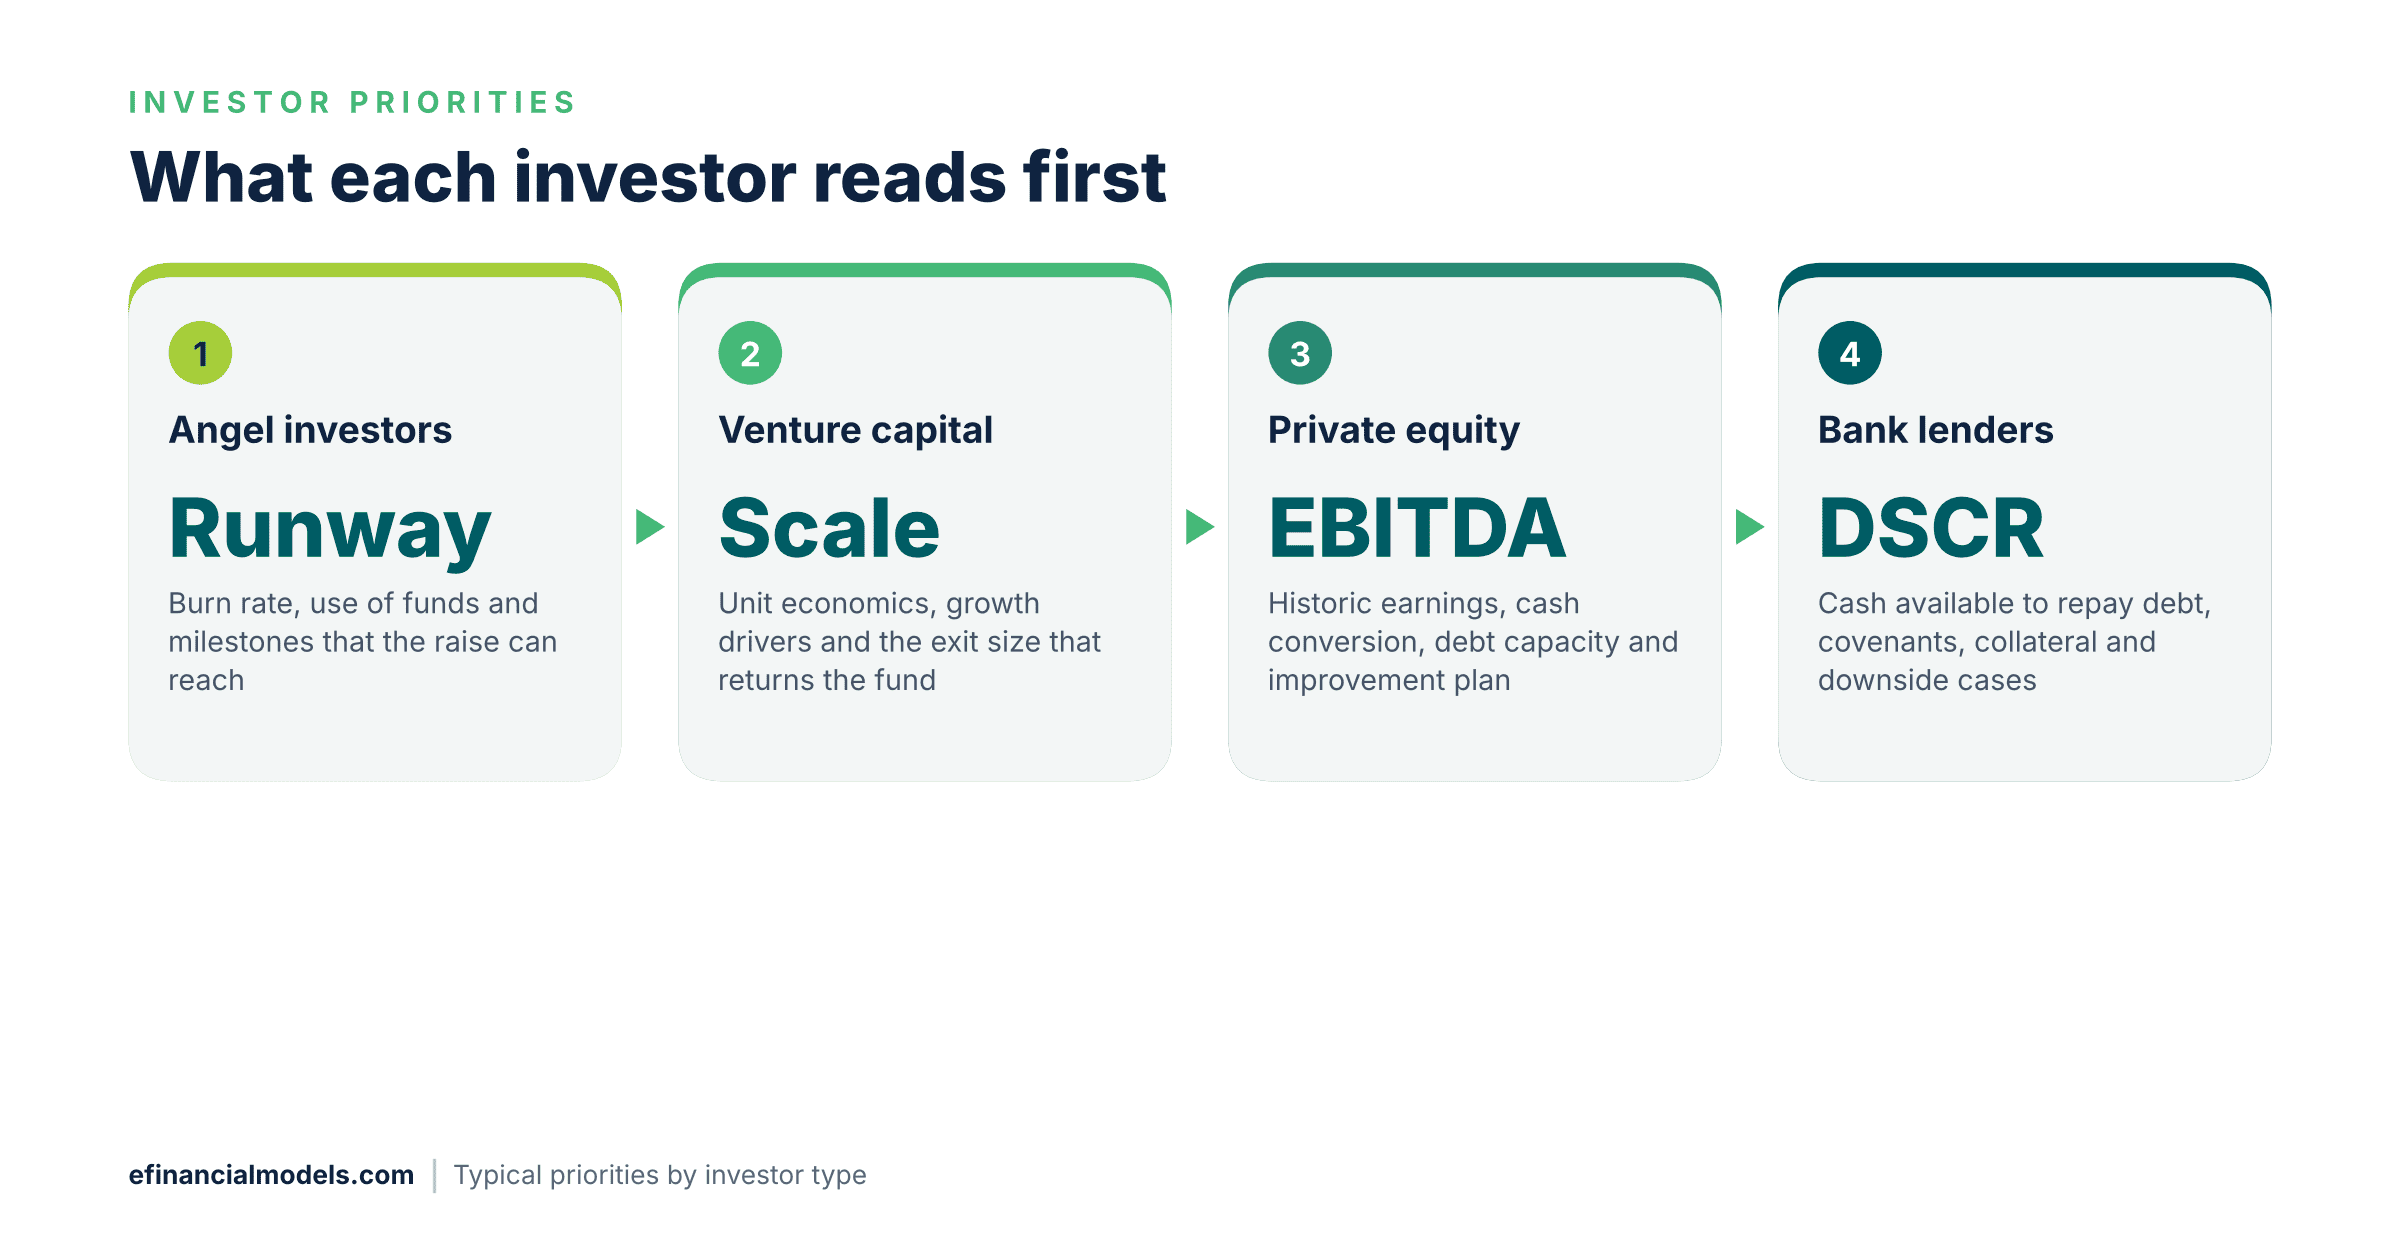
The four investors covered next each open a model at a different place: runway, scale, earnings or repayment.
Four investors in depth: angels, venture funds, private equity and banks
Angel investors read runway and milestones
Angels are wealthy individuals who invest their own money in very early companies, so they back the founder as much as the numbers. Their model shows realistic assumptions, a clear use of funds, monthly burn (the cash spent each month) and the milestones the raise can reach.
Venture capital funds read scalability and exit size
Venture funds hold stakes for years, usually take a board seat and need a few outsized exits to repay the fund. Their model shows a detailed revenue build, growth drivers and unit economics: customer acquisition cost (CAC), the cost of winning one customer, against customer lifetime value (LTV), the gross profit one customer produces.
Private equity investors read earnings and debt capacity
Private equity funds buy mature companies, often with borrowed money, and take control. Buyout holding periods at exit now hover near seven years, against five to six years from 2010 to 2021, according to Bain & Company’s 2026 Global PE Report. Their model needs detailed historicals, earnings before interest, taxes, depreciation and amortisation (EBITDA), debt capacity, and synergy and leverage scenarios.
Bank lenders read repayment capacity
Banks lend, so they ask whether cash flow repays the loan, not how large the company can grow. The debt service coverage ratio (DSCR) measures operating cash flow divided by the interest and principal due in the period, so a value above 1.0 means cash covers repayments. Lender models add conservative projections, stress tests and covenant schedules. Private credit funds, which lend outside banks, mostly serve middle-market firms with annual revenues between $10 million and $1 billion, and almost all their loans carry floating rates, according to the Federal Reserve Board’s 2024 note on private credit.
How to tailor a financial model to each investor type
- Identify the target investor. Use the comparison table to match stage, check size and horizon.
- Highlight what that investor weighs most. Move those components to the summary sheet.
- Match assumptions to risk appetite. Growth ambition suits venture funds, and conservative margins suit lenders.
- Build scenarios around their worry. Lenders want downside protection, and venture funds want upside cases.
- Present in their preferred format. Summary slides suit angels, and a detailed Excel workbook suits private equity.
- Validate with an adviser. An outside reviewer checks the arithmetic first.
Worked example: a $500,000 seed raise from an angel versus a venture fund
The example uses a pre-revenue software-as-a-service (SaaS) startup raising $500,000, a small check on the table’s scale, and every figure is an illustrative assumption. The angel values the company at $2,000,000 before the round (pre-money), the venture fund at $1,500,000 with a 10% option pool reserved for hires. Later rounds dilute every holder by 50%, and both cases assume a $30,000,000 exit, with the angel holding six years and the venture fund eight. These terms are assumptions chosen to show the contrast, so the gap in results comes from them, not from investor type alone.
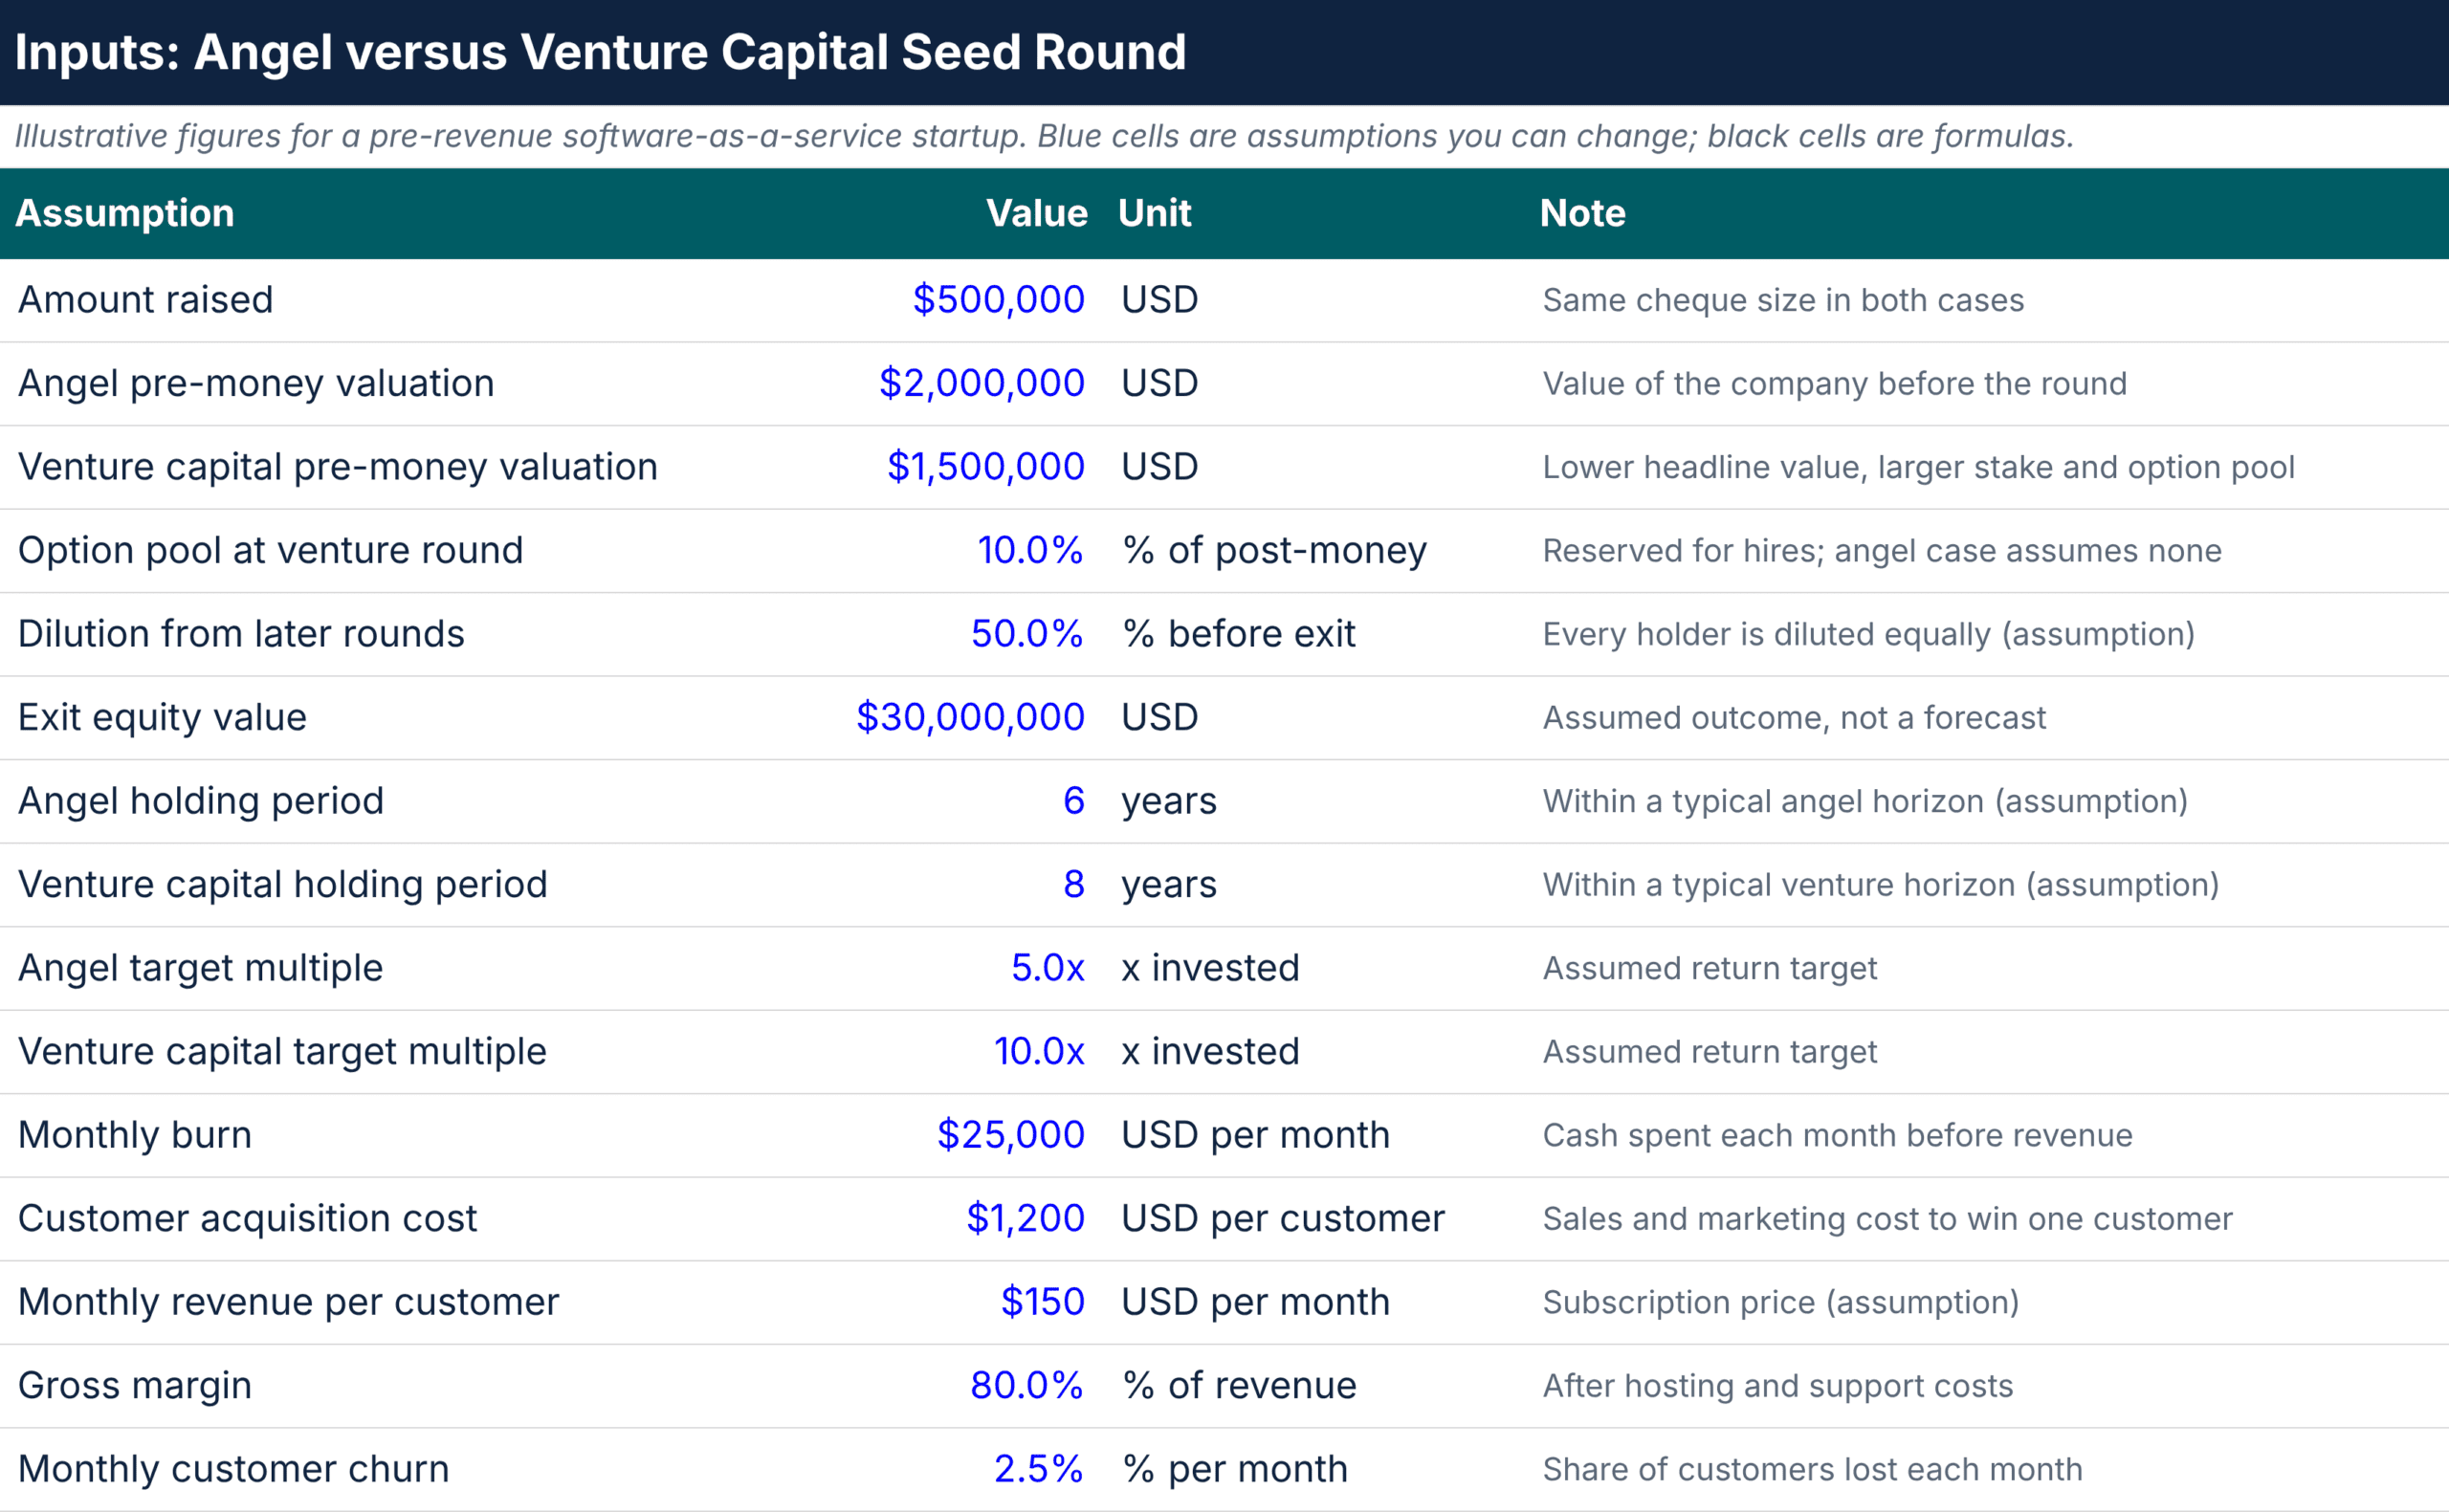
Inputs sheet: every blue cell is an assumption for the $500,000 seed raise that a founder can change. Source: eFinancialModels Analysis
Ownership equals the amount invested divided by post-money valuation, which is pre-money plus the raise and so includes the new cash. For the angel, post-money is $2,000,000 plus $500,000, or $2,500,000, so the angel buys $500,000 divided by $2,500,000, or 20.0%. For the venture fund, post-money is $1,500,000 plus $500,000, or $2,000,000, so the fund buys 25.0%. The option pool comes out of the founders’ shares, so founders keep 80.0% after the angel round and 65.0% after the venture round (100% less 25.0% less 10.0%).
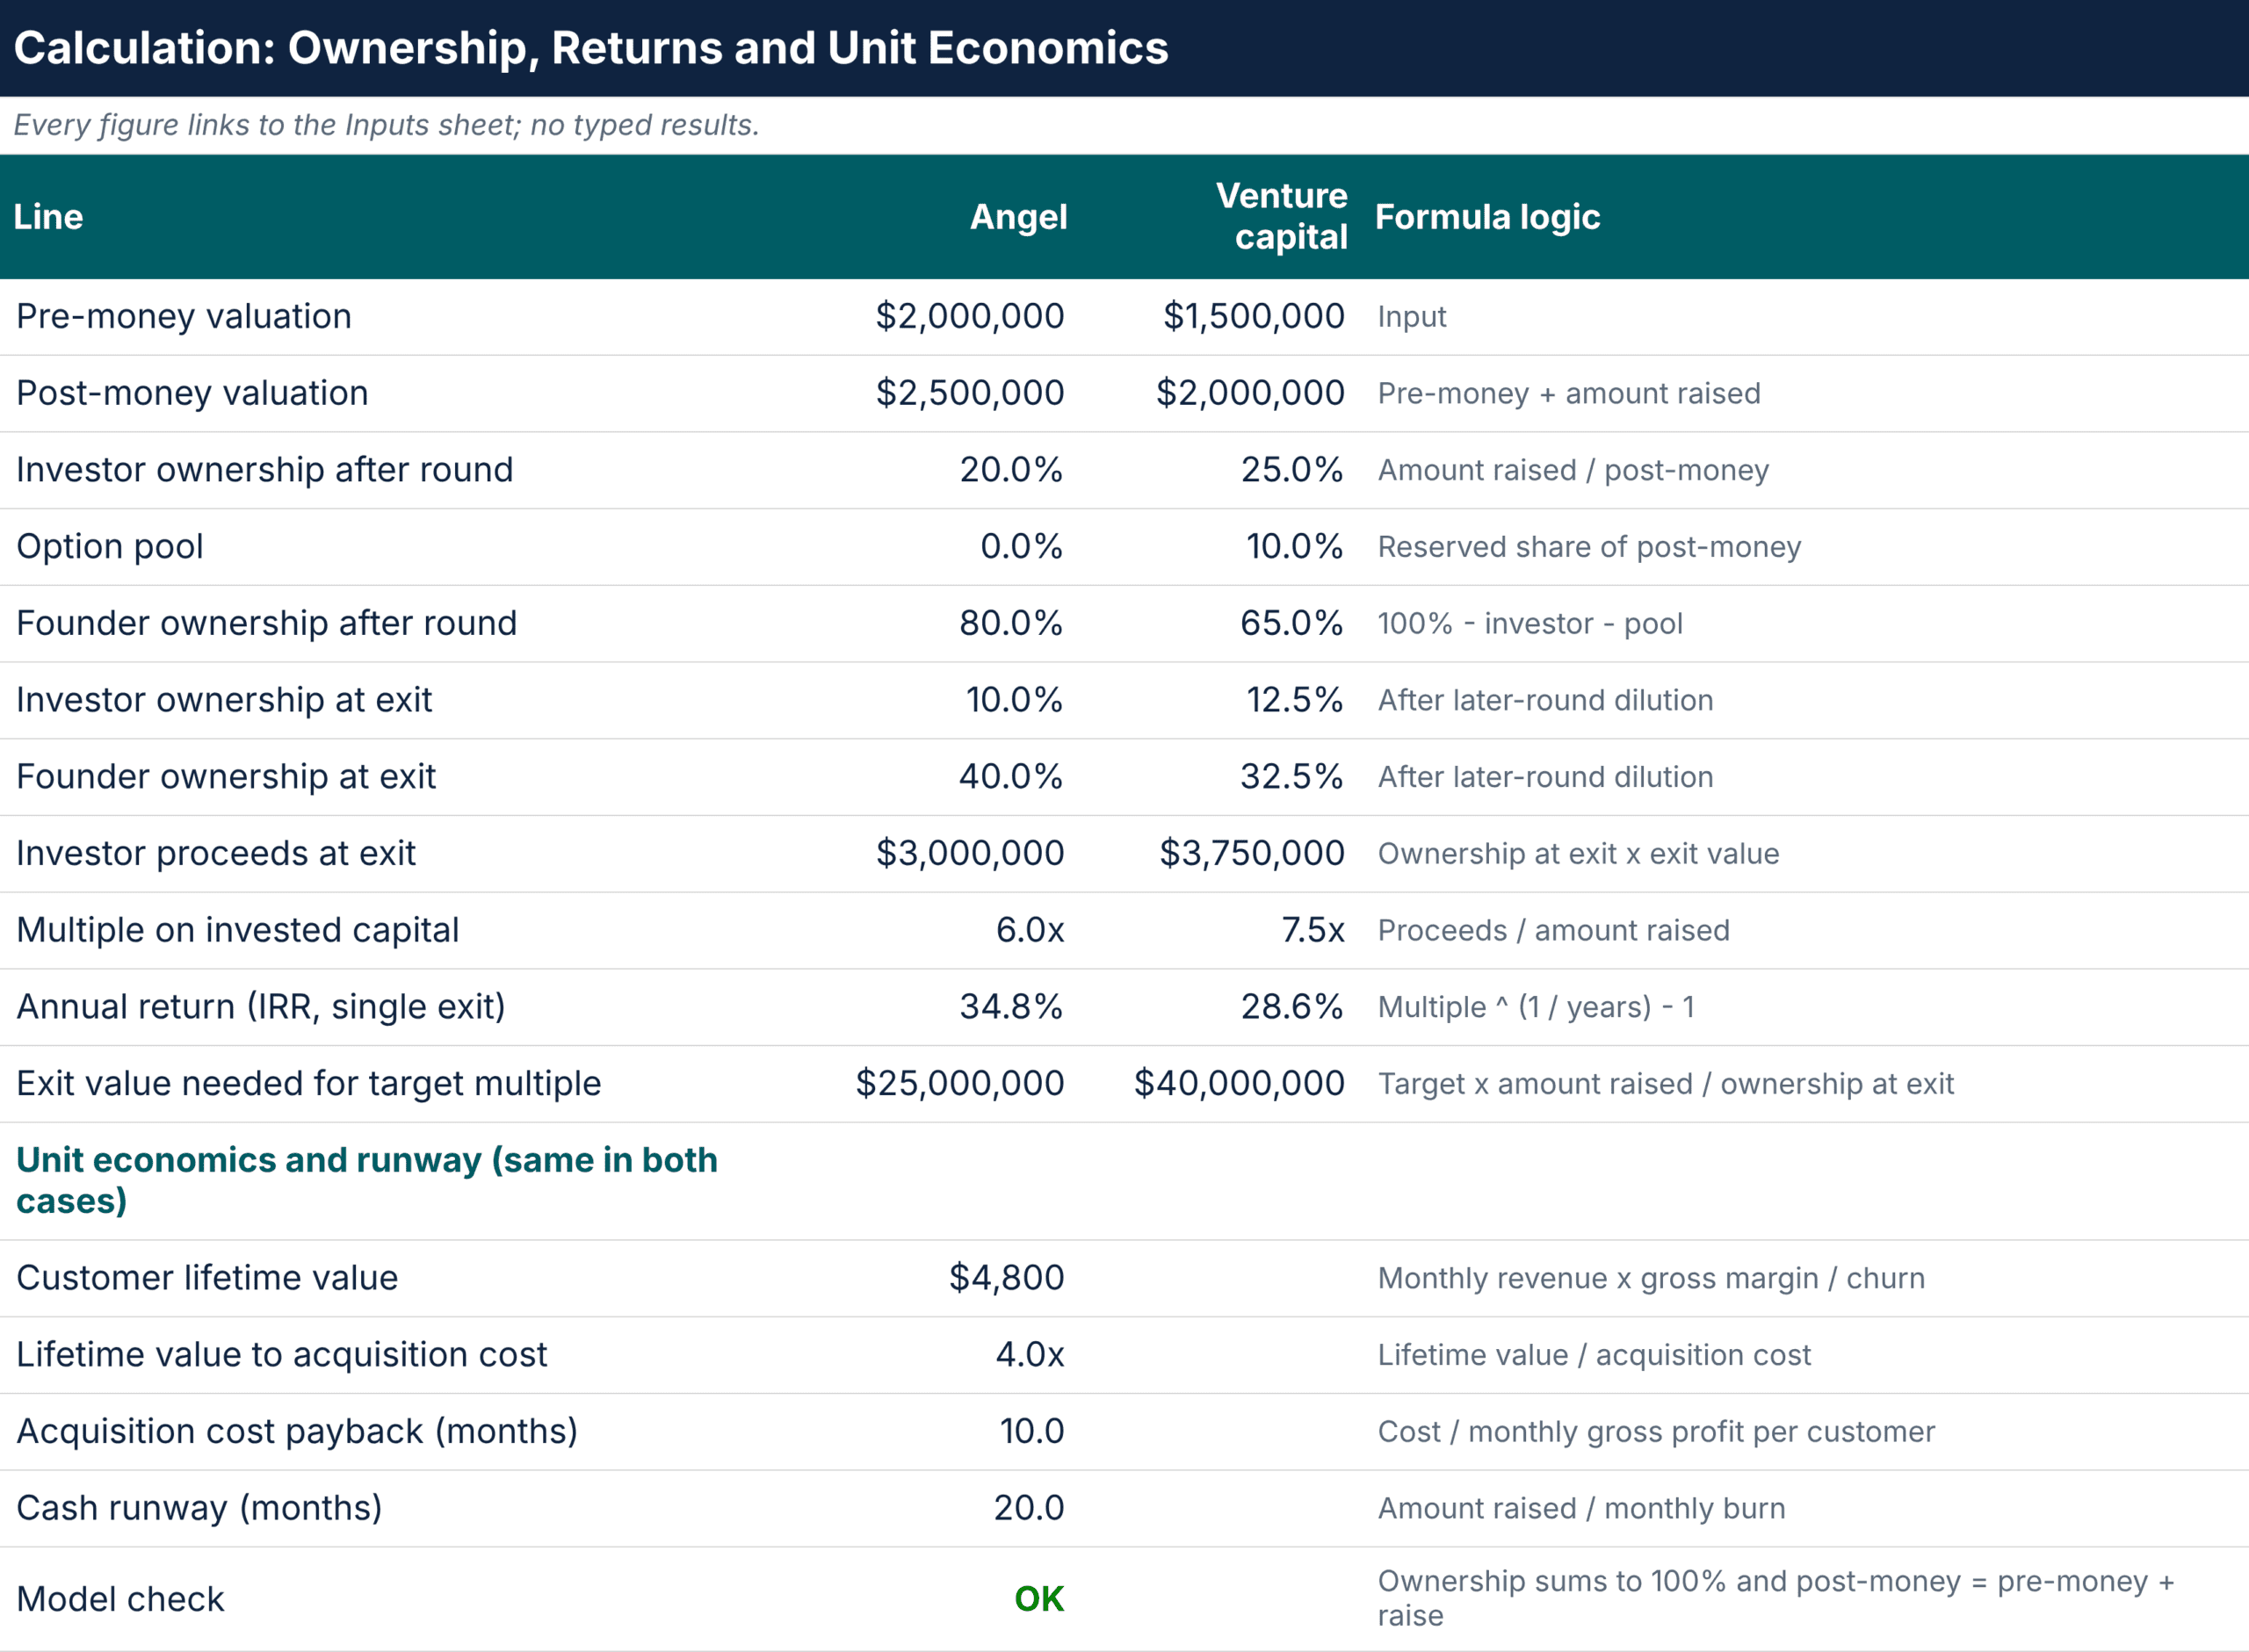
Calculation sheet: ownership, dilution, returns and unit economics flow from the inputs with no typed results. Source: eFinancialModels Analysis
Later rounds then halve every stake: the angel’s 20.0% becomes 10.0% and the fund’s 25.0% becomes 12.5%, while founders fall to 40.0% and 32.5%. At the $30,000,000 exit the angel’s 10.0% returns $3,000,000, a 6.0x multiple on invested capital (proceeds divided by the amount invested), and the fund’s 12.5% returns $3,750,000, or 7.5x. Over their holding periods the annual returns are an internal rate of return (IRR, the yearly return that turns the investment into the proceeds) of 34.8% for the angel and 28.6% for the fund, so the venture multiple is higher while its yearly return is lower.
Against an assumed 5.0x angel target, the exit has to reach $25,000,000, which the $30,000,000 assumption clears. Against an assumed 10.0x venture target it has to reach $40,000,000, which it does not, so the venture model must show a credible path to a larger outcome. A lifetime value of $4,800 against a $1,200 acquisition cost gives a 4.0x ratio and a 10-month payback, while the angel case leans on 20 months of runway, the raise divided by $25,000 of monthly burn.
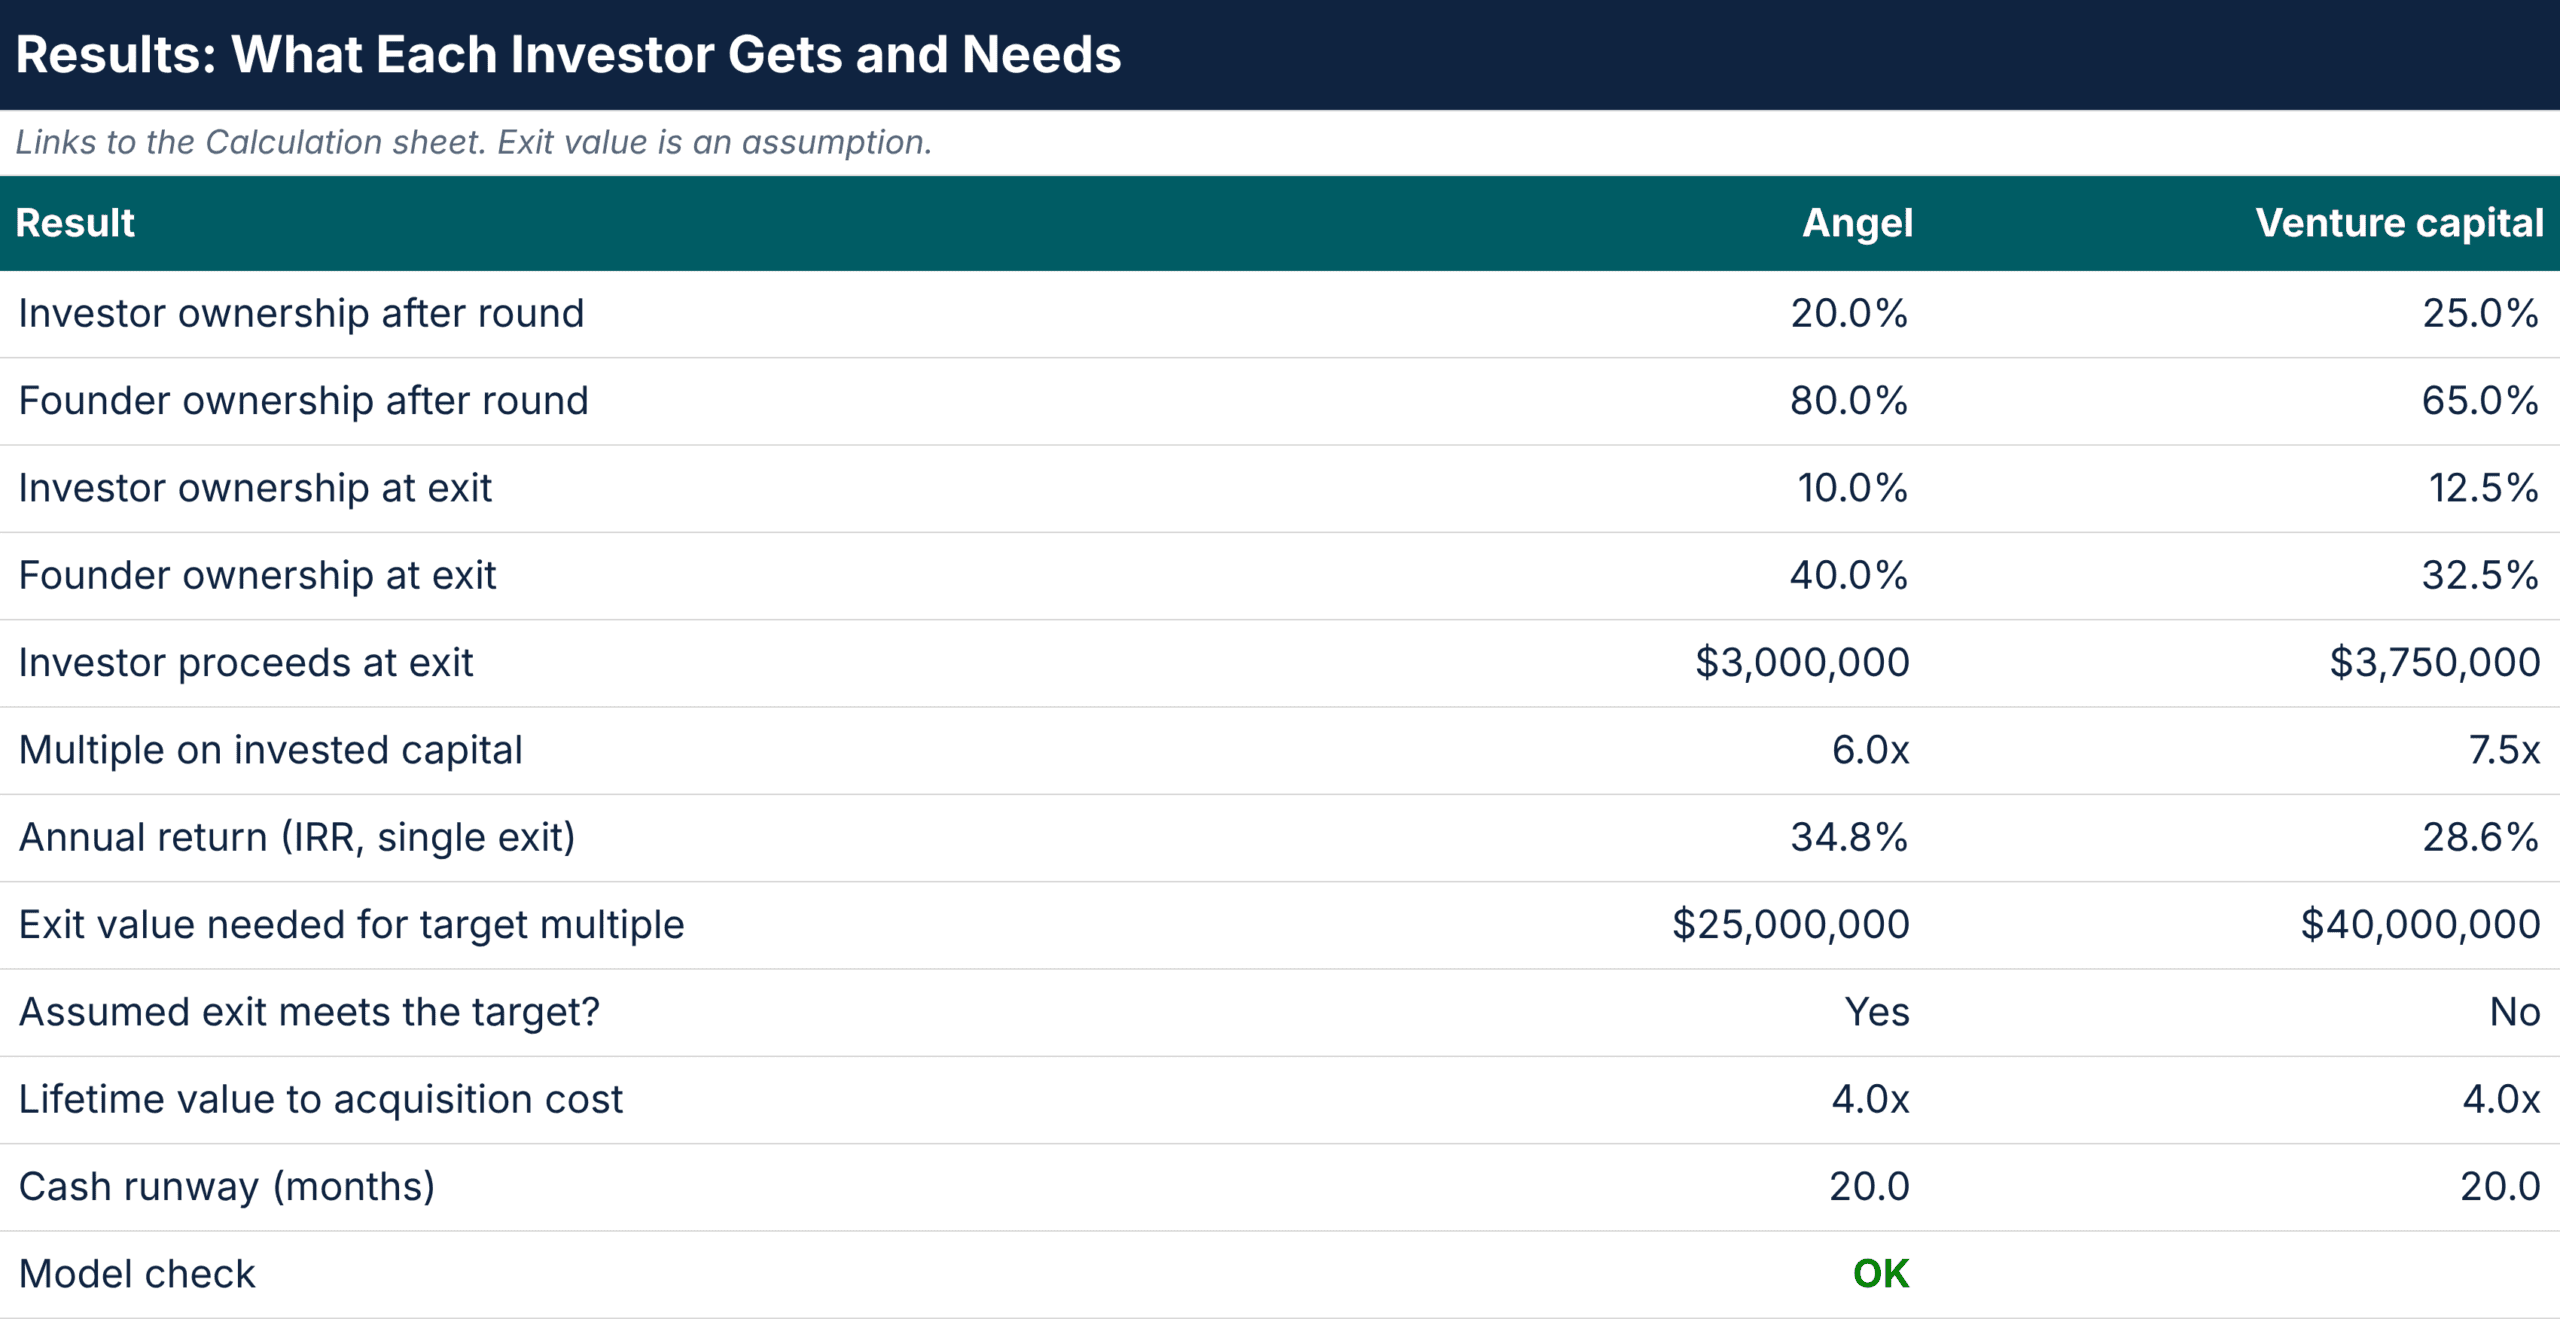
Results sheet: the angel and venture cases side by side, with the model check reading OK. Source: eFinancialModels Analysis
Five common mistakes when presenting models to investors
- One-size-fits-all assumptions. One growth and margin case rarely suits both a venture fund and a lender.
- Ignoring the investor’s horizon. A ten-year projection tells a short-term lender little about repayment.
- Hiding assumptions or over-promising. Unstated inputs and hockey-stick growth cost credibility fast.
- Skipping covenants and control terms. Debt covenants and board rights change cash flow, so the model should include them.
- Misaligning model and pitch. Numbers that contradict the slides raise doubts about both.
Tools and templates for investor-ready models
Founders can start from eFinancialModels’ Excel templates, value the business with discounted cash flow (DCF) models and plan equity rounds with the fundraising templates.
Frequently Asked Questions
When should a founder approach a corporate investor instead of a venture fund?
A corporate investor fits when the product plugs into the corporation’s own business, such as a distribution channel, a supply chain or a technology roadmap. The model should then show strategic benefit, pilot economics and integration costs next to standalone returns. A venture fund fits when the company can grow independently and needs capital, advice and follow-on funding more than a single commercial partner.
How does investment horizon change what a model should include?
The projection period should match how long the investor waits for cash. Short-horizon lenders need monthly or quarterly cash flow and repayment schedules, while long-horizon funds need annual projections through exit. Target returns set the exit view: an investor needing a high multiple wants to see the exit value that delivers it, as the venture case above shows, and a lender wants repayment coverage instead.
Can several investor types join the same round?
Yes, and mixed rounds are common, for example angels alongside a venture lead or a bank facility beside equity. The model then needs one cap table showing each class of shares, a debt schedule with covenants, and a use of funds that adds up across all sources. Rights such as liquidation preferences and board seats should appear as separate lines, so each investor sees their own return.
How should founders negotiate control terms with different investors?
Control is negotiated through specific rights: board seats, veto lists, information rights and, for lenders, covenants and security. Founders should model each right’s cost before agreeing to it, for example the covenant headroom a lender requires or the dilution from a larger option pool. Trading a lower valuation for lighter control, or the reverse, is easier to judge when both versions sit in one scenario table.
Where can founders find reliable data to build their own comparison table?
Primary and institutional sources are safest: central bank surveys such as the Federal Reserve’s Small Business Credit Survey, regulator pages on investor definitions, and annual reports from firms such as Bain and Crunchbase. Each figure should carry its geography, year and exact definition, because medians, averages and ranges differ across datasets. A figure without a stated source belongs in a model as a labelled assumption, never as a fact.
Conclusion
Every investor reads the same seven components, but each weighs them by check size, horizon and control, so a model works best when built for one investor first. Founders preparing an equity round can start from eFinancialModels’ Simple Fundraising Model, a free Excel template that combines a three-statement forecast, discounted cash flow valuation, pre-money and post-money valuation and expected returns by investor.