
0 ITEMS

Clothing Store Financial Model Excel Template
The Clothing Store Financial Model helps turn a retail apparel concept into a structured financial forecast that can be used for planning, funding, budgeting, and internal decision-making. Instead of starting from a blank spreadsheet, users can work from a ready-to-use financial model template designed around the economics of a clothing store, including customer traffic, conversion rates, product categories, cost of goods sold, startup costs, operating expenses, payroll, cash flow, and profitability. It provides a practical framework for understanding whether a boutique, apparel shop, fashion retail store, or hybrid physical and online clothing business can reach sustainable performance over time. This template is built for entrepreneurs, founders, business owners, consultants, analysts, and anyone preparing a clothing store business plan or investor presentation. It helps users document revenue assumptions, estimate initial capital needs, forecast monthly and annual expenses, evaluate staffing requirements, and review financial results across a multi-year period. For a lender or investor, the model organizes the key questions that matter most, including how much funding is needed, how revenue will grow, when the business may break even, and whether the company can generate positive cash flow. The Clothing Store Financial Model is fully editable, allowing users to replace the built-in assumptions with their own store size, pricing strategy, product mix, visitor traffic, sales channels, vendor costs, payroll structure, marketing budget, and growth expectations. The model supports scenario planning, profitability review, break-even analysis, and investment evaluation, making it useful for both new clothing store launches and established apparel retailers planning expansion. Users can adjust assumptions for dresses, tops, denim, handbags, jewelry, or their own product categories to better reflect their specific market positioning. By connecting revenue drivers, startup investment, operating expenses, cash flow forecasting, and investor-ready outputs in one file, the template gives users a clearer view of the financial path ahead. It is designed to support better decision-making before committing capital, signing a lease, hiring staff, purchasing inventory, or presenting the business to stakeholders. Whether used in Microsoft Excel or Google Sheets, this financial model template helps simplify complex financial planning and provides a professional foundation for building, testing, and presenting a clothing store business strategy.


Clothing Store Financial Model Overview
The Clothing Store Financial Model is a ready-to-use financial model template designed to help entrepreneurs, business owners, consultants, analysts, and planners evaluate the financial potential of a retail apparel business. It brings together the core assumptions needed to forecast revenue, startup costs, cost of goods sold, operating expenses, payroll, cash flow, profitability, funding needs, and long-term performance. For a clothing store, financial planning depends on more than total sales alone. A realistic forecast needs to account for daily visitors, conversion rates, average order value, product mix, inventory costs, rent, staffing, marketing, and seasonal retail patterns. This template gives users a structured way to organize those assumptions and turn them into clear financial outputs that can support business planning, investor discussions, loan applications, internal budgeting, and strategic decision-making. It is editable for a physical boutique, an online clothing store, or a hybrid retail model.
All-in-One Dashboard
The all-in-one dashboard gives users a centralized view of the most important inputs and outputs in the Clothing Store Financial Model. Instead of searching through multiple worksheets to understand the health of the forecast, users can review core assumptions, revenue performance, profitability, cash flow, and investment metrics in one place. This component may include inputs such as launch timing, customer traffic, pricing assumptions, conversion rates, product mix, expense categories, payroll levels, and capital investment requirements. It then helps summarize outputs such as projected sales, gross profit, EBITDA, net income, ending cash balance, break-even timing, and return metrics. For planning and decision-making, the dashboard is useful because it connects the assumptions behind the business with the financial results they produce. A founder can quickly see whether a change in visitor traffic, inventory cost, rent, or staffing affects profitability and liquidity, while a lender or investor can review the model’s financial logic in a clean, organized format.
Low, Base, and High Scenario Analysis
The Low, Base, and High scenario analysis component helps users test how the clothing store may perform under different business conditions. A retail apparel business can be affected by changes in foot traffic, online traffic, buyer conversion rates, average basket size, product margins, inventory turnover, marketing effectiveness, rent, payroll, and supplier costs. This section allows the user to compare a conservative case, a realistic base case, and an optimistic growth case without rebuilding the model from scratch. Inputs may include different assumptions for daily store visitors, customer conversion, repeat purchases, sales growth, pricing, cost of goods sold, and operating expense behavior. The outputs can show how revenue, gross margin, EBITDA, cash flow, funding needs, and profitability change across each scenario. This is especially useful when preparing a business plan or funding discussion because it demonstrates that the user has considered both upside potential and downside risk. It also helps management create contingency plans, set performance targets, and understand which assumptions have the greatest effect on financial results.
Professional Charts
The professional charts component translates the financial forecast into visual reports that are easier to understand and present. Clothing store financial projections can involve many moving parts, including category revenue, customer growth, product margins, expense trends, cash balances, and profitability milestones. Charts help simplify those numbers by showing trends and relationships over time. This component may use model outputs such as monthly revenue, annual sales growth, gross profit, EBITDA, net income, cash flow, expense breakdowns, and investment returns. The resulting visuals can support investor presentations, lender meetings, internal planning sessions, and stakeholder updates. For example, a user may be able to show how revenue grows as daily visitors increase, how profitability improves as fixed costs are absorbed, or how cash flow changes during the early years after launch. Professional charts are valuable because they make the model more presentation-ready and help non-financial audiences quickly understand the business story behind the numbers. They also allow users to spot trends, gaps, and potential issues more easily than reviewing spreadsheet rows alone.
ROE Components and DuPont Analysis
The ROE components and DuPont analysis section helps users evaluate return on equity by breaking it into its underlying financial drivers. For a clothing store, return on equity is influenced by profitability, asset efficiency, and financial structure. This component may analyze net profit margin, asset turnover, and equity multiplier to show how operating performance and capital use contribute to overall shareholder return. Inputs and outputs may come from the projected income statement, balance sheet, and investment assumptions, including net income, revenue, total assets, equity, liabilities, and retained earnings. The DuPont framework is useful because it goes beyond a single return percentage and explains why that return is occurring. If return on equity is low, the model can help identify whether the issue is weak margins, inefficient use of assets, excessive inventory investment, high fixed costs, or an unfavorable capital structure. For entrepreneurs and investors, this provides a more disciplined way to review performance and compare the store’s projected returns with alternative uses of capital. It also supports better strategic decisions around pricing, inventory management, financing, and growth.
Revenue Inputs
The revenue inputs component is where users define the commercial assumptions that drive the clothing store forecast. Revenue in an apparel business is typically built from customer traffic, conversion rates, average purchase value, sales frequency, repeat customers, and product category performance. This section may include assumptions for daily store visitors, online visits, buyer conversion, average order value, sales seasonality, pricing, unit sales, and growth by year. It can also be customized for different product categories such as dresses, tops, denim, handbags, jewelry, accessories, footwear, or any other merchandise mix relevant to the user’s store concept. The model uses these assumptions to calculate projected sales over time, helping users understand how customer behavior translates into revenue. This is important because a clothing store forecast should not rely on a single top-line guess. By building revenue from operational drivers, the user can test whether planned traffic levels and conversion rates are realistic, whether pricing supports the desired revenue target, and whether the store needs more marketing, a stronger loyalty program, better merchandising, or a larger online channel to reach its goals.
Bank-Ready Reports
The bank-ready reports component organizes the model’s outputs into a format suitable for lenders, investors, advisors, and other stakeholders. When seeking financing for a clothing store, decision-makers typically want to see startup investment requirements, revenue assumptions, cost structure, profit and loss projections, cash flow, balance sheet movement, repayment capacity, and the timing of break-even. This section helps present those details in a structured and professional way. Inputs flow from the rest of the model, including revenue forecasts, COGS assumptions, payroll, rent, marketing, general expenses, startup costs, capital expenditures, debt financing, and working capital needs. The outputs may include forecast financial statements, summary tables, profitability metrics, cash balance trends, and investment performance indicators. This is useful because it saves time when preparing a loan application, investor deck, or business plan appendix. It also helps the user communicate the financial plan clearly, showing how much capital is required, how funds may be used, when the business expects to become profitable, and whether cash flow can support ongoing operations and potential debt obligations.
Revenue Breakdown
The revenue breakdown component gives users a more detailed view of where clothing store sales are expected to come from. Rather than presenting revenue as one combined number, this section separates the forecast by revenue stream, product category, channel, or customer segment. For an apparel retail business, this may include dresses, tops, denim, handbags, jewelry, accessories, in-store sales, e-commerce sales, seasonal collections, or promotional sales. Inputs may include category-level pricing, unit sales, customer mix, average transaction value, repeat purchase behavior, and growth rates. The outputs help show which categories contribute the most revenue, which have the strongest growth potential, and how changes in the sales mix affect total sales and margins. This component is useful for merchandising, buying decisions, inventory planning, and marketing strategy. If one category generates strong revenue but low margin, the user can review whether it should remain a traffic driver or be balanced with higher-margin products. If another category shows high profit potential, the store may choose to promote it more heavily or allocate more shelf space and inventory budget to it.
KPI Dashboard
The KPI dashboard component tracks key performance indicators that help users evaluate how the clothing store is performing against its plan. Retail apparel businesses rely on a combination of sales, margin, customer, inventory, and cash flow metrics to make informed decisions. This section may monitor KPIs such as revenue growth, gross margin, EBITDA margin, net profit margin, average order value, customer conversion rate, repeat customer share, inventory turnover, cash balance, operating expense ratio, break-even progress, and return metrics. Inputs are drawn from the revenue forecast, expense model, inventory assumptions, financial statements, and scenario settings. The outputs provide a quick view of performance trends and allow users to compare projected results against targets or industry benchmarks. This is useful because it helps management focus on the metrics that matter most, rather than reviewing every line of the financial model. For a founder, the KPI dashboard can support monthly planning and performance reviews. For investors or lenders, it provides a concise summary of whether the business model appears efficient, scalable, and financially disciplined.
Startup Cost and Capital Expenditure Planning
The startup cost and capital expenditure planning component helps users estimate the initial investment required to open and operate a clothing store before it begins generating consistent revenue. A retail apparel launch often requires spending on initial inventory, lease deposits, leasehold improvements, retail fixtures, display units, point-of-sale systems, signage, website and e-commerce setup, branding, licenses, professional services, opening marketing, technology, and working capital reserves. This section allows users to enter or adjust those assumptions and see the total funding required before launch. It can separate one-time capital expenditures from recurring operating expenses, which is important for understanding how much cash is needed upfront versus how much is needed each month. The outputs may include total startup budget, funding requirement, capital allocation by category, depreciation inputs, and the impact of initial investment on cash flow. This component is useful for business planning and funding because it helps avoid underestimating launch costs. It also gives lenders and investors a clearer view of how capital will be used and whether the proposed budget is realistic for the store format and growth plan.
Break-Even Analysis
The break-even analysis component helps users identify when the clothing store may generate enough revenue to cover its startup costs and ongoing operating expenses. For a retail apparel business, break-even depends on gross margin, product cost, rent, payroll, marketing, utilities, software, insurance, payment processing fees, and other fixed and variable expenses. This section may use assumptions from the revenue forecast, COGS schedule, operating expense budget, payroll plan, and startup investment section to calculate the point at which cumulative revenue or contribution margin covers total costs. Outputs may include break-even month, break-even sales level, required customer volume, required transactions, and the gap between projected performance and break-even performance. This is useful because it gives founders and stakeholders a clear milestone for financial sustainability. If the model shows that break-even takes too long, the user can test changes such as improving conversion rates, increasing average order value, negotiating lower supplier costs, reducing fixed expenses, adjusting staffing, or increasing marketing efficiency. The break-even analysis supports better decision-making by showing what level of sales activity the store must achieve to become self-sustaining.
File types:
Excel – Single-User: .xlsx
Excel – Multi-User: .xlsx
Similar ProductsOther customers were also interested in...


 HenrySheykin
Grocery Store Financial Model Excel Template
The Grocery Store Financial Model helps entrepreneurs, founders, consultants, analysts, and retail b... Read more
Bakery Financial Model Excel Template
The Bakery Financial Model helps entrepreneurs, bakery owners, consultants, analysts, and business p... Read more
Candy Store Financial Model Excel Template
The Candy Store Financial Model helps entrepreneurs and planners turn a retail confectionery concept... Read more

 Giorgos
Online Clothing Wholesaler – 5 Year Financia...
Advanced Financial Model presenting a 5 Year Business Plan for an Online Clothing Wholesale company.... Read more
 CFO Templates
Retail Business Financial Model
The Retail Financial Plan is an all-inclusive financial planning template for the retail industry. W... Read more

Gift Shop Financial Model Excel Template
The Gift Shop Financial Model helps users build a structured financial forecast for a retail gift st... Read more
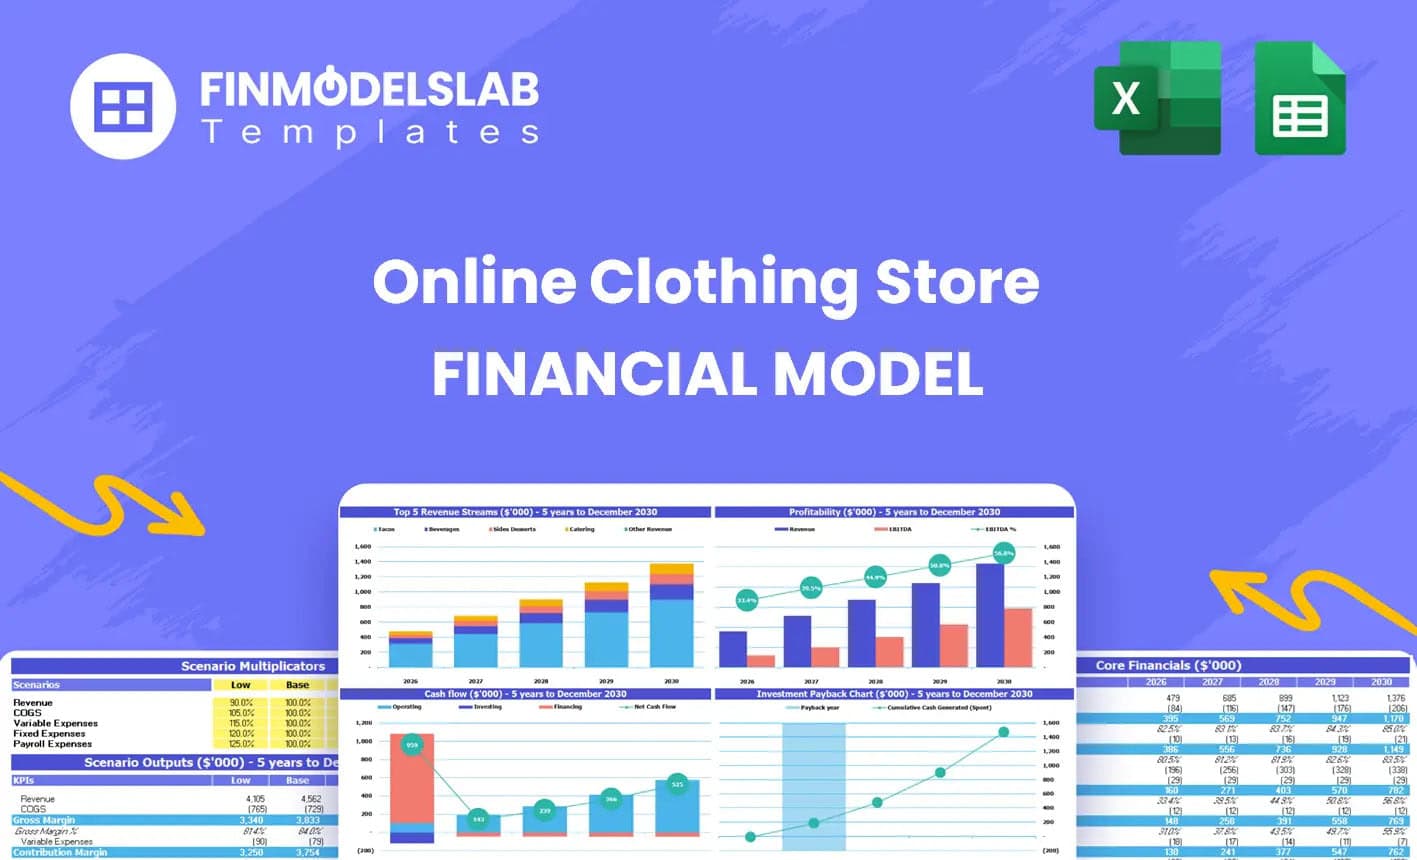
Online Clothing Store Financial Model Excel Templa...
The Online Clothing Store Financial Model helps founders, entrepreneurs, business owners, consultant... Read more
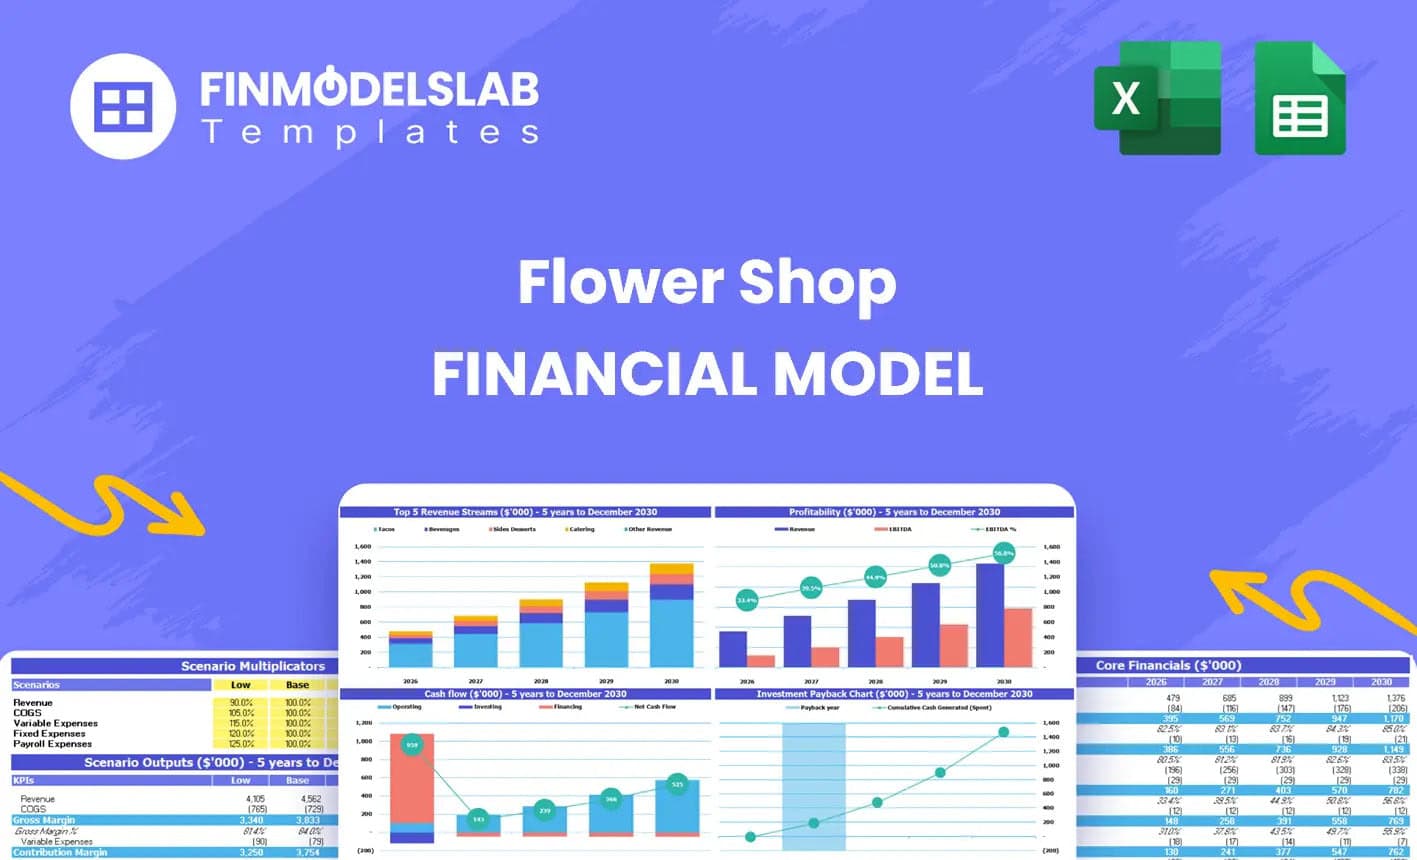
Flower Shop Financial Model Excel Template
The Flower Shop Financial Model helps entrepreneurs, florists, business owners, consultants, and ana... Read more
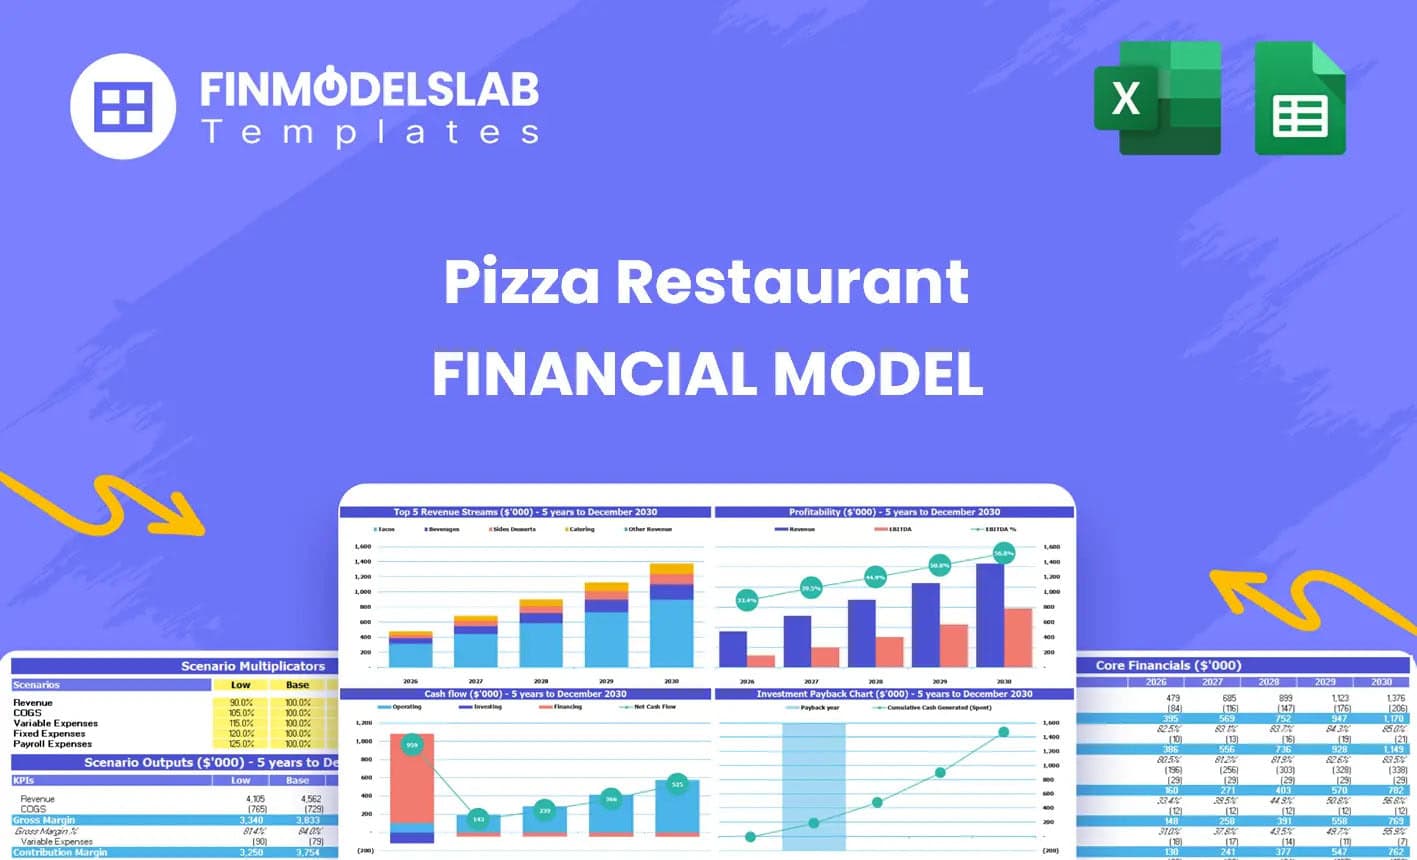
Pizzeria Financial Model Excel Template
The Pizza Restaurant Financial Model Template helps entrepreneurs, restaurant owners, consultants, a... Read more
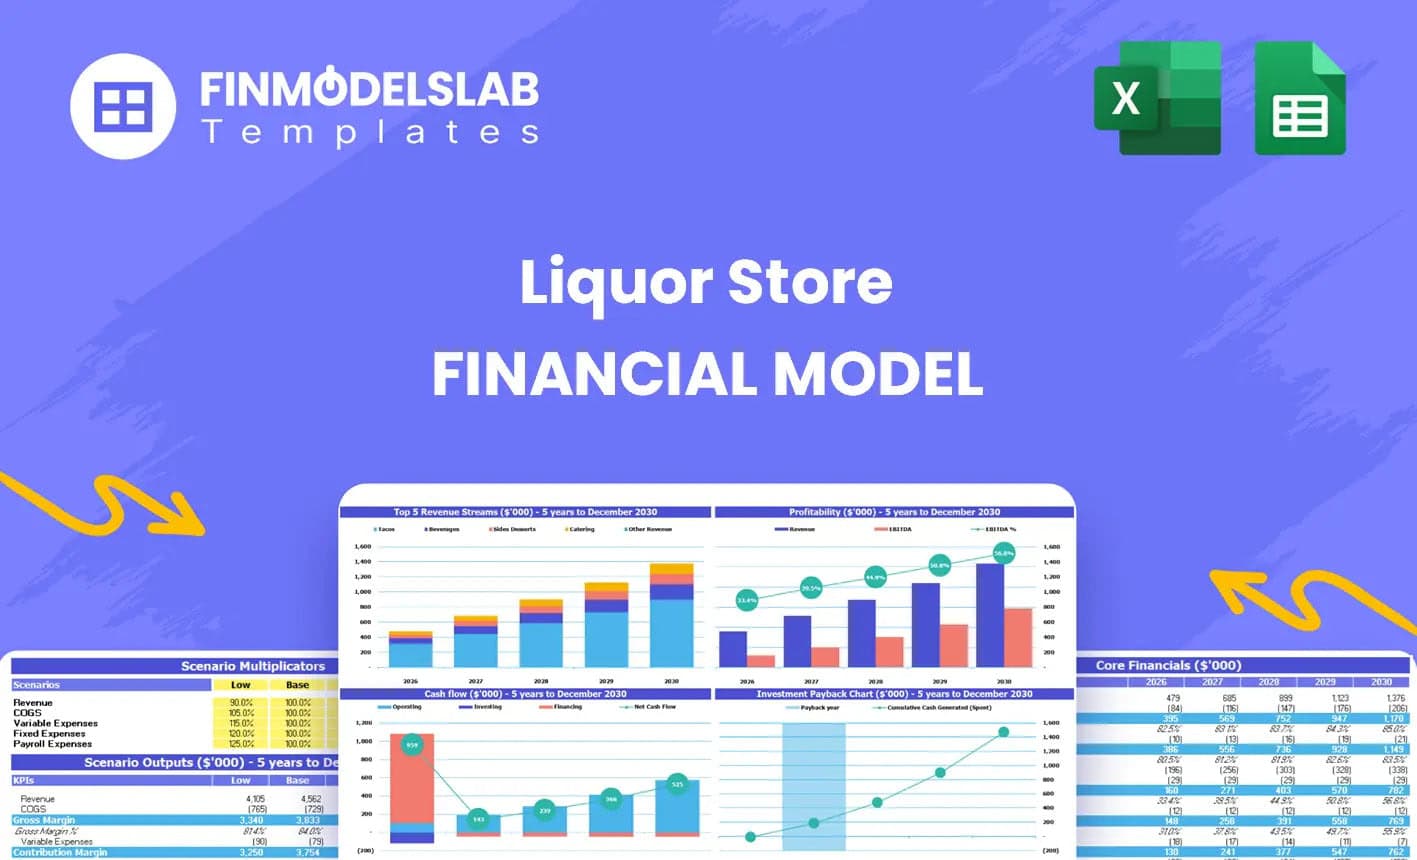
Liquor Store Financial Model Excel Template
The Liquor Store Financial Model helps entrepreneurs, store owners, consultants, analysts, and busin... Read more
Reviews
 Clothing Store business model
For the price paid, the model lacks fundamental features (such as inventory and end of sales discount analysis but also other more relevant to capital investment analysis such as payback and IRR) which have been instead replaced by unnecessary tabs and analysis.
Various hidden rows which don’t help with the navigation and the audit of the file.
Tried to ask for money back but was denied.
I would not recommend the purchase at this price, the model needs a good refresh.
1837 of 3595 people found this review helpful.
Help other customers find the most helpful reviews
Did you find this review helpful?
You must log in to submit a review.