
0 ITEMS

Flower Shop Financial Model Excel Template
The Flower Shop Financial Model helps entrepreneurs, florists, business owners, consultants, and analysts turn a floral retail concept into a structured financial forecast. Instead of building a spreadsheet from scratch, users can start with a ready-to-use model designed around the way a flower shop actually earns revenue, manages inventory, controls costs, and plans for seasonal demand. The template helps estimate sales from walk-in customers, repeat buyers, floral arrangements, subscription boxes, corporate decor, and other revenue streams while connecting those assumptions to operating expenses, payroll, cost of goods sold, cash flow, and profitability. This financial model template is useful for launching a new flower shop, expanding an existing florist business, preparing a business plan, applying for funding, or presenting projections to banks and investors. It allows users to input and adjust key revenue assumptions, startup costs, staffing plans, supplier costs, marketing budgets, store expenses, and working capital needs. The model is built to support practical financial planning by showing how changes in visitors, conversion rates, pricing, customer retention, and expenses can affect the long-term performance of the business. The template provides a five-year planning structure that helps users understand the full financial picture, from initial investment and monthly cash flow to profitability, break-even analysis, and investor return metrics. It is especially helpful for decision-making because it shows the connection between daily operating choices and financial outcomes. Users can test different scenarios, review bank-ready outputs, evaluate cash requirements, and see when the business may become sustainable under realistic assumptions. Designed for both non-financial users and experienced analysts, the Flower Shop Financial Model is fully editable and compatible with Excel and Google Sheets. It gives founders a professional framework for forecasting revenue, tracking expenses, assessing payroll needs, reviewing financial statements, and communicating the opportunity clearly to stakeholders. Whether the goal is to secure funding, plan a launch, manage growth, or improve an existing shop’s performance, this template provides a practical foundation for building a more confident and data-driven floral business plan.
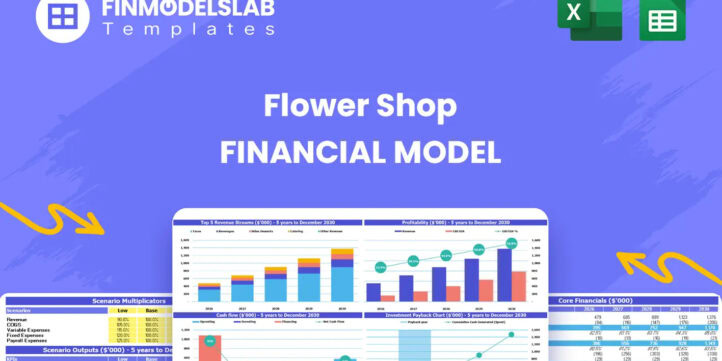


Financial Model Overview
The Flower Shop Financial Model is a ready-to-use financial model template built to help entrepreneurs, florists, business owners, consultants, and analysts plan the financial future of a retail floral business. A flower shop depends on multiple moving parts, including daily store traffic, buyer conversion, repeat customers, seasonal demand, floral arrangement pricing, subscription orders, corporate decor, supplier costs, staffing, inventory spoilage, delivery capacity, and marketing effectiveness. This model brings those assumptions together into one structured planning tool so users can forecast revenue, startup investment, operating expenses, payroll, cash flow, profitability, funding needs, and investor returns over a multi-year period. It is designed for business planning, loan applications, investor discussions, internal budgeting, and strategic decision-making. Instead of relying on disconnected estimates, users can work from a fully editable framework that connects commercial drivers with financial statements and key performance metrics, making it easier to understand whether the flower shop can launch, grow, and reach sustainable profitability.
All-in-One Dashboard
The all-in-one dashboard gives users a central view of the most important inputs and outputs in the Flower Shop Financial Model. This section is useful because a flower shop owner or founder needs to see the business at a glance before going deeper into individual schedules. The dashboard may summarize key assumptions such as store visitors, conversion rates, average order values, repeat customer behavior, revenue mix, payroll, operating expenses, and startup funding. It then connects those assumptions to core outputs such as total revenue, gross profit, EBITDA, net income, cash balance, break-even timing, and return metrics. For planning and funding purposes, this dashboard helps users quickly understand whether the business model is financially viable, where the strongest drivers are, and which assumptions need further review. It is especially helpful when presenting to stakeholders because it turns a complex financial forecast into a concise management view that supports faster decision-making and clearer communication.
Low, Base, and High Scenario Analysis
The low, base, and high scenario analysis section helps users evaluate how the flower shop may perform under different market conditions. A floral business can be affected by customer foot traffic, local competition, economic conditions, supplier pricing, wedding and event demand, holiday sales, subscription growth, and marketing performance. This component allows users to model conservative, expected, and optimistic outcomes by adjusting the assumptions that matter most, such as daily visitors, conversion rates, repeat customer percentages, average basket size, cost of goods sold, payroll timing, and operating expenses. The outputs show how each scenario changes revenue, cash flow, profitability, funding requirements, and potential investor returns. This is valuable for planning because it helps founders avoid relying on a single forecast that may be too optimistic or too cautious. It also supports lender and investor discussions by showing that management has considered uncertainty, tested downside risk, and identified the operating levers that could improve performance if actual results differ from expectations.
Professional Charts
The professional charts section turns the flower shop forecast into clear visual outputs that are easier to review, explain, and present. Financial models can become difficult to understand when users only look at rows of numbers, especially when presenting to banks, investors, partners, or internal teams. This component may visualize revenue growth, cost structure, cash flow movement, profitability trends, break-even timing, EBITDA development, funding needs, and key operating metrics over the forecast period. For a flower shop, charts can be especially useful because the business may experience seasonal changes, early-stage losses, gradual customer acquisition, and improving operating leverage as revenue scales. These visuals help users identify trends that may not be obvious in detailed schedules, such as periods of cash pressure, improving margins, or the point where fixed costs become easier to absorb. The section supports decision-making by making the financial story more understandable and presentation-ready, helping users communicate the business plan with greater clarity and confidence.
ROE Components and DuPont Analysis
The ROE components and DuPont analysis section helps users evaluate the quality and drivers of return on equity in the Flower Shop Financial Model. Return on equity is more than a single percentage; it is influenced by profitability, asset efficiency, and the capital structure used to fund the business. This component breaks return performance into underlying drivers, helping users see whether the flower shop’s returns are being driven by strong margins, efficient use of assets, leverage, or a combination of factors. Inputs may include net income, equity investment, asset levels, debt assumptions, sales performance, and margin behavior. Outputs can help founders, investors, and analysts understand how effectively the business converts invested capital into financial returns. For a flower shop, this is useful because the early years may require investment in store buildout, fixtures, refrigerated display cases, delivery capability, inventory, and working capital before the business reaches full performance. By reviewing ROE components, users can better assess capital efficiency, compare return potential, and identify whether improvements should come from pricing, margin control, asset utilization, or funding structure.
Revenue Inputs
The revenue inputs section is one of the most important parts of the Flower Shop Financial Model because it defines how the business generates sales. A flower shop’s revenue is typically driven by customer volume, conversion rates, average order value, repeat purchasing, product mix, subscription orders, corporate decor contracts, event work, and seasonal peaks such as Valentine’s Day, Mother’s Day, weddings, holidays, and local celebrations. This component allows users to enter or edit assumptions that reflect their local market and business strategy. It may include daily store visitors by day of the week, buyer conversion percentages, pricing for floral arrangements, subscription box volume, corporate customer growth, and other floral revenue drivers. The section then feeds the broader forecast so sales projections are based on operational logic rather than flat guesses. This is useful for planning because users can see how practical actions, such as improving merchandising, launching a loyalty program, increasing marketing, or expanding corporate outreach, may translate into higher revenue and stronger profitability over time.
Bank-Ready Reports
The bank-ready reports section provides structured financial outputs that can support loan applications, funding conversations, and professional business planning. Banks and investors usually want to see more than a basic sales estimate; they expect clear assumptions, projected financial statements, cash flow visibility, debt service capacity, profitability timing, and evidence that the business can manage risk. This component organizes the Flower Shop Financial Model into outputs that are easier for lenders and stakeholders to review, such as projected income statements, cash flow forecasts, balance sheet summaries, funding needs, repayment ability, and key financial metrics. For a flower shop seeking capital for a store buildout, delivery vehicle, refrigerated cases, inventory, working capital, or marketing, bank-ready reports help show how the requested funding supports the operating plan. This section is valuable because it improves credibility, saves time in preparing financial documents, and helps users present a more complete funding case. It also supports internal management by providing reports that can be updated as assumptions change or actual results become available.
Revenue Breakdown
The revenue breakdown section gives users a more detailed view of where sales are expected to come from across different revenue streams. A flower shop may generate income from everyday floral arrangements, walk-in purchases, custom bouquets, subscription boxes, corporate decor, weddings, events, delivery orders, workshops, sympathy arrangements, and holiday promotions. This component separates those streams so users can understand the contribution of each category rather than relying only on total revenue. Inputs may include pricing, order volume, growth rates, customer retention, purchase frequency, and service mix. Outputs may show revenue by channel, revenue share, growth by category, and the streams that contribute most to gross profit or long-term scalability. This is useful for decision-making because not every revenue source has the same margin, staffing requirement, inventory risk, or marketing need. By reviewing revenue in detail, users can identify which services deserve more investment, which categories are underperforming, and how to balance daily retail sales with recurring subscriptions and higher-value corporate or event opportunities.
KPI Dashboard
The KPI dashboard helps users monitor the operational and financial performance indicators that matter most for a flower shop. While financial statements show the overall results, key performance indicators explain what is driving those results. This component may track metrics such as revenue growth, gross margin, cost of goods sold percentage, average order value, customer conversion rate, repeat customer share, payroll as a percentage of revenue, operating expense ratio, EBITDA margin, cash balance, break-even progress, and return metrics. It may also include benchmarks that help users compare planned performance against industry expectations or internal targets. For a floral business, KPI tracking is useful because small changes in spoilage, supplier costs, staffing efficiency, pricing, or conversion rates can have a meaningful impact on profitability. The dashboard gives owners and managers a practical way to monitor progress, spot potential issues, and make informed adjustments. It is also helpful for stakeholder updates because it summarizes performance in a clear format without requiring every reviewer to inspect the full financial model.
Startup Costs Breakdown
The startup costs breakdown section helps users estimate the initial investment required to open or expand a flower shop. This component organizes one-time launch costs and pre-opening expenses so the funding requirement is based on a detailed budget rather than a rough estimate. Inputs may include store buildout, fixtures, refrigerated display cases, point-of-sale systems, website setup, branding, signage, delivery vehicle costs, initial inventory, packaging, tools, licenses, deposits, legal fees, initial marketing, staff training, and working capital reserves. The outputs help users calculate total startup funding needs, separate capital expenditures from operating expenses, and understand how much cash should be available before the business begins generating consistent revenue. For funding preparation, this section is especially important because lenders and investors want to know exactly how capital will be used and whether the opening budget is realistic. For management, it helps prevent undercapitalization, which is a common risk for new retail businesses. A clear startup cost plan supports better launch decisions and reduces the likelihood of unexpected cash shortages during the early operating period.
Break-Even Analysis
The break-even analysis section helps users understand when the flower shop may become profitable and what level of sales is needed to cover costs. This component connects revenue assumptions, gross margin, cost of goods sold, payroll, rent, marketing, utilities, insurance, software, delivery costs, and other operating expenses to determine the point at which the business no longer operates at a loss. It may show break-even timing in months, required monthly revenue, cumulative profit recovery, and the relationship between fixed costs and contribution margin. For a flower shop, break-even analysis is particularly useful because early years may involve losses while the business builds brand awareness, repeat customers, subscription demand, and corporate accounts. The section helps users set realistic expectations, plan funding reserves, and identify actions that can shorten the path to profitability, such as improving supplier terms, raising average order value, increasing conversion rates, reducing spoilage, or focusing on higher-margin services. It is also a valuable communication tool for investors and lenders because it shows the financial milestone at which the business begins to support itself more sustainably.
File types:
Excel – Single-User: .xlsx
Excel – Multi-User: .xlsx
Similar ProductsOther customers were also interested in...

 HenrySheykin
Grocery Store Financial Model Excel Template
The Grocery Store Financial Model helps entrepreneurs, founders, consultants, analysts, and retail b... Read more

Gift Shop Financial Model Excel Template
The Gift Shop Financial Model helps users build a structured financial forecast for a retail gift st... Read more
Candy Store Financial Model Excel Template
The Candy Store Financial Model helps entrepreneurs and planners turn a retail confectionery concept... Read more
Bakery Financial Model Excel Template
The Bakery Financial Model helps entrepreneurs, bakery owners, consultants, analysts, and business p... Read more
Pizzeria Financial Model Excel Template
The Pizza Restaurant Financial Model Template helps entrepreneurs, restaurant owners, consultants, a... Read more
Clothing Store Financial Model Excel Template
The Clothing Store Financial Model helps turn a retail apparel concept into a structured financial f... Read more

Food Truck Financial Model Excel Template
The Food Truck Financial Model helps entrepreneurs, founders, business owners, consultants, and anal... Read more
Lemonade Stand Financial Model Excel Template
The Lemonade Stand Financial Model helps users turn a small food and beverage business idea into a s... Read more
Greeting Cards Store Financial Model Excel Templat...
The Greeting Card Business Financial Model helps entrepreneurs and planners turn a creative card con... Read more
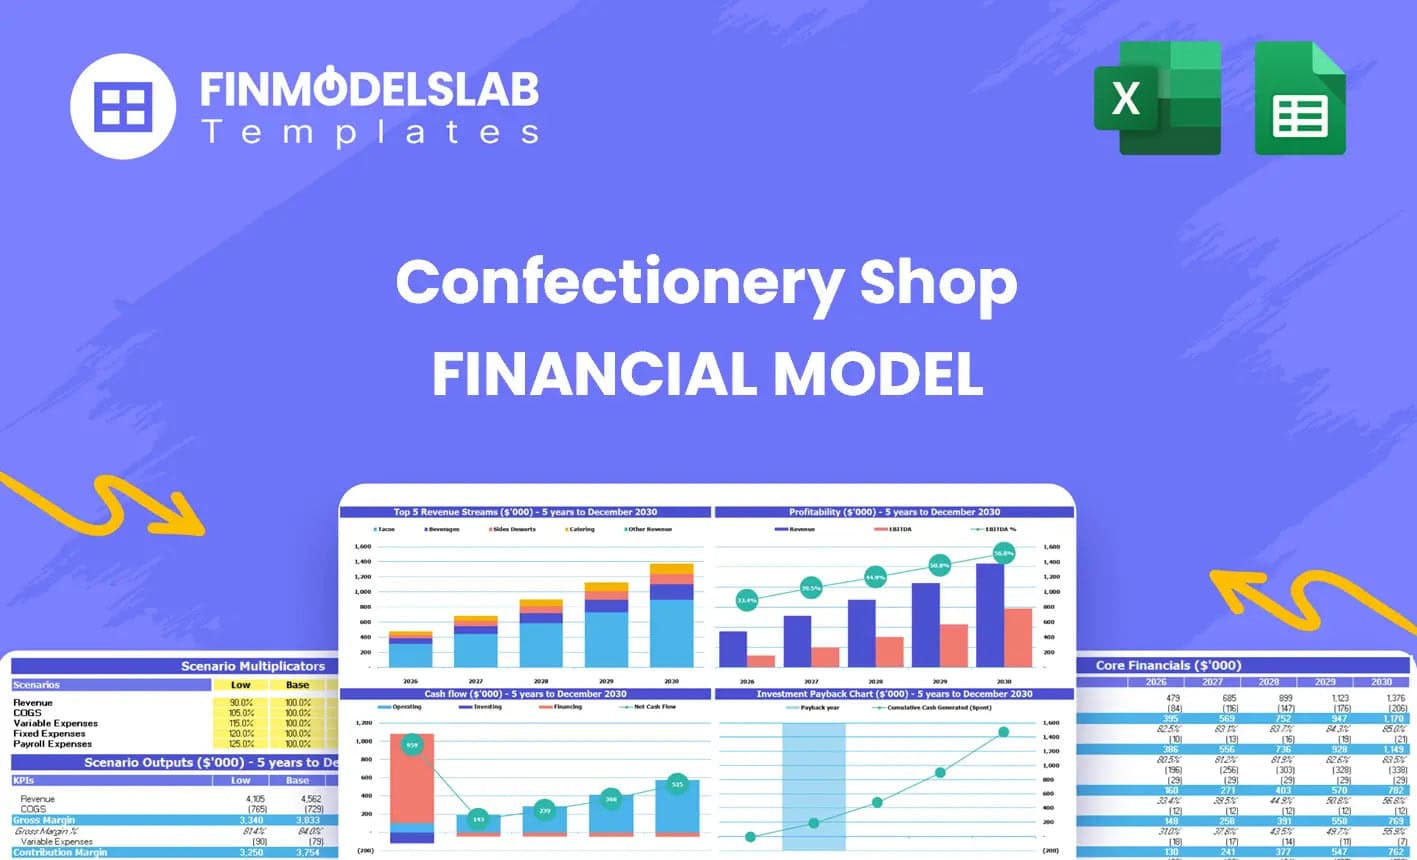
Confectionery Shop Financial Model Excel Template
The Confectionery Shop Financial Model helps turn a candy shop, sweet shop, dessert retail concept, ... Read more
You must log in to submit a review.