
0 ITEMS

Confectionery Shop Financial Model Excel Template
The Confectionery Shop Financial Model helps turn a candy shop, sweet shop, dessert retail concept, or specialty confectionery business plan into a structured five-year financial forecast. Instead of starting with a blank spreadsheet, users can work from a ready-made financial model template built around the realities of a retail confectionery operation, including customer traffic, buyer conversion, product mix, pricing, cost of goods sold, staffing, rent, marketing, startup investment, and cash flow. It is designed to help founders and planners estimate how the business may perform before committing capital, signing a lease, hiring staff, or approaching investors and lenders. This template is useful for entrepreneurs launching a new confectionery shop, existing shop owners planning expansion, consultants preparing business plans, analysts testing assumptions, and founders building funding documents. It gives users a practical way to connect revenue assumptions with operating expenses, payroll, inventory costs, and profitability outcomes. By adjusting editable inputs such as daily store visitors, conversion rates, average order values, product categories, salaries, and launch costs, users can see how small changes affect sales, margins, cash requirements, and long-term financial performance. The model supports financial planning and decision-making by organizing key forecasts into clear outputs, including revenue projections, profit and loss, cash flow, balance sheet summaries, investor metrics, and visual dashboards. It helps users understand when the business may reach break-even, how much startup capital may be required, whether cash balances are sufficient, and which revenue streams or expenses have the greatest impact on results. This makes it suitable for internal budgeting, investor presentations, loan applications, and strategic planning discussions. Because the Confectionery Shop Financial Model is fully editable and compatible with Excel and Google Sheets, it can be customized for different formats, locations, pricing strategies, product mixes, and growth plans. Whether the shop focuses on artisanal chocolates, gourmet sweets, nostalgic candies, curated gift baskets, event orders, or a broader dessert retail offer, the template provides a professional framework for evaluating feasibility, preparing financial projections, and making more informed business decisions.
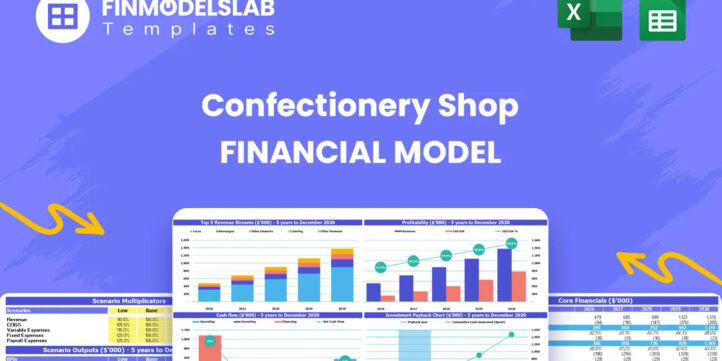


Financial Model Overview
The Confectionery Shop Financial Model is a ready-to-use financial model template designed for entrepreneurs, business owners, consultants, analysts, and founders planning a candy shop, sweet shop, dessert boutique, or specialty confectionery retail business. It brings together the major financial planning areas needed to evaluate the business before launch, expansion, or funding preparation, including revenue assumptions, product mix, cost of goods sold, payroll, operating expenses, startup investment, cash flow, profitability, and investor metrics.
A confectionery shop has unique planning requirements because sales depend on daily traffic, conversion rates, seasonal demand, impulse purchases, gift orders, premium product categories, and careful inventory management. This template helps users organize those assumptions in one structured model, forecast up to five years of financial performance, and present results in a clear format suitable for lenders, investors, partners, and internal decision-making.
All-in-One Dashboard
The all-in-one dashboard acts as the central control and summary area of the Confectionery Shop Financial Model. It is designed to combine core inputs and core outputs in one place so users can quickly understand the financial position of the business without navigating through every worksheet. Typical inputs may include launch timing, customer traffic assumptions, buyer conversion rates, pricing, product category mix, staffing levels, operating expense drivers, and funding assumptions. The dashboard then summarizes key outputs such as revenue, gross profit, EBITDA, net income, cash balance, return metrics, and funding needs.
For a confectionery shop, this is especially useful because many commercial drivers are connected. A change in weekend foot traffic may affect product sales, inventory needs, gross margin, staffing requirements, and cash flow. The dashboard helps users see these relationships clearly and supports faster decision-making during business planning, investor discussions, loan preparation, or ongoing performance reviews.
Low/Base/High Scenario Analysis
The Low/Base/High scenario analysis section helps users test how different assumptions may affect the financial performance of the confectionery shop. Instead of relying on one fixed forecast, the model allows users to evaluate a conservative case, a realistic base case, and an upside case.
Inputs may include visitor volume, conversion rate, average order value, product mix, pricing growth, cost of goods sold, payroll, marketing expenses, and operating cost inflation. A low case might assume slower traffic growth, weaker conversion, or higher ingredient costs, while a high case might assume stronger customer demand, improved repeat purchases, larger gift basket sales, or more bulk event orders. The outputs help users compare revenue, cash flow, profitability, funding needs, and investor returns under different conditions. This component is valuable because retail confectionery businesses can be affected by seasonality, local competition, economic conditions, and consumer trends. Scenario analysis helps users prepare for uncertainty and make more resilient financial decisions.
Professional Charts
The professional charts section converts the financial forecast into visual reports that are easier to review, explain, and present. Instead of relying only on rows of numbers, users can view key trends through charts showing revenue growth, gross margin, EBITDA, net income, cash balance, expense composition, product category performance, or other relevant financial metrics. These visuals are particularly helpful when presenting a confectionery shop business plan to investors, lenders, partners, landlords, or internal stakeholders who need to understand the financial story quickly. Inputs flow from the model’s revenue, expense, cash flow, and profitability assumptions, while the outputs present the results in a more accessible format.
For example, charts can show how sales grow as daily visitors and buyer conversion improve, how gross profit changes as the product mix shifts toward higher-margin items, or how cash balances evolve during the early growth period. This component helps users communicate financial plans more clearly and improves the professionalism of funding documents and presentations.
ROE Components and DuPont Analysis
The ROE components section uses DuPont analysis to break down return on equity into the underlying factors that drive it. Rather than showing return on equity as a single number, this component helps users understand how profitability, asset efficiency, and financial leverage contribute to investor returns. Inputs may include net income, revenue, total assets, equity investment, liabilities, and balance sheet assumptions generated throughout the model. The outputs can help users evaluate whether the confectionery shop’s return profile is being driven by operating margin improvement, better use of assets, increased sales productivity, or changes in financing structure.
For a confectionery shop, this analysis is useful because startup investments such as store build-out, display fixtures, shelving, kitchen or storage equipment, delivery capability, and initial working capital can be significant. DuPont analysis helps investors and owners understand whether the business is using that invested capital effectively and whether improvements in sales, margins, or cost control can strengthen long-term returns.
Revenue Inputs
The revenue inputs section is one of the most important parts of the Confectionery Shop Financial Model because it defines how the business generates sales. This component allows users to build the forecast around practical retail drivers such as daily store visitors, buyer conversion rates, average units per transaction, product pricing, order value, and sales mix across different confectionery categories. Relevant product streams may include artisanal chocolates, gourmet sweets, nostalgic candies, curated gift baskets, seasonal products, and bulk event orders.
Users can adjust assumptions to match their location, target market, retail format, local foot traffic, marketing strategy, and pricing plan. The outputs generated from these inputs feed directly into revenue projections, gross profit, cash flow, and profitability analysis. This section is useful because it forces the user to think beyond a single monthly sales estimate. It connects customer behavior with product-level assumptions, helping the planner evaluate whether the shop can attract enough buyers, achieve a strong enough average order value, and build a sales mix that supports sustainable margins.
Bank-Ready Reports
The bank-ready reports section provides lender-friendly financial outputs that help users present the confectionery shop opportunity in a structured and credible way. Banks and other financing providers typically want to see clear financial statements, realistic assumptions, startup funding needs, repayment capacity, projected cash flow, and evidence that the business can cover its obligations. This component organizes outputs such as profit and loss projections, cash flow forecasts, balance sheet summaries, debt assumptions, key ratios, and funding requirements into a professional reporting format.
Inputs may include loan amount, interest rate, repayment schedule, owner investment, startup costs, operating expenses, and revenue forecasts. For a confectionery shop seeking financing for build-out, fixtures, inventory, equipment, or working capital, this section helps demonstrate whether the business can support the requested funding. It is useful for preparing loan applications, investor documents, partner discussions, and internal financing reviews because it translates detailed assumptions into financial outputs that stakeholders are accustomed to evaluating.
Revenue Breakdown
The revenue breakdown section provides a detailed view of the shop’s revenue streams and helps users understand which products or categories contribute most to total sales. A confectionery shop often earns revenue from a mix of small impulse purchases, premium chocolates, packaged sweets, gift items, seasonal assortments, special occasion products, and larger event or corporate orders. This component allows the user to separate these streams, assign relevant pricing, estimate volume or order frequency, and evaluate how the sales mix changes over time. The outputs may include revenue by category, percentage contribution by stream, average order value trends, and the impact of product mix on gross margin.
This is useful because not all confectionery sales have the same profitability profile. Curated gift baskets or event orders may have higher ticket sizes, while nostalgic candies or everyday sweets may drive more frequent foot traffic. A detailed revenue breakdown helps users identify which categories deserve marketing focus, which products support margin expansion, and how revenue diversification can reduce business risk.
KPI Dashboard
The KPI dashboard tracks performance metrics and benchmarks that help users evaluate the health of the confectionery shop beyond basic revenue and profit figures. Key performance indicators may include revenue growth, gross margin, EBITDA margin, net profit margin, cash balance, average order value, customer conversion rate, sales per visitor, cost of goods sold percentage, payroll as a percentage of revenue, and return metrics. Inputs are drawn from the financial model’s revenue assumptions, expense schedules, staffing plan, and financial statements, while outputs are presented as clear metrics that can be reviewed at a glance.
For a confectionery shop, KPI tracking is valuable because it helps owners monitor whether the business is improving operationally as it grows. If traffic increases but profitability does not improve, the KPI dashboard can help identify whether the issue is pricing, product mix, labor cost, inventory cost, or overhead. This component supports ongoing decision-making, performance management, benchmarking, and investor communication by making the most important business metrics easy to follow.
Startup Costs and Initial Capital Planning
The startup costs and initial capital planning section helps users estimate the total investment required before the confectionery shop can open and operate smoothly. This component may include store build-out, interior design, display fixtures, shelving, signage, point-of-sale systems, refrigeration or storage equipment, licenses, deposits, initial inventory, packaging, branding, pre-opening marketing, professional fees, delivery vehicle costs, and opening working capital. Users can replace the pre-filled assumptions with quotes, lease terms, supplier estimates, and location-specific costs. The outputs help calculate total initial capital needed, owner contribution, potential loan requirements, and the cash buffer required during the early months of operation.
This is especially useful because confectionery shops often require an attractive retail environment, well-presented displays, reliable storage, and enough inventory variety to create a strong customer experience from day one. By organizing startup expenses clearly, the model helps users avoid underfunding the launch, prepare more accurate funding requests, and make informed decisions about which investments are essential versus optional.
Break-Even Analysis
The break-even analysis section helps users identify when the confectionery shop may reach the point where total revenue covers total costs. It uses revenue forecasts, gross margin assumptions, fixed operating expenses, payroll, cost of goods sold, and other expense drivers to estimate the sales level and timeline required to become self-sustaining. Outputs may include break-even month, break-even revenue, margin of safety, cumulative cash position, and the relationship between fixed costs and sales volume. For a confectionery shop, this analysis is important because the early months may include heavy startup spending, growing brand awareness, developing repeat customers, and refining product mix.
The break-even section helps users understand how many customers, orders, and sales dollars are needed to cover rent, wages, inventory, utilities, marketing, and other recurring expenses. It also supports decision-making by showing how pricing changes, higher-margin gift baskets, improved conversion rates, or stronger event orders can shorten the path to profitability. This makes the model more useful for funding conversations, operational planning, and setting realistic performance targets.
File types:
Excel – Single-User: .xlsx
Excel – Multi-User: .xlsx
Free Demo – .xlsx
Similar ProductsOther customers were also interested in...


 HenrySheykin
Coffee Shop Financial Model Excel Template
The Coffee Shop Financial Model helps entrepreneurs, founders, business owners, consultants, and ana... Read more
Pizzeria Financial Model Excel Template
The Pizza Restaurant Financial Model Template helps entrepreneurs, restaurant owners, consultants, a... Read more

Food Truck Financial Model Excel Template
The Food Truck Financial Model helps entrepreneurs, founders, business owners, consultants, and anal... Read more
Gourmet Food Store Financial Model Excel Template
The Gourmet Food Store Financial Model helps entrepreneurs, founders, business owners, consultants, ... Read more
Coffee Truck Financial Model Excel Template
The Coffee Truck Financial Model Template helps entrepreneurs, founders, consultants, and business p... Read more
 Pushkar
BAKERY – 3 Statement Financial Model with 5 ...
This Bakery Business Plan Model is a perfect tool for a financial feasibility study on launching a B... Read more

 ECF Consultancy
Startup Business Plan – Coffee Shop
If you dream of owning a coffee shop, the template is the first step in making your dream into reali... Read more
Bakery Financial Model Excel Template
The Bakery Financial Model helps entrepreneurs, bakery owners, consultants, analysts, and business p... Read more
Juice Bar Financial Model Excel Template
The Juice Bar Financial Model helps entrepreneurs, founders, consultants, analysts, and business own... Read more
Coffeehouse Financial Model Excel Template
The Coffee Shop Financial Model helps entrepreneurs, founders, business owners, consultants, and ana... Read more
You must log in to submit a review.