
0 ITEMS

Greeting Cards Store Financial Model Excel Template
The Greeting Card Business Financial Model helps entrepreneurs and planners turn a creative card concept into a structured financial forecast. Instead of estimating sales, costs, and cash needs in separate spreadsheets, this ready-to-use financial model template brings the major business drivers into one organized planning tool. It is designed to help users evaluate product pricing, card sales volume, seasonal demand, production costs, startup costs, operating expenses, payroll, cash flow, profitability, and funding needs before launching or expanding a greeting card brand. This template is useful for founders, business owners, consultants, analysts, and anyone preparing a business plan, investor presentation, bank loan package, or internal budget. A greeting card business may sell individual cards, curated bundles, holiday card sets, wedding cards, blank card packs, wholesale orders, online shop inventory, or custom designs, and each of these revenue assumptions can affect profitability in a different way. The model gives users a practical framework for testing these assumptions, reviewing the cost of goods sold, estimating marketing spend, planning staffing needs, and understanding how sales performance flows through to profit and cash. Built for financial planning and decision-making, the Greeting Card Business Financial Model supports up to five years of projections and helps users compare expected performance under different business conditions. It can be used to estimate initial launch investment, forecast monthly and annual revenue, calculate operating expenses, review cash flow timing, and assess when the business may reach break-even. This is especially important for a product-based creative business where inventory, materials, printing, packaging, website development, and marketing can create cash pressure before sales fully ramp up. The template is fully editable, compatible with Excel and Google Sheets, and structured for both non-financial users and experienced planners. Users can update assumptions for pricing, unit sales, production costs, payroll, overhead, funding, and growth rates to match their specific business plan. With built-in outputs, presentation-ready charts, reports, dashboards, profitability metrics, and scenario planning, the model helps buyers save time, reduce guesswork, and make more confident decisions about launching, funding, or scaling a greeting card business.


Financial Model Overview
The Greeting Card Business Financial Model is a ready-to-use financial model template designed to help entrepreneurs, business owners, consultants, and analysts evaluate the financial potential of a greeting card company. It brings together the key assumptions needed to plan a product-based creative business, including card sales volume, pricing, cost of goods sold, startup costs, payroll, operating expenses, cash flow, profitability, and funding needs.
A greeting card business can include individual cards, curated card bundles, holiday collections, wedding cards, blank card packs, wholesale orders, online sales, and custom stationery, so the financial model needs to connect multiple product lines with realistic cost and margin assumptions. This template helps users avoid building a forecast from scratch by providing a structured framework that can be edited for a specific launch plan, expansion strategy, investor pitch, loan application, or internal budget. By organizing inputs and outputs in a logical way, the model helps users understand whether the business can generate enough revenue, manage production costs, fund growth, and reach sustainable profitability over a five-year planning period.
All-in-One Dashboard
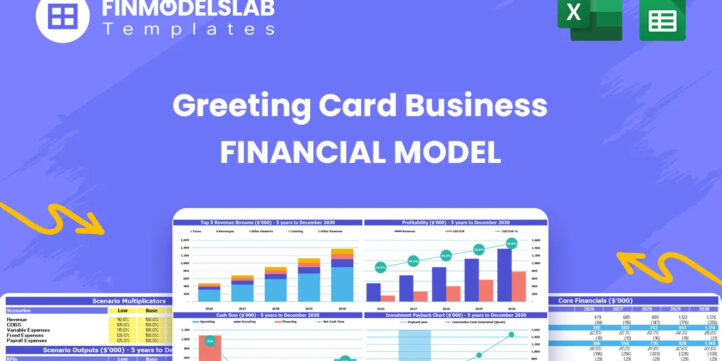
The all-in-one dashboard gives users a centralized view of the most important inputs and outputs in the Greeting Card Business Financial Model. It is designed to summarize the business at a glance, combining core assumptions such as pricing, sales volume, revenue growth, operating costs, payroll, investment needs, and cash position with key outputs such as revenue, gross profit, EBITDA, net income, and ending cash balance. For a greeting card business, this is especially useful because performance depends on many connected variables, including product mix, seasonality, material costs, customer acquisition, and sales channels.
The dashboard helps users quickly see how changes in assumptions affect overall results without having to search through every worksheet. It can support planning conversations with co-founders, advisors, lenders, or investors by showing the financial direction of the business in a clear and organized format. Because the model is editable, users can revise assumptions and use the dashboard as a live decision-making tool for launch planning, monthly reviews, annual budgeting, or funding preparation.
Low Base High Scenario Analysis
The Low Base High scenario analysis section helps users evaluate how the greeting card business may perform under different market conditions. Instead of relying on a single forecast, the model allows users to compare a conservative case, a realistic base case, and an optimistic growth case using assumptions such as sales volume, product pricing, revenue growth, cost inflation, marketing efficiency, staffing levels, and operating expense changes. This is valuable for a greeting card company because sales can fluctuate around holidays, wedding seasons, wholesale buying cycles, and consumer spending trends.
A low scenario may show how the business performs if card sales are slower than expected or if marketing costs rise, while a high scenario may show the impact of stronger demand, premium pricing, or expanded product lines. The output helps users understand risk, cash runway, profitability timing, and funding requirements across multiple outcomes. Scenario planning also strengthens business plans and investor discussions because it shows that the founder has considered uncertainty and prepared a flexible strategy rather than presenting only one version of the future.
Professional Charts
The professional charts section converts the financial model’s key calculations into clear visual reports that are easy to review and present. These charts may display revenue trends, expense categories, gross profit, EBITDA, net income, cash flow, product revenue mix, break-even timing, and other financial performance indicators over the forecast period. For a greeting card business, visual reporting is useful because stakeholders often need to understand how product sales, seasonal growth, and production costs influence the overall financial story.
Charts make it easier to identify whether revenue is scaling fast enough, whether costs are under control, and whether profitability improves as volume increases. They can also help founders compare different product lines, such as individual cards, curated bundles, holiday sets, wedding cards, and blank card packs, to see which categories contribute the most to growth. These presentation-ready visuals are useful for investor decks, bank meetings, internal planning sessions, and strategic reviews because they turn detailed spreadsheet data into a concise narrative that supports faster decision-making.
ROE Components and DuPont Analysis
The ROE components and DuPont analysis section helps users understand the drivers behind return on equity and overall financial efficiency. Rather than looking only at top-line revenue or net income, this component breaks performance into underlying factors such as profitability, asset efficiency, and leverage, showing how each part contributes to return on equity. For a greeting card business, this can be helpful when evaluating whether the company is using invested capital effectively, whether margins are improving, and whether growth is being supported by efficient operations.
Inputs may include projected net income, revenue, assets, equity, liabilities, and balance sheet assumptions, while outputs can show how operating performance and capital structure affect investor returns. This type of analysis is especially useful for founders preparing funding materials because it provides a more sophisticated view of business performance than a simple profit forecast. It also helps owners identify whether better returns are more likely to come from improving margins, increasing sales efficiency, managing inventory more carefully, or adjusting financing assumptions.
Revenue Inputs
The revenue inputs section is where users define the commercial assumptions that drive the Greeting Card Business Financial Model. This area may include unit sales, pricing, product categories, revenue growth rates, launch timing, seasonality, customer demand, channel mix, and assumptions for different card lines such as individual cards, curated bundles, holiday card sets, wedding cards, and blank card packs. B
ecause greeting card businesses often rely on both everyday purchases and seasonal spikes, having a clear revenue input structure helps users model demand in a more realistic way. Users can adjust pricing to test premium designs, bulk packs, wholesale discounts, direct-to-consumer sales, or special collections. The outputs from this section flow into revenue forecasts, gross profit, cash flow, and profitability calculations, making it one of the most important parts of the model. By documenting revenue assumptions clearly, founders can explain their business plan more confidently, compare product strategies, and determine whether the expected sales volume is strong enough to cover production costs, marketing expenses, payroll, and overhead.
Bank-Ready Reports
The bank-ready reports section provides structured financial outputs that can support loan applications, lender discussions, and formal business planning. These reports may include forecasted profit and loss statements, cash flow statements, balance sheets, debt schedules, financing assumptions, and summary metrics that lenders typically review when assessing repayment capacity. For a greeting card business, bank-ready reporting is useful when seeking funding for website development, printing equipment, initial raw materials, packaging, inventory, marketing, or working capital.
The model helps show how revenue is expected to grow, how operating expenses will be managed, and whether the business can maintain enough cash to meet obligations. Lenders often want to see clear assumptions, realistic expense planning, and a path to profitability, so this section helps users present financial information in a professional and consistent format. It can also help founders identify funding gaps before applying for financing, giving them time to adjust launch costs, reduce expenses, revise growth expectations, or plan a more appropriate loan amount.
Revenue Breakdown
The revenue breakdown section gives users a detailed view of how each revenue stream contributes to total sales. Instead of treating the greeting card business as one single revenue line, the model separates product categories so users can analyze the performance of individual cards, curated card bundles, holiday card sets, wedding cards, blank card packs, or other custom revenue streams. Inputs may include price per product, units sold, monthly sales assumptions, growth rates, channel mix, and product-specific cost assumptions. Outputs can show total revenue by category, contribution to overall sales, product mix trends, and the impact of changes in volume or pricing.
This is especially useful for a greeting card business because some products may have higher margins, stronger seasonal demand, or better scalability than others. A detailed revenue breakdown helps users identify which products deserve more marketing support, which items may need repricing, and how a shift toward bundles, premium cards, or seasonal collections could improve profitability. It also supports clearer business planning by showing stakeholders exactly where revenue is expected to come from.
KPI Dashboard
The KPI dashboard tracks the key performance indicators that matter most for managing and evaluating a greeting card business. These may include revenue growth, gross margin, EBITDA margin, net profit margin, cash balance, burn rate, payback period, return on equity, customer or order assumptions, product mix, cost of goods sold percentage, and other benchmark metrics. The purpose of this section is to help users monitor performance beyond the basic financial statements.
For a greeting card company, KPIs can reveal whether production costs are too high, whether marketing spend is supporting profitable growth, whether cash reserves are sufficient, and whether the business is moving toward sustainable margins. This component is useful for founders who need a quick way to review business health, consultants preparing client analysis, and investors or lenders who want concise performance indicators. By comparing projected results against targets or benchmarks, users can identify weaknesses in the plan, improve assumptions, and make more informed decisions about pricing, inventory, staffing, and expansion.
Startup Cost Breakdown
The startup cost breakdown section organizes the initial investment required to launch or prepare the greeting card business for operations. This component may include website development, brand identity, design assets, initial inventory raw materials, paper stock, ink, envelopes, packaging, office computer hardware, software, photography, legal setup, licensing, marketing launch costs, deposits, and working capital reserves. For a greeting card business, startup costs can be easy to underestimate because creative work, product development, printing preparation, ecommerce setup, and initial marketing often happen before meaningful revenue begins.
This section helps users calculate how much capital may be needed before launch and how that investment will be allocated. The outputs can support funding requests, founder contribution planning, startup budgets, and cash flow forecasting. By separating one-time launch expenses from ongoing operating expenses, the model makes it easier to understand the true cost of getting started and to avoid cash shortages during the early months. It also allows users to test different launch strategies, such as starting lean with outsourced printing or investing more upfront in equipment and inventory.
Break-Even Analysis
The break-even analysis section helps users estimate when the greeting card business may generate enough revenue to cover its total costs. It connects pricing, unit sales, product margins, fixed operating expenses, variable production costs, payroll, marketing spend, and overhead to determine the level of sales required to reach break-even. For a greeting card company, this is a critical planning tool because profitability depends not only on selling attractive designs but also on maintaining margins after paper, ink, printing, packaging, shipping, marketplace fees, and promotional costs.
The break-even output can show the point at which monthly or cumulative revenue equals costs, helping users understand how long the business may need funding support before becoming self-sustaining. This section is valuable for founders deciding how aggressively to market, how to price premium products, whether to focus on direct-to-consumer sales or wholesale accounts, and how much inventory to produce. It also gives lenders and investors a clear milestone for evaluating business viability and helps users make practical decisions about cost control, sales targets, and growth strategy.
File types:
Excel – Single-User: .xlsx
Excel – Multi-User: .xlsx
Free Demo – .xlsx
Similar ProductsOther customers were also interested in...


 HenrySheykin
Gift Shop Financial Model Excel Template
The Gift Shop Financial Model helps users build a structured financial forecast for a retail gift st... Read more

 Eastwich Advisors
Cannabis Grow, Manufacturing and/or Dispensary Pro...
The Cannabis Grow, Manufacturing and Dispensary Pro-Forma Model is a comprehensive financial tool de... Read more
 CFO Templates
Retail Business Financial Model
The Retail Financial Plan is an all-inclusive financial planning template for the retail industry. W... Read more
Grocery Store Financial Model Excel Template
The Grocery Store Financial Model helps entrepreneurs, founders, consultants, analysts, and retail b... Read more
Bakery Financial Model Excel Template
The Bakery Financial Model helps entrepreneurs, bakery owners, consultants, analysts, and business p... Read more
Pizzeria Financial Model Excel Template
The Pizza Restaurant Financial Model Template helps entrepreneurs, restaurant owners, consultants, a... Read more
Clothing Store Financial Model Excel Template
The Clothing Store Financial Model helps turn a retail apparel concept into a structured financial f... Read more
Bike Shop Financial Model Excel Template
The Bicycle Shop Financial Model helps entrepreneurs, business owners, consultants, analysts, and fo... Read more
Flower Shop Financial Model Excel Template
The Flower Shop Financial Model helps entrepreneurs, florists, business owners, consultants, and ana... Read more

Food Truck Financial Model Excel Template
The Food Truck Financial Model helps entrepreneurs, founders, business owners, consultants, and anal... Read more
You must log in to submit a review.