
0 ITEMS

Bike Shop Financial Model Excel Template
The Bicycle Shop Financial Model helps entrepreneurs, business owners, consultants, analysts, and founders turn a bike retail concept into a structured financial forecast. Instead of relying on a generic spreadsheet, this financial model template is built around the economics of a bicycle shop, including new bicycle sales, accessories and parts, repair services, inventory costs, staffing, operating expenses, and startup investment. It gives users a practical way to estimate how the business may perform before launch, expansion, acquisition, or funding discussions. This template supports financial planning by connecting the main assumptions that drive a bicycle shop’s results. Users can adjust daily store visitors, conversion rates, average bicycle prices, product mix, service revenue, payroll, rent, marketing, cost of goods sold, and capital expenditures to see how each decision affects revenue, profitability, cash flow, and funding needs. It is especially useful for anyone preparing a bike shop business plan, investor presentation, lender package, feasibility study, or internal operating budget. The model is designed to help users move from assumptions to decision-making. It can be used to evaluate startup costs, forecast monthly and annual operating expenses, review projected profit and loss, understand cash flow timing, and estimate when the shop may reach break-even. Because bicycle retail often depends on inventory planning, margin control, seasonal demand, and repeat repair customers, the template helps users analyze both high-value bike sales and recurring service-based revenue in one organized forecast. With editable inputs, pre-built formulas, presentation-ready outputs, and compatibility with Excel and Google Sheets, the Bicycle Shop Financial Model gives users a ready-to-use starting point while still allowing full customization. Whether you are opening a new local bike store, expanding an existing repair and retail operation, comparing funding scenarios, or advising a client, the template helps save time and create a clearer view of financial viability. It supports more confident decisions by showing how changes in pricing, customer traffic, staffing, inventory, and expenses can affect long-term profitability and cash position.
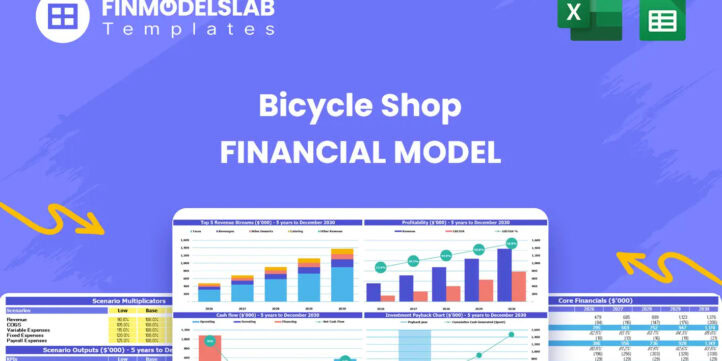


Financial Model Overview
The Bicycle Shop Financial Model is a ready-to-use financial model template designed specifically for the operating realities of a bike retail and repair business. It helps users forecast revenue from new bicycles, accessories and parts, and repair services while also accounting for inventory purchases, cost of goods sold, payroll, rent, marketing, capital expenditures, and cash flow timing. This makes it useful for entrepreneurs opening a new shop, existing bicycle retailers planning expansion, consultants preparing client forecasts, analysts evaluating acquisition opportunities, and founders developing business plans or funding documents. Instead of starting with a blank spreadsheet or adapting a generic retail model, users can work from a structure tailored to the drivers that matter most in bicycle retail. The template brings assumptions, financial statements, performance metrics, charts, and planning outputs into one editable model so users can test business decisions, estimate funding needs, and present a more credible financial plan to investors, lenders, partners, or internal stakeholders.
All-in-One Dashboard
The all-in-one dashboard brings the model’s most important inputs and outputs into a single summary view, giving users a practical control center for managing the bicycle shop forecast. This section is designed to show core assumptions such as visitor traffic, customer conversion, average bicycle selling price, product and service mix, expense levels, and growth expectations alongside key outputs such as projected revenue, EBITDA, cash balance, profitability, and return metrics. For a bicycle shop, this is especially useful because owners need to understand how retail sales, repair labor, accessory margins, and inventory costs work together rather than reviewing each item in isolation. The dashboard helps users quickly see whether the business plan is financially balanced, whether projected sales can support fixed costs, and whether cash reserves are sufficient during the early operating period. It also saves time when reviewing the model with advisors, co-founders, lenders, or investors because the main financial story can be seen at a glance before moving into the detailed schedules behind the forecast.
Low Base High Scenario Analysis
The low, base, and high scenario analysis section helps users evaluate how the Bicycle Shop Financial Model responds to different operating outcomes. Rather than relying on one fixed forecast, users can compare conservative, expected, and optimistic cases by changing assumptions such as daily store visitors, conversion rates, average order value, bicycle pricing, service demand, gross margin, payroll, and operating expense levels. This is important for bicycle shops because performance can vary based on seasonality, local competition, supplier availability, marketing effectiveness, weather patterns, and customer interest in commuting, recreation, or premium cycling products. The scenario analysis gives users a structured way to stress-test the forecast and understand the financial impact of underperformance or stronger-than-expected demand. It can help identify which assumptions have the greatest effect on cash flow and profitability, allowing users to plan for risk, define realistic sales targets, prepare contingency budgets, and present a more thoughtful financial case to stakeholders who want to see more than one possible outcome.
Professional Charts
The professional charts section translates the financial model’s detailed calculations into clear visual outputs that are easier to interpret and present. Instead of requiring users to manually build graphs, the template includes presentation-ready visuals that can help show trends in revenue, profit, EBITDA, cash flow, margins, and other important financial metrics over the forecast period. For a bicycle shop, these charts can make it easier to communicate how the business is expected to grow from initial launch through more stable operations, including the relationship between bike sales, accessories, repair services, operating costs, and cash position. Visual reporting is useful when preparing investor decks, lender submissions, management updates, or business plan materials because stakeholders often need to understand the forecast quickly without reviewing every worksheet. The charts also support internal decision-making by making patterns easier to identify, such as months where cash may tighten, years where margins improve, or periods where revenue growth depends heavily on customer traffic and conversion improvements.
ROE Components and DuPont Analysis
The ROE components and DuPont analysis section helps users evaluate the drivers behind return on equity rather than looking only at a single return figure. This part of the Bicycle Shop Financial Model breaks financial performance into underlying components such as profitability, asset efficiency, and leverage, showing how operating margins, use of assets, and capital structure can influence overall equity returns. For a bike shop, this matters because the business may require meaningful upfront investment in inventory, retail fixtures, leasehold improvements, repair equipment, and possibly delivery or service vehicles. Users can assess whether the shop is generating enough profit from its asset base and whether financing decisions are improving or weakening the overall return profile. This component is useful for investors, owners, and analysts who want to understand not just whether the business becomes profitable, but how efficiently it converts invested capital into returns. It also supports funding conversations by showing the financial logic behind growth plans, reinvestment decisions, and expected investor outcomes.
Revenue Inputs
The revenue inputs section is where users define the commercial assumptions that drive the bicycle shop forecast. It may include daily store visitors, conversion rates, average selling price for new bicycles, revenue mix across bicycles, accessories and parts, and repair services, along with repeat customer assumptions and growth expectations over time. This section is particularly important because bicycle shops often generate revenue from multiple sources with different margin profiles. A high-value bike sale may produce significant revenue but involve substantial inventory cost, while repair services and accessories can contribute recurring demand and stronger margins. By adjusting revenue assumptions, users can test how changes in foot traffic, pricing, service capacity, product mix, or customer loyalty affect total sales and profitability. This makes the template useful for planning launch strategy, evaluating marketing targets, setting sales goals, and validating whether the business has enough customer demand to support staffing, rent, inventory purchases, and other operating expenses.
Bank-Ready Reports
The bank-ready reports section provides structured financial outputs that can support lender conversations, funding applications, and professional business plan submissions. This component organizes the forecast into financial statements and summaries that are easier for banks, investors, and stakeholders to review, including projected profit and loss, cash flow, balance sheet information, and key financial metrics. For a bicycle shop seeking startup financing, working capital, inventory funding, or expansion capital, clear reporting is essential because lenders need to understand how the shop will generate revenue, manage expenses, repay obligations, and maintain liquidity. The reports help users present assumptions and outputs in a more polished and consistent format, reducing the risk of sending fragmented or incomplete financial information. They also support internal planning by showing whether the business can cover fixed costs, manage inventory purchases, and maintain a sufficient cash balance during ramp-up. This makes the model valuable not only as a spreadsheet, but also as a financial communication tool.
Revenue Breakdown
The revenue breakdown section gives users a detailed view of how total sales are distributed across the bicycle shop’s main revenue streams. Instead of showing only one top-line revenue number, this component separates income from new bicycle sales, accessories and parts, and repair services so users can understand which activities contribute most to growth, margins, and stability. This is important because each stream has a different operating profile. New bicycles may drive large transaction values and attract store traffic, accessories can increase the average order value and improve basket size, and repair services can create recurring customer relationships with strong labor-based margins. The revenue breakdown allows users to assess whether the business is too dependent on one category, whether accessory attachment rates need improvement, and whether service revenue can help stabilize cash flow during slower retail periods. It is useful for pricing decisions, inventory planning, marketing strategy, staffing choices, and conversations with funders who want to see the logic behind projected sales growth.
KPI Dashboard
The KPI dashboard section tracks the performance indicators that help users monitor the health of the bicycle shop over time. These metrics may include revenue growth, gross margin, EBITDA, cash balance, average transaction value, conversion rate, revenue mix, return metrics, and other measures that connect day-to-day assumptions with long-term financial outcomes. For a bicycle shop, KPIs are valuable because the owner must balance customer traffic, sales conversion, inventory turnover, repair service capacity, payroll efficiency, and profitability. The dashboard makes it easier to compare planned performance against targets and identify where operational improvements may be needed. For example, if visitor traffic is strong but revenue is below plan, the issue may be conversion, product mix, pricing, or accessory attachment. If revenue is growing but cash flow remains tight, the issue may involve inventory purchases, payment timing, or expense control. This section supports better decision-making by turning the forecast into a management tool that can be used beyond the initial business plan.
Startup Cost Breakdown
The startup cost breakdown section helps users organize the initial investment required to launch or acquire a bicycle shop. This component may include initial bicycle inventory, accessories and parts inventory, repair tools, workshop equipment, point-of-sale systems, lease deposits, leasehold improvements, signage, store fixtures, licenses, insurance, delivery vehicle costs, launch marketing, professional fees, and opening working capital. For a retail business with physical space and inventory requirements, underestimating startup costs can create cash pressure before the shop has had time to build recurring sales. The template helps users itemize these launch expenses so they can estimate total funding needs more accurately and avoid relying on broad guesses. It is useful for preparing investor requests, bank loan applications, owner contribution planning, and pre-opening budgets. By separating one-time startup costs from ongoing operating expenses, this section also gives users a clearer view of how much capital is required before operations begin and how much cash should remain available to support the business during its ramp-up phase.
Break-Even Analysis
The break-even analysis section helps users identify when the bicycle shop is expected to cover its costs and move toward sustainable profitability. This component evaluates the relationship between revenue, gross margin, fixed operating expenses, startup investment, and cash flow to estimate the level of sales or timeframe required to reach break-even. For a bicycle shop, this is especially useful because the business may experience early losses while building customer awareness, stocking inventory, hiring staff, and establishing repair service demand. Users can test how changes in visitor traffic, conversion rate, average bicycle price, accessory sales, repair volume, payroll, rent, and marketing spend affect the break-even point. The output can help set monthly sales targets, determine how much working capital is needed, and evaluate whether the current business plan is realistic. It also strengthens funding discussions because investors and lenders often want to know how long it will take before the business can support itself. By showing the path to break-even, the model helps users make more disciplined decisions about pricing, cost control, staffing, inventory levels, and growth strategy.
File types:
Excel – Single-User: .xlsx
Excel – Multi-User: .xlsx
Similar ProductsOther customers were also interested in...



 HenrySheykin
Gift Shop Financial Model Excel Template
The Gift Shop Financial Model helps users build a structured financial forecast for a retail gift st... Read more
Appliance Store Financial Model Excel Template
The Appliance Store Financial Model helps entrepreneurs, founders, business owners, consultants, and... Read more
Etsy & Ebay Store Financial Model Excel Templa...
The Etsy and eBay Store Financial Model helps marketplace sellers, founders, consultants, and busine... Read more
Skateboard Shop Financial Model Excel Template
The Skateboard Shop Financial Model helps entrepreneurs, founders, retail business owners, consultan... Read more
Home Inventory Shop Financial Model Excel Template
The Home Inventory Service Financial Model helps entrepreneurs, business owners, consultants, analys... Read more
Greeting Cards Store Financial Model Excel Templat...
The Greeting Card Business Financial Model helps entrepreneurs and planners turn a creative card con... Read more
Collectibles And Antiques Marketplace Financial Mo...
The Antique Store Financial Model helps entrepreneurs, business owners, consultants, founders, and a... Read more

Drone Retail Store Financial Model Excel Template
The Drone Service Financial Model helps entrepreneurs, founders, business owners, consultants, and a... Read more

 Giorgos
Pet Shop Financial Model – Dynamic 10 Year Busin...
Financial Model providing a dynamic up to 10-year financial forecast for a startup or existing Pet S... Read more

Furniture Store Financial Model – Dynamic 10 Yea...
Financial Model providing a dynamic up to 10-year financial forecast for a startup or existing Furni... Read more
Reviews
You must log in to submit a review.