
0 ITEMS

Candy Store Financial Model Excel Template
The Candy Store Financial Model helps entrepreneurs and planners turn a retail confectionery concept into a structured financial forecast. Instead of starting with a blank spreadsheet, users get a ready-to-use model built around the economics of a candy store, including customer traffic, conversion rates, average order behavior, product mix, startup costs, operating expenses, payroll, inventory costs, cash flow, and profitability. It is designed to support planning before launch, expansion decisions, loan applications, investor discussions, and internal budgeting. This financial model template is useful for founders opening a neighborhood candy shop, business owners adding a confectionery retail concept, consultants preparing projections for clients, and analysts building funding documents or business plans. The model helps connect the commercial side of the business with the financial side, showing how daily visitors, buyer conversion, product pricing, cost of goods sold, rent, staffing, marketing, and other operating assumptions flow into revenue forecasts, profit and loss projections, cash flow expectations, and key investor metrics. The template is fully editable, allowing users to replace the included assumptions with their own store size, location, product categories, pricing strategy, staffing plan, launch budget, and growth expectations. It can help estimate the capital needed before opening, review monthly and annual financial performance, evaluate cash needs, and test how different assumptions affect profitability. Built-in scenario planning, dashboard views, charts, and lender-friendly reports make it easier to communicate the story behind the numbers to stakeholders. By organizing the financial planning process in one place, the Candy Store Financial Model supports better decision-making and reduces the risk of overlooking important cost or revenue drivers. Users can assess whether the business can reach break-even, understand when cash may be tight, compare low, base, and high cases, and identify the levers that matter most for growth. For anyone preparing a candy store business plan, funding request, or operational budget, this model provides a practical framework for building credible financial projections.
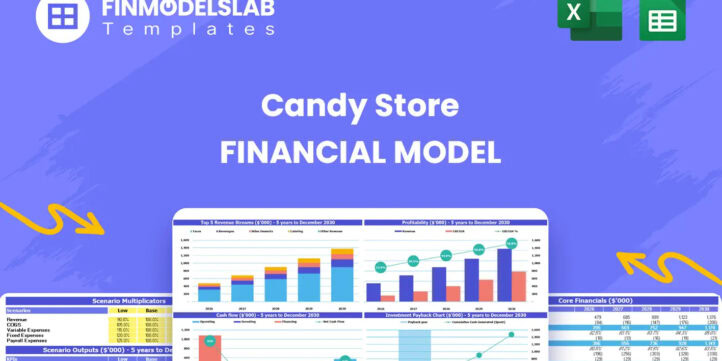


Financial Model Overview
The Candy Store Financial Model is a ready-to-use financial model template designed to help entrepreneurs, business owners, consultants, and analysts evaluate the financial potential of a retail candy shop. It brings together the key assumptions that shape a confectionery business, including customer traffic, conversion rates, average items per order, product pricing, inventory costs, store build-out expenses, payroll, rent, marketing, cash flow, profitability, and investor returns. Instead of building a forecast from scratch, users can work from a structured model that is already tailored to the economics of a candy store. The template is useful for business planning, funding preparation, lender conversations, investor presentations, and internal decision-making because it connects operating assumptions with financial outputs in a clear and editable format. Whether you are launching a new sweet shop, expanding an existing retail concept, or preparing projections for a client, the model helps you understand what the business needs to sell, spend, and retain in order to become financially sustainable.
All-in-One Dashboard
The all-in-one dashboard gives users a centralized view of the candy store’s core inputs and core outputs, making it easier to understand the overall financial picture without moving through every worksheet first. This component typically brings together key assumptions such as customer volume, sales conversion, product pricing, cost structure, payroll, startup investment, and financing assumptions, then connects them to outputs such as revenue, gross profit, EBITDA, net income, cash balance, and funding needs. For a candy store, this dashboard is especially useful because many of the most important drivers are operational, including daily foot traffic, average basket size, seasonal demand, and product category mix. By showing these drivers alongside forecast results, the dashboard helps users quickly see whether their assumptions create a viable business model. It also supports planning meetings and stakeholder reviews by giving founders, lenders, investors, and advisors a concise summary of performance, risks, and opportunities in one place.
Low Base High Scenario Analysis
The Low Base High scenario analysis section helps users test how the candy store may perform under different market and operating conditions. The low case can be used to reflect slower foot traffic, weaker conversion rates, lower average order values, higher cost of goods sold, or delayed growth, while the base case represents the expected plan and the high case reflects stronger customer demand, improved pricing power, higher repeat purchases, or more efficient cost control. Inputs may include visitor counts by day, buyer conversion percentages, product prices, inventory margins, payroll levels, marketing spend, and rent assumptions. The outputs show how each case affects revenue, profit margins, cash flow, break-even timing, and overall financial stability. This component is valuable for decision-making because it shows which assumptions have the greatest impact on results. It also makes the business plan more credible by demonstrating that the user has considered downside risk, realistic expectations, and upside potential rather than relying on a single optimistic forecast.
Professional Charts
The professional charts section converts the financial model’s results into visual reports that are easier to understand and present. Charts may show revenue growth, expense trends, gross margin, EBITDA, net profit, cash balance, break-even timing, product category contribution, or scenario comparisons across the forecast period. For a candy store, visual outputs are helpful because they can show how customer traffic growth, seasonal buying behavior, gift box sales, and operating leverage influence the business over time. The inputs behind these charts come from the forecast assumptions and calculated financial statements, while the outputs are presentation-ready visuals that support business plans, funding decks, lender meetings, and internal performance reviews. This component is useful because stakeholders often need to understand the story quickly, not just review detailed spreadsheet rows. Clear charts can highlight whether sales are scaling, whether margins are improving, whether cash remains sufficient, and whether the business is moving toward sustainable profitability.
ROE Components and DuPont Analysis
The ROE components and DuPont analysis section helps users understand the drivers behind return on equity rather than looking at one return figure in isolation. This component can break return on equity into underlying factors such as profit margin, asset turnover, and financial leverage, showing how operating performance, asset efficiency, and financing structure combine to influence investor returns. Inputs may include net income, revenue, total assets, equity, debt, and other balance sheet assumptions generated by the model. Outputs can include return on equity, return drivers, and a clearer explanation of whether returns are being created by stronger profitability, better use of assets, or higher leverage. For a candy store, this is useful when evaluating how efficiently the business turns retail space, inventory, fixtures, and working capital into earnings. It also supports investor discussions because it goes beyond simple profit projections and helps explain the quality of returns, the sustainability of growth, and the effect of financing decisions on owner value.
Revenue Inputs
The revenue inputs section is where users define the commercial assumptions that drive the candy store’s sales forecast. This may include daily foot traffic, buyer conversion rates, number of items per order, average selling prices, product categories, sales mix, seasonality, weekday versus weekend patterns, and growth over time. For a candy store, important revenue streams may include gourmet chocolates, nostalgic hard candies, international gummies, curated gift boxes, event favors, or other confectionery products. The model uses these assumptions to calculate monthly and annual revenue projections, helping users see how changes in traffic, pricing, product mix, or conversion rates affect total sales. This component is especially important because revenue is not treated as a generic percentage growth line. It is built from the operating logic of the store, which makes the forecast more transparent and easier to defend. Founders can use it to refine pricing strategy, evaluate product category priorities, set realistic sales targets, and understand how much demand is needed to support the store’s cost structure.
Bank-Ready Reports
The bank-ready reports section organizes the financial outputs in a format that is suitable for lenders, funding partners, and other stakeholders who need a clear view of repayment capacity and financial performance. This component may include projected profit and loss statements, cash flow forecasts, balance sheet summaries, debt service assumptions, funding requirements, and key financial metrics. Inputs are pulled from the broader model, including revenue assumptions, operating expenses, payroll, startup costs, financing terms, and working capital needs. Outputs help show whether the candy store can generate enough cash to cover rent, inventory, wages, marketing, taxes, loan payments, and ongoing operations. This section is useful for preparing loan applications or investor packages because it presents the financial plan in a structured and professional way. It helps users answer questions about how much capital is needed, how that capital will be used, when the business may become profitable, and whether the cash flow forecast supports the requested financing.
Revenue Breakdown
The revenue breakdown section gives users a detailed view of how each revenue stream contributes to total sales. Rather than showing only one total revenue line, this component can separate the candy store’s income by product category, such as chocolates, hard candies, gummies, gift boxes, event favors, or other retail items. Inputs may include category pricing, sales mix percentages, units sold, customer buying behavior, and planned changes in product mix over time. Outputs can show monthly and annual revenue by category, percentage contribution to total sales, category growth, and the effect of shifting demand toward higher-value or higher-margin products. For a candy store, this is useful because not every item contributes equally to profitability or customer appeal. Gift boxes may generate higher average order values, while smaller candy items may drive traffic and impulse purchases. By reviewing the revenue breakdown, users can make better decisions about merchandising, pricing, promotions, inventory planning, supplier purchasing, and product focus.
KPI Dashboard
The KPI dashboard provides a focused view of the performance metrics that matter most for managing a candy store. Key performance indicators may include revenue growth, gross margin, EBITDA margin, net profit margin, cash balance, average transaction value, conversion rate, customer volume, payroll as a percentage of sales, cost of goods sold, break-even progress, and return metrics. Inputs come from the model’s revenue assumptions, expense schedules, payroll plan, inventory cost assumptions, and financial statements. Outputs are summarized as easy-to-read metrics that help users track whether the business is performing according to plan. This component is useful because a candy store owner needs more than annual profit figures to manage the business effectively. The KPI dashboard helps identify early warning signs, such as rising inventory costs, weak conversion, excessive staffing costs, or slower-than-expected revenue growth. It also supports benchmarking and stakeholder communication by presenting performance in a concise format that can be reviewed regularly.
Break-Even Analysis
The break-even analysis section helps users identify when the candy store may become profitable and what level of sales is needed to cover fixed and variable costs. Inputs may include rent, payroll, utilities, insurance, marketing, administrative costs, product margins, cost of goods sold, average order value, customer conversion rate, and expected visitor traffic. Outputs may show the break-even date, required monthly revenue, required customer volume, contribution margin, and the impact of changing prices or costs on profitability timing. For a candy store, this is especially important because the business often carries meaningful fixed costs before sales ramp up, including store build-out, fixtures, lease commitments, staff, and opening inventory. Break-even analysis helps users understand whether the sales plan is realistic and how quickly the business must gain traction. It is also useful for funding discussions because lenders and investors often want to know when the company can stop relying on startup capital and begin supporting itself through operating cash flow.
Startup Cost Breakdown
The startup cost breakdown section organizes the initial investment needed to open or prepare the candy store for operations. Inputs may include store build-out and renovation, shelving and display fixtures, point-of-sale equipment, signage, refrigerator or display cooler, initial inventory stock, packaging, permits, licenses, professional fees, deposits, pre-opening marketing, and working capital reserves. Outputs help estimate the total launch budget, the amount of funding required before opening, and how startup capital will be allocated across one-time expenses and early operating needs. This component is useful because many retail businesses underestimate the cash required before the first sale is made. For a candy store, the quality of the retail environment, product presentation, inventory selection, and opening promotion can strongly affect customer perception and early traction. A structured startup cost breakdown helps users prepare more accurate funding requests, avoid missing important launch expenses, and create a realistic capital plan that supports operations through the early months of the business.
File types:
Excel – Single-User: .xlsx
Excel – Multi-User: .xlsx
Similar ProductsOther customers were also interested in...


 HenrySheykin
Grocery Store Financial Model Excel Template
The Grocery Store Financial Model helps entrepreneurs, founders, consultants, analysts, and retail b... Read more
Bakery Financial Model Excel Template
The Bakery Financial Model helps entrepreneurs, bakery owners, consultants, analysts, and business p... Read more
Clothing Store Financial Model Excel Template
The Clothing Store Financial Model helps turn a retail apparel concept into a structured financial f... Read more

 Giorgos
Mini Grocery Store Financial Model – Dynamic...
Financial Model providing a dynamic up to 10-year financial forecast for a startup or existing Mini ... Read more
 CFO Templates
Retail Business Financial Model
The Retail Financial Plan is an all-inclusive financial planning template for the retail industry. W... Read more

Gift Shop Financial Model Excel Template
The Gift Shop Financial Model helps users build a structured financial forecast for a retail gift st... Read more
Flower Shop Financial Model Excel Template
The Flower Shop Financial Model helps entrepreneurs, florists, business owners, consultants, and ana... Read more
Pizzeria Financial Model Excel Template
The Pizza Restaurant Financial Model Template helps entrepreneurs, restaurant owners, consultants, a... Read more
Liquor Store Financial Model Excel Template
The Liquor Store Financial Model helps entrepreneurs, store owners, consultants, analysts, and busin... Read more

Food Truck Financial Model Excel Template
The Food Truck Financial Model helps entrepreneurs, founders, business owners, consultants, and anal... Read more
You must log in to submit a review.