
0 ITEMS

Liquor Store Financial Model Excel Template
The Liquor Store Financial Model helps entrepreneurs, store owners, consultants, analysts, and business plan writers turn a retail alcohol business concept into a structured financial forecast. Instead of starting with a blank spreadsheet, users can work from a ready-to-use financial model template built around the drivers that matter for a liquor store, including customer traffic, conversion rates, repeat purchases, product mix, pricing, margins, startup costs, operating expenses, payroll, cash flow, and profitability. It gives users a practical way to evaluate whether a store can support its cost structure, attract funding, and move toward sustainable financial performance. This template is designed for planning a new liquor store, reviewing an expansion opportunity, preparing lender documents, or building an investor-ready business plan. It helps users document revenue assumptions across categories such as premium spirits, fine wines, craft beers, and tasting events, while also connecting those assumptions to cost of goods sold, staffing, rent, marketing, working capital, and other operating needs. Because the model is editable, users can replace the sample assumptions with their own store size, local market expectations, supplier terms, pricing strategy, and growth plan. The Liquor Store Financial Model also supports decision-making by showing how changes in assumptions affect results over time. Users can review cash flow needs, analyze profitability trends, test scenarios, evaluate return metrics, and identify when the business may reach break-even. This is especially useful for liquor stores because inventory investment, licensing, build-out costs, and supplier purchasing decisions can create meaningful cash requirements before sales fully ramp up. The template helps organize these moving parts into a single forecast so users can make more informed planning and budgeting decisions. For founders and business owners seeking financing, the model provides a clearer way to present the numbers lenders and investors typically review first. It brings together financial planning outputs, revenue assumptions, expense forecasts, payroll planning, break-even analysis, profitability projections, and cash flow reporting in a professional format. Whether used internally or shared with stakeholders, the template helps users explain the financial logic behind the business and evaluate the path from launch to a more stable, profitable liquor store operation.
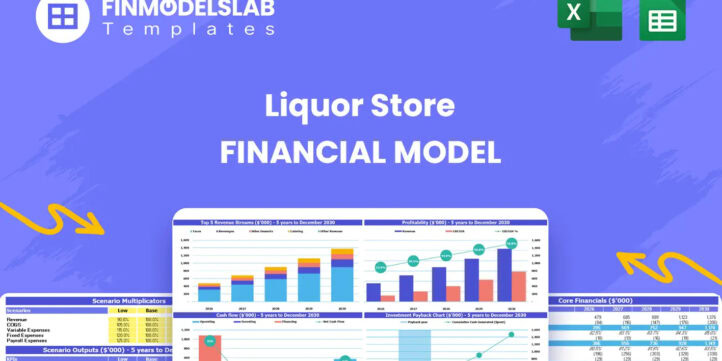


Financial Model Overview
The Liquor Store Financial Model is a ready-to-use financial model template designed to help users plan, evaluate, and present the financial outlook of a retail alcohol business. A liquor store has several important moving parts, including product category pricing, customer traffic, inventory costs, licensing, store build-out, staffing, rent, working capital, and cash flow timing. This template brings those assumptions into one structured model so entrepreneurs, business owners, consultants, and analysts can forecast revenue, expenses, profitability, funding needs, and financial performance without building a spreadsheet from scratch. It is useful for preparing a business plan, applying for a loan, reviewing investor expectations, assessing a new location, or planning the growth of an existing store. The model is editable, so users can adjust inputs such as daily visitors, conversion rates, sales mix, pricing, cost of goods sold, payroll, capital expenditures, and financing assumptions to reflect their own market and operating strategy. By connecting assumptions to financial outputs, the Liquor Store Financial Model helps users move beyond rough estimates and develop a more organized view of what the business may require, how it may perform, and which decisions are most important before launch or expansion.
All-in-One Dashboard
The all-in-one dashboard gives users a central view of the most important inputs and outputs in the Liquor Store Financial Model. This section is designed to make the model easier to navigate by bringing together key assumptions, summary results, and performance indicators in one place. Users can review major drivers such as revenue growth, customer volume, operating expenses, gross margin, EBITDA, cash position, and funding needs without having to search through every supporting schedule. The dashboard helps translate the detailed financial model into a practical management tool, making it easier to understand the overall direction of the business and identify which assumptions have the greatest impact on performance. For a liquor store, this is especially useful because the owner must balance inventory investment, supplier costs, staffing, store overhead, and sales growth while maintaining enough liquidity to operate. The dashboard supports planning meetings, lender discussions, investor presentations, and internal decision-making by providing a concise view of how the forecast is performing. It also helps users quickly compare the current plan against their goals and make adjustments when traffic, pricing, margins, or expenses change.
Low, Base, and High Scenario Analysis
The Low, Base, and High scenario analysis section helps users test how the liquor store may perform under different operating conditions. Rather than relying on a single forecast, the model allows users to compare a conservative case, a realistic base case, and an optimistic case. These scenarios can reflect changes in customer traffic, conversion rates, average order values, repeat purchases, product mix, gross margin, operating expenses, or sales growth. For example, a lower conversion rate or slower ramp-up in store visitors can show how much pressure the business may face in the early months, while a stronger sales mix or higher repeat customer rate can show the upside potential if the store performs better than expected. This component is useful for risk management because it helps users understand the sensitivity of revenue, profit, and cash flow to changes in key assumptions. Lenders and investors often want to see that a business owner has considered downside risk, not just the best-case outcome. By modeling multiple scenarios, users can prepare contingency plans, set realistic targets, define stretch goals, and make better decisions about startup funding, working capital reserves, marketing spend, and inventory commitments.
Professional Charts
The professional charts section converts financial projections into visual reports that are easier to understand and present. Instead of relying only on rows of numbers, users can view trends in revenue, profitability, cash flow, expenses, margins, and other key metrics through clear chart formats. This is valuable when presenting the Liquor Store Financial Model to lenders, investors, partners, landlords, advisors, or internal stakeholders who need to understand the business quickly. Charts can help show how revenue grows over time, when profitability begins to improve, how cash balances move during startup and expansion periods, and whether margins are strengthening or weakening. For a liquor store, visual reporting can also make it easier to explain the relationship between sales volume, inventory costs, operating expenses, and cash flow. This component supports more effective business plan presentations because it highlights the story behind the numbers. Users can use the charts to identify trends, spot potential issues, and communicate the financial plan with greater confidence. A well-structured chart section also makes the model more investor-ready by presenting financial information in a polished and accessible format.
ROE Components and DuPont Analysis
The ROE components and DuPont analysis section helps users evaluate how efficiently the liquor store generates returns from equity investment. Return on equity is an important metric for owners and investors because it shows how effectively shareholder capital is being used to produce profit. The DuPont approach breaks ROE into underlying drivers, such as profitability, asset efficiency, and leverage, so users can understand not only what the return is, but why it is changing. In a liquor store business, this can be especially useful because capital is often tied up in build-out costs, fixtures, equipment, initial inventory, deposits, and working capital. The model can help users see whether returns are being driven by better margins, stronger sales productivity, more efficient use of assets, or financing structure. This section supports deeper financial analysis beyond simple revenue and profit forecasts. It can help owners evaluate whether the business is improving operationally, whether the investment level is justified, and whether the company is building value over time. For funding discussions, DuPont analysis provides a more professional view of financial performance and gives investors a clearer basis for evaluating the long-term economics of the liquor store.
Revenue Inputs
The revenue inputs section is where users define the commercial assumptions that drive the liquor store forecast. This component may include assumptions for daily store visitors, conversion rate, repeat purchase behavior, average pricing, sales mix, category growth, and other revenue drivers. A liquor store does not usually rely on one simple source of income, so the model allows users to think through categories such as premium spirits, fine wines, craft beers, and tasting events, each with its own pricing and contribution to total sales. By separating these assumptions, users can build a more realistic revenue forecast and understand which categories are most important to the business plan. This section is useful because it connects market expectations to financial outputs. If a user changes visitor traffic, conversion rates, pricing, or product mix, the impact can flow through to revenue, gross profit, cash flow, and profitability. The revenue inputs also help users justify their business plan assumptions when speaking with lenders or investors. Instead of presenting a high-level sales estimate, users can explain the operational logic behind projected revenue and show how customer volume, sales behavior, and product strategy support the forecast.
Bank-Ready Reports
The bank-ready reports section provides lender-friendly financial outputs that help users present the Liquor Store Financial Model in a professional and organized format. Banks and lenders typically review sales assumptions, gross margins, operating expenses, cash flow, debt service capacity, and the overall ability of the business to remain liquid while repaying financing. This component helps consolidate the model’s projections into reports that can support loan applications, business plans, and funding conversations. It may include profit and loss projections, cash flow forecasts, balance sheet summaries, debt repayment analysis, and key financial metrics that lenders expect to review. For a liquor store, this is particularly important because startup costs, licensing, inventory purchases, and build-out expenses can create a significant upfront capital requirement. A clean reporting structure allows users to show how much funding is needed, how the funds may be used, how the store is expected to generate revenue, and whether cash flow can support operating costs and loan payments. Bank-ready reports save time by helping users avoid fragmented spreadsheets and giving stakeholders a clearer view of the financial plan.
Revenue Breakdown
The revenue breakdown section gives users a detailed view of the liquor store’s sales streams and how each category contributes to total revenue. Instead of treating all sales as one blended number, this component separates revenue by product or service category, such as premium spirits, fine wines, craft beers, tasting events, or other user-defined categories. Each stream can have its own pricing, mix, sales volume, growth assumptions, and margin implications. This makes the forecast more useful because different liquor store categories often behave differently. Premium spirits may carry higher average prices, craft beers may generate volume, fine wines may appeal to repeat buyers, and tasting events may support both direct sales and customer loyalty. The revenue breakdown helps users evaluate which categories are driving growth, which streams may require more inventory investment, and where pricing or marketing efforts could improve profitability. It also supports decision-making around shelf space, supplier negotiations, promotional campaigns, and event planning. For business plans and investor discussions, this section helps show that the revenue forecast is based on a specific sales strategy rather than a generic top-line assumption.
KPI Dashboard
The KPI dashboard helps users monitor performance metrics that are important for managing a liquor store and comparing progress against the forecast. Key performance indicators may include revenue growth, gross margin, EBITDA margin, cash balance, average order value, customer conversion rate, repeat purchase behavior, inventory-related metrics, expense ratios, and other financial or operating measures. This section is useful because it gives users a concise way to assess the health of the business and identify where attention is needed. For example, if revenue is growing but gross margin is declining, the owner may need to review supplier pricing, product mix, discounts, or shrinkage. If customer traffic is strong but conversion is weak, merchandising, staffing, promotions, or store layout may need improvement. If cash flow is tight despite profit growth, inventory purchasing and working capital timing may require closer control. The KPI dashboard turns the financial model into an ongoing planning tool rather than a one-time forecast. It is also helpful for stakeholders because it presents performance benchmarks and operating targets in a simple format that supports faster review, clearer communication, and more informed decision-making.
Startup Cost Planning
The startup cost planning section helps users estimate the initial investment required to open or expand a liquor store. This component may include store build-out and renovation, shelving and fixtures, point-of-sale systems, licensing and permits, security systems, signage, professional fees, deposits, opening marketing, initial inventory, delivery equipment, and working capital reserves. Liquor stores can require meaningful upfront spending before the first sale is made, so this section is important for understanding the full capital requirement and avoiding underfunding. Users can adjust each cost line to reflect the location, store size, market, licensing environment, and operating strategy. The outputs help calculate how much cash is needed before launch, how startup funds may be allocated, and how those costs affect the opening balance sheet and cash flow forecast. This section is valuable for funding preparation because lenders and investors want to see a detailed and justified use of funds. It also helps owners make better budgeting decisions by comparing essential costs against optional investments and ensuring that enough capital remains available for inventory, payroll, rent, and early operating needs.
Break-Even Analysis
The break-even analysis section helps users identify when the liquor store may generate enough revenue to cover its fixed and variable costs. This component uses assumptions from the revenue forecast, cost of goods sold, operating expenses, payroll, and other cost schedules to estimate the point where the business stops operating at a loss and begins moving toward profitability. For a liquor store, break-even timing is a critical planning metric because the business may carry significant fixed costs such as rent, utilities, insurance, salaries, licensing costs, and debt payments, while also managing variable costs tied to inventory purchases and product margins. The analysis can help users understand how much sales volume is required to support the cost structure and which assumptions have the greatest impact on reaching profitability. It is useful for pricing decisions, staffing plans, marketing budgets, inventory strategy, and funding discussions. If break-even appears too far away, users can test adjustments such as improving gross margin, reducing overhead, increasing conversion rates, refining product mix, or increasing customer retention. This section gives founders, owners, and advisors a clearer view of financial feasibility and helps guide decisions that can shorten the path to sustainable operations.
File types:
Excel – Single-User: .xlsx
Excel – Multi-User: .xlsx
Similar ProductsOther customers were also interested in...


 HenrySheykin
Bar Financial Model Excel Template
The Bar Financial Model Financial Model Template helps entrepreneurs, bar owners, consultants, analy... Read more
Juice Bar Financial Model Excel Template
The Juice Bar Financial Model helps entrepreneurs, founders, consultants, analysts, and business own... Read more
Karaoke Bar Business Plan Financial Model Excel Te...
The Karaoke Bar Financial Model helps entrepreneurs, business owners, consultants, founders, and ana... Read more
All Day Bar & Restaurant Financial Model Excel...
The All-Day Restaurant Financial Model helps users turn a food and beverage concept into a structure... Read more

 Giorgos
Cocktail Bar – 5 Year Financial Model
Financial Model providing an advanced 5-year financial plan for a startup or operating Cocktail Bar.... Read more
Grocery Store Financial Model Excel Template
The Grocery Store Financial Model helps entrepreneurs, founders, consultants, analysts, and retail b... Read more
Candy Store Financial Model Excel Template
The Candy Store Financial Model helps entrepreneurs and planners turn a retail confectionery concept... Read more
Bakery Financial Model Excel Template
The Bakery Financial Model helps entrepreneurs, bakery owners, consultants, analysts, and business p... Read more
Pizzeria Financial Model Excel Template
The Pizza Restaurant Financial Model Template helps entrepreneurs, restaurant owners, consultants, a... Read more
Coffee Shop Financial Model Excel Template
The Coffee Shop Financial Model helps entrepreneurs, founders, business owners, consultants, and ana... Read more
You must log in to submit a review.