0 ITEMS

Investment Appraisal: NPV, IRR & Payback in 5 Steps
A small business owner can decide whether a project is worth funding by forecasting its cash flows, discounting them at a rate that matches the risk, and accepting the project when its net present value is above zero, its internal rate of return beats the hurdle rate and its payback suits the owner’s cash position. In the illustrative example below, a packaging line and a software rollout both pass the value tests, yet they rank differently on each metric.
Key Takeaways
- Net present value (NPV) adds up a project’s cash flows in today’s money. Accept the project when NPV is above zero at a risk-matched discount rate.
- Internal rate of return (IRR) is the discount rate at which NPV equals zero. Compare it with the hurdle rate, never read it as profit.
- Payback measures only the speed of cash recovery. It ignores the time value of money and every cash flow after the recovery date.
- In this illustrative example, the packaging line has the higher NPV (69,977 USD, 10 percent, before tax); the rollout has the higher IRR and shorter payback.
- When NPV and IRR disagree on mutually exclusive projects, rank them by NPV, then test the answer at several discount rates.
Step 1: List the Cash Flows the Project Changes
An appraisal for a small and medium-sized enterprise (SME) starts with incremental cash flows: only the cash the project adds or removes. Collect the initial outlay in year 0, the extra net cash inflow in each later year (extra revenue minus extra cash costs, after tax where tax applies), and a realistic resale value at the end. Together these form the project’s free cash flow, meaning the net cash the project generates. Leave out sunk costs already spent, depreciation, which is an accounting charge and not cash, and loan payments, because the discount rate, the annual rate that converts future cash into today’s value, already prices the funding.
Step 2: Choose a Discount Rate That Matches the Project’s Risk
The discount rate is the rate used in the net present value (NPV) calculation. The textbook starting point is the firm’s cost of capital, the return that its lenders and owners require. OpenStax/16%3A_How_Companies_Think_about_Investing/16.03%3A_Net_Present_Value_(NPV)_Method) says the firm’s cost to attract capital should be the discount rate in theory. A project riskier than the usual business activity needs a higher rate, and the exact figure for a particular business is a judgement to agree with an accountant or adviser. The hurdle rate, the minimum return a project must earn, follows the same logic: Aswath Damodaran’s lecture slides base it on what an investor can make on investments of comparable risk.
Consistency matters as much as the level. The U.S. Office of Management and Budget states in Circular A-94 that nominal and real values must not be combined in the same analysis, so cash flows that include expected inflation need a nominal rate and inflation-free cash flows need a real rate. The discount rate tag on eFinancialModels lists models that handle the rate in different ways.
Step 3: Calculate NPV, IRR and Payback
Net present value is the sum of every cash flow divided by one plus the discount rate, raised to the power of its year, with the year-0 outlay entered as a negative number. The internal rate of return (IRR) is the discount rate at which that sum equals zero. Payback is the number of years until cumulative cash returns to zero: the full years before recovery plus the unrecovered balance divided by the next year’s inflow. Discounted payback applies the same method to the discounted inflows, so it respects the time value of money.
Worked Example: Two Projects Compared at One Discount Rate
All amounts are in USD, before tax and financing to keep the arithmetic simple, and every input is an illustrative assumption. Cash flows and the rate are both nominal, and resale value is assumed to be zero. Assume a 10 percent rate, which serves as both the discount rate and the hurdle rate, and two mutually exclusive projects, meaning that choosing one rules out the other. Project A, a packaging line, costs 250,000 in year 0 and returns 60,000, 80,000, 100,000, 100,000 and 90,000 in years 1 to 5. Project B, a software rollout, costs 120,000 and returns 70,000, 55,000, 30,000, 15,000 and 10,000. Assume the owner also wants cash back within three years.
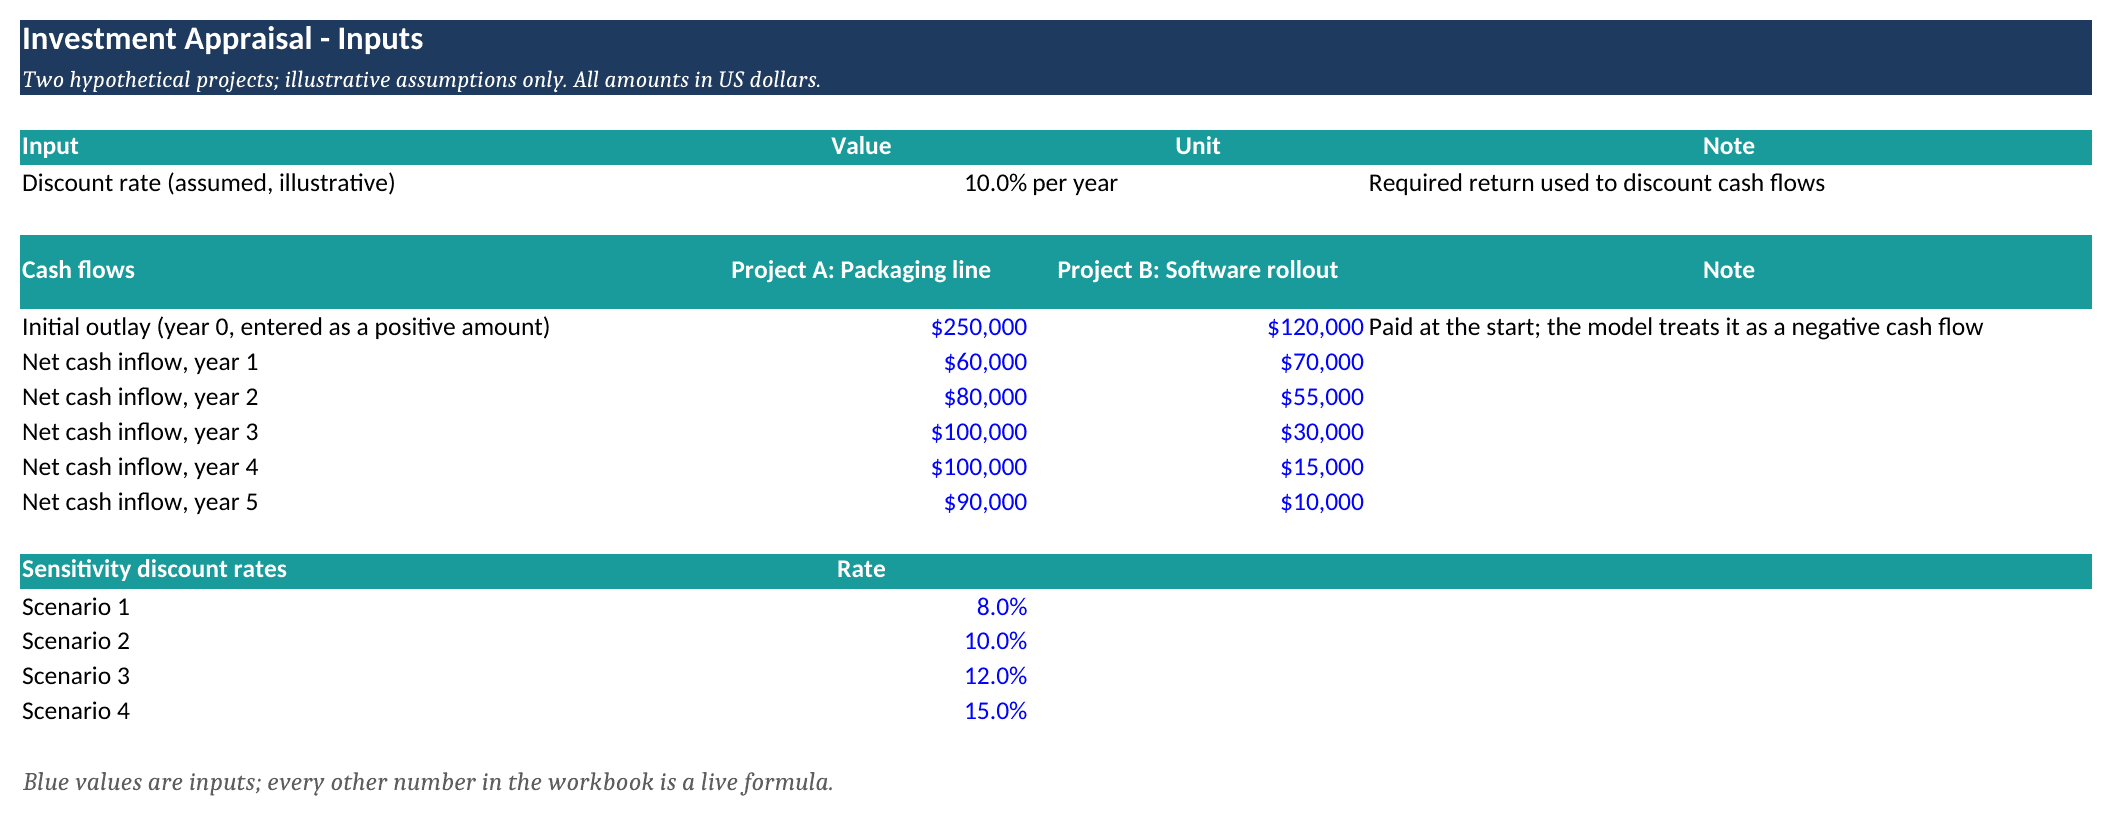
One input sheet drives every result in the workbook. Source: eFinancialModels Analysis
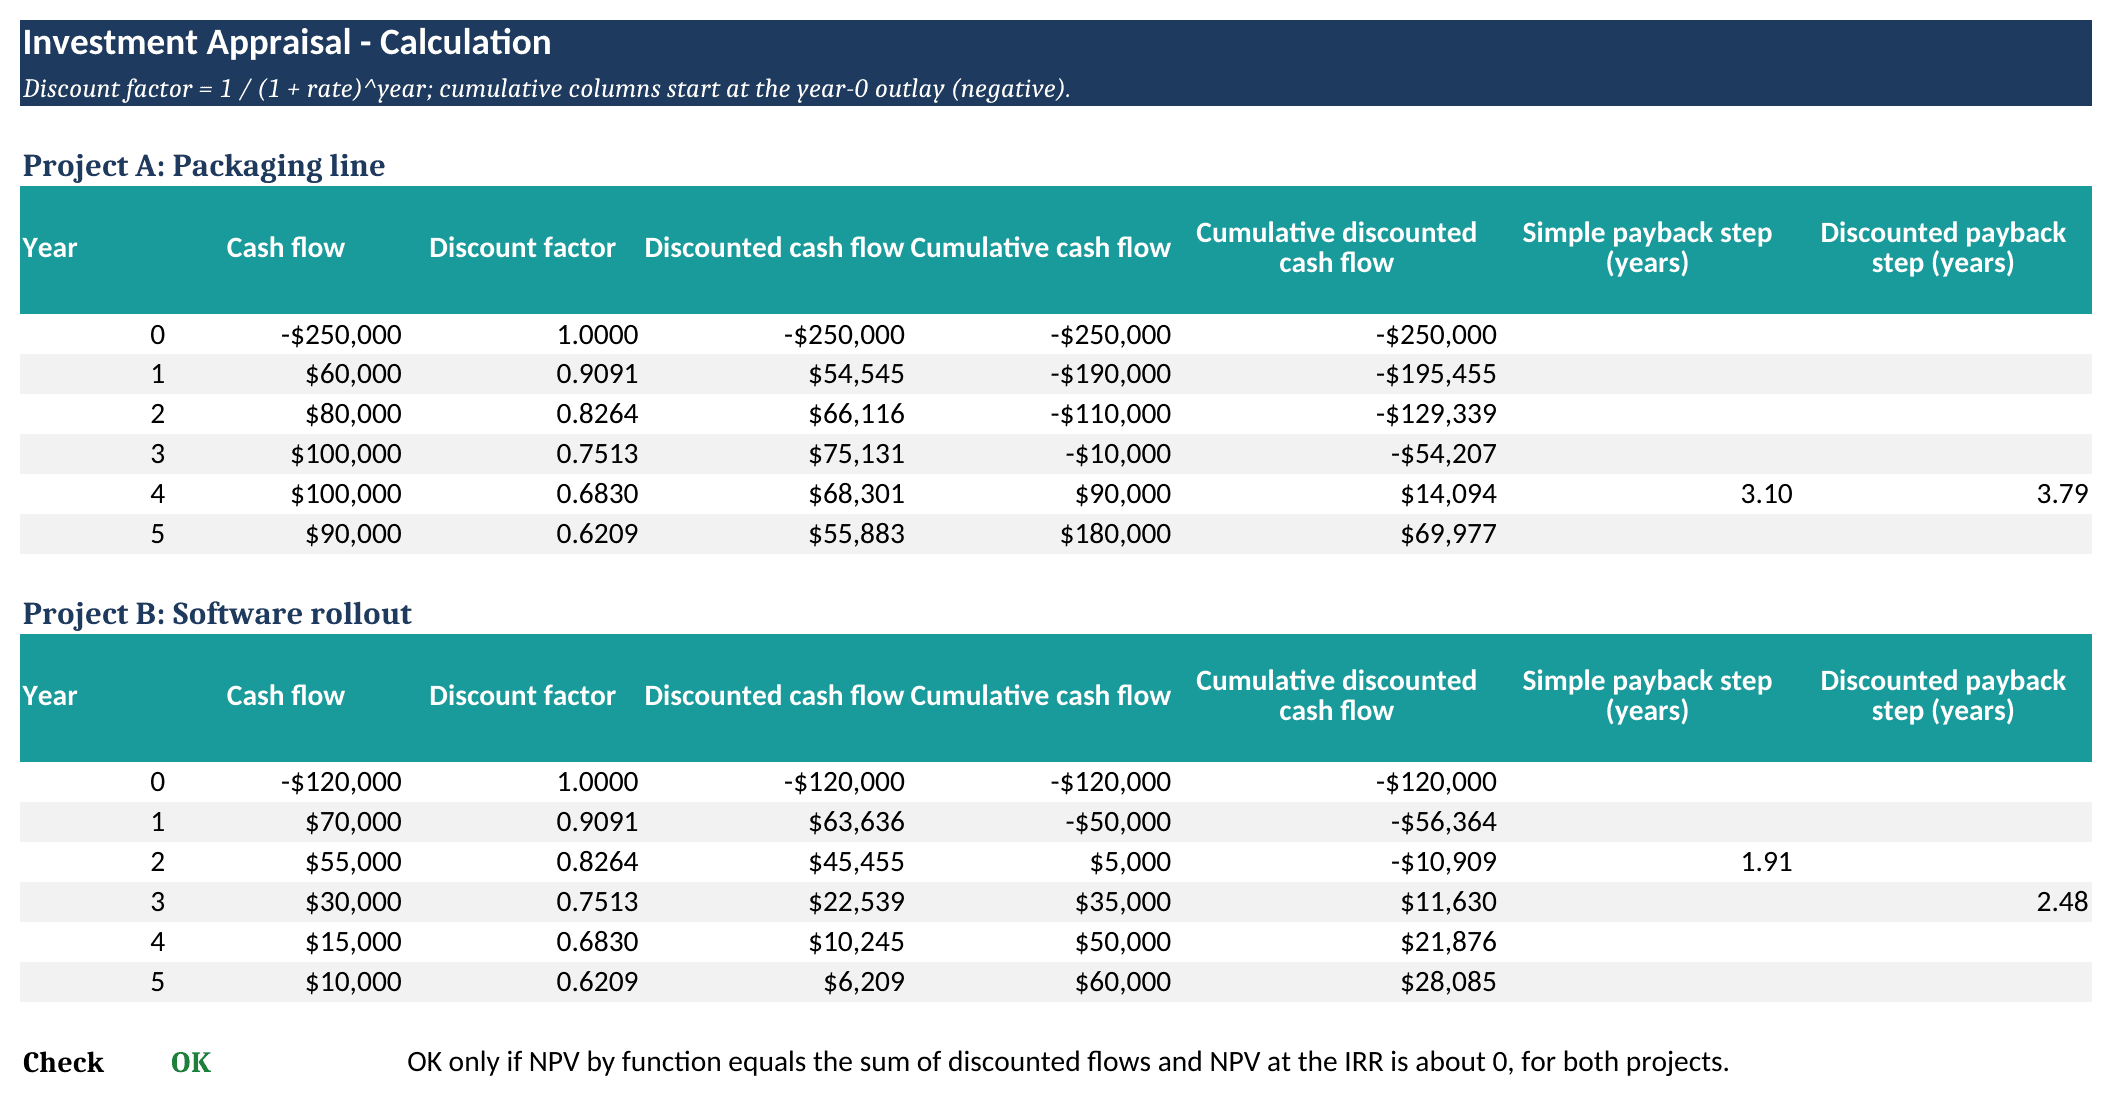
The calculation sheet discounts each inflow and tracks cumulative cash. Source: eFinancialModels Analysis
Discounting project A’s inflows at 10 percent gives 54,545.45, 66,115.70, 75,131.48, 68,301.35 and 55,882.92, which total 319,976.90, so its NPV is 69,977, which is 319,976.90 minus 250,000 rounded to the nearest dollar. Project B’s discounted inflows are 63,636.36, 45,454.55, 22,539.44, 10,245.20 and 6,209.21, totalling 148,084.76, so its NPV is 28,085, which is 148,084.76 minus 120,000 rounded to the nearest dollar. For simple payback, project A’s cumulative inflows are 60,000, 140,000 and 240,000 after years 1 to 3, leaving 10,000 unrecovered, and year 4 brings 100,000, so payback is 3 plus 10,000 divided by 100,000, or 3.10 years. Project B’s year 1 inflow of 70,000 leaves 50,000 unrecovered, and year 2 brings 55,000, so its payback is 1 plus 50,000 divided by 55,000, or 1.91 years. Discounted payback repeats this on discounted inflows: project A recovers 195,792.63 by year 3 and needs 54,207.37 of year 4’s 68,301.35, or 3.79 years; project B recovers 109,090.91 by year 2 and needs 10,909.09 of year 3’s 22,539.44, or 2.48 years. Only project B meets the three-year limit on either basis.
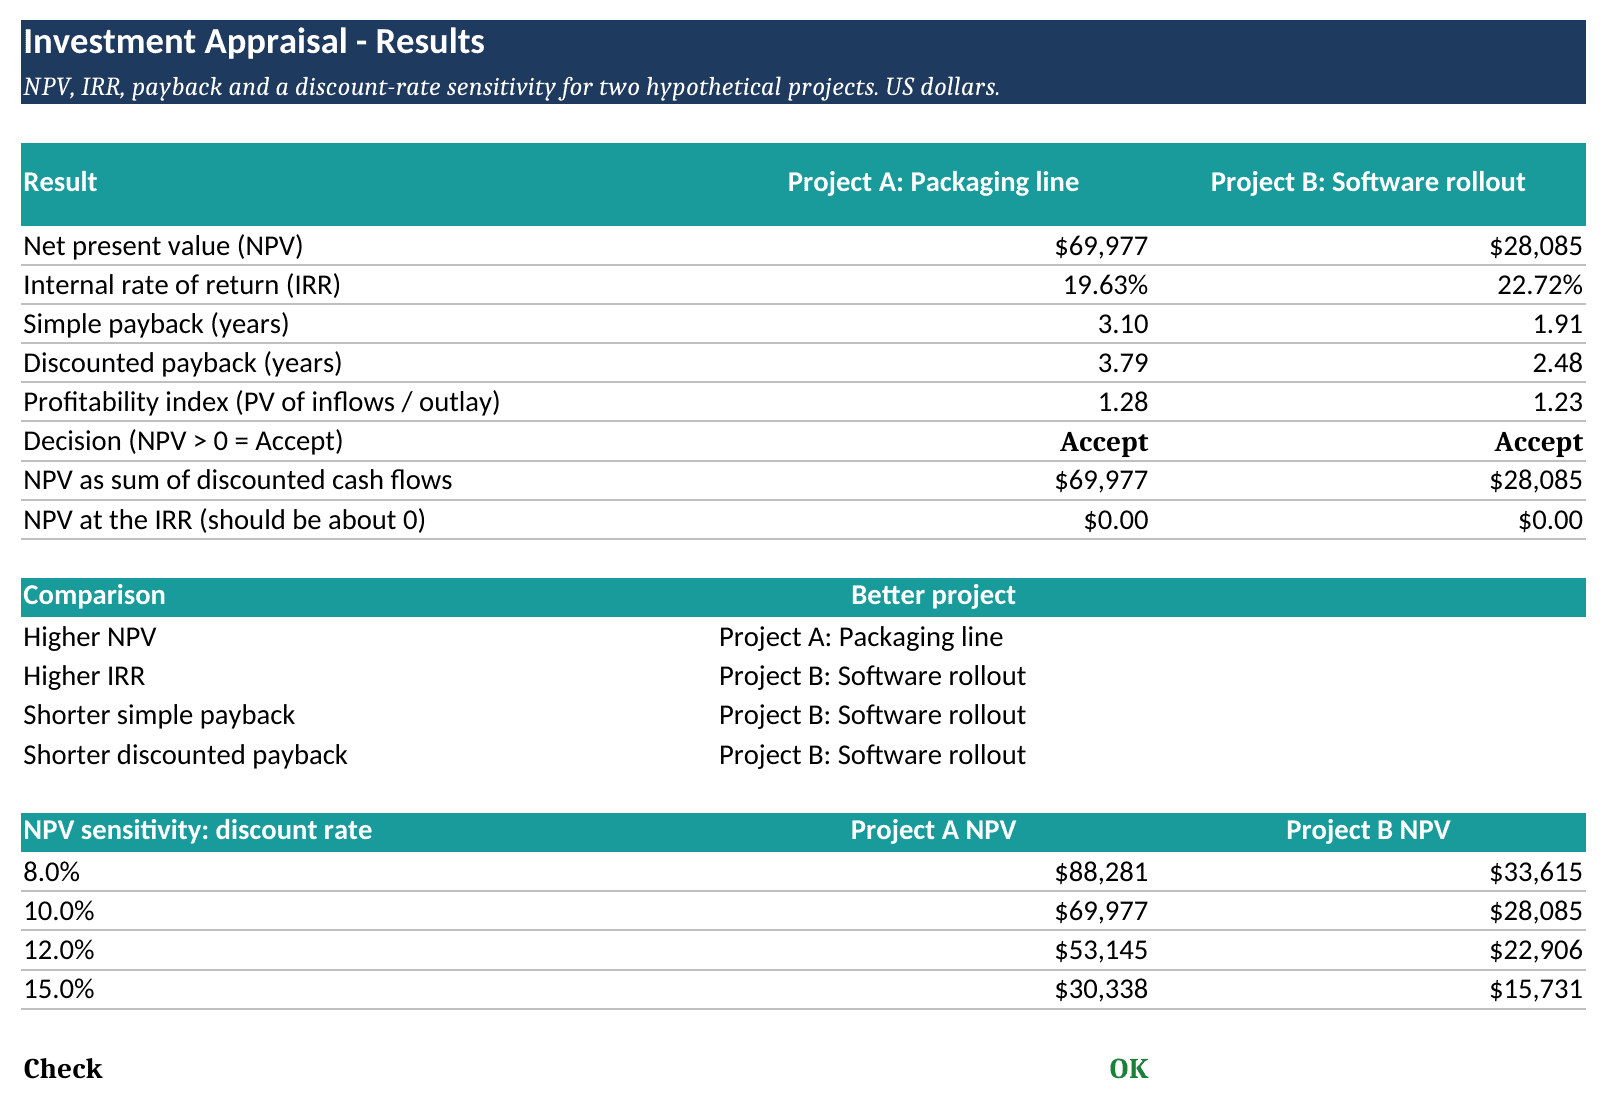
The results sheet compares both projects on every metric. Source: eFinancialModels Analysis
| Metric | Project A: packaging line | Project B: software rollout |
|---|---|---|
| NPV at 10 percent | 69,977 | 28,085 |
| IRR | 19.63 percent | 22.72 percent |
| Payback (years) | 3.10 | 1.91 |
| Discounted payback (years) | 3.79 | 2.48 |
Step 4: Read the Results and Decide
OpenStax says projects with a positive NPV should be accepted/16%3A_How_Companies_Think_about_Investing/16.03%3A_Net_Present_Value_(NPV)_Method), and a project passes on IRR when the rate is greater than the cost of capital/16%3A_How_Companies_Think_about_Investing/16.04%3A_Internal_Rate_of_Return_(IRR)_Method). Both projects pass, since both NPVs are positive and both IRRs exceed 10 percent. Payback splits them: project A at 3.10 years misses the three-year limit, while project B at 1.91 years meets it.
Payback screens liquidity, not value, because the payback calculation ignores the time value of money/16%3A_How_Companies_Think_about_Investing/16.02%3A_Payback_Period_Method) and cash flows after the payback period are ignored. It should not veto a higher-value project: an owner who can plan cash for the longer recovery picks project A, and one who cannot wait picks project B. Project A, with larger late inflows, fails the limit yet creates more value.
NPV and IRR rank the projects differently because of scale. Damodaran’s slides note that NPV is likely to be larger for large-scale projects, while IRR is higher for small-scale projects. Project A needs 130,000 more outlay (250,000 minus 120,000) and earns 41,892 more NPV (69,977 minus 28,085). The IRR method also ignores differences in project size/16%3A_How_Companies_Think_about_Investing/16.04%3A_Internal_Rate_of_Return_(IRR)_Method) and assumes cash flows are reinvested at the IRR itself, so for mutually exclusive projects the NPV ranking leads.
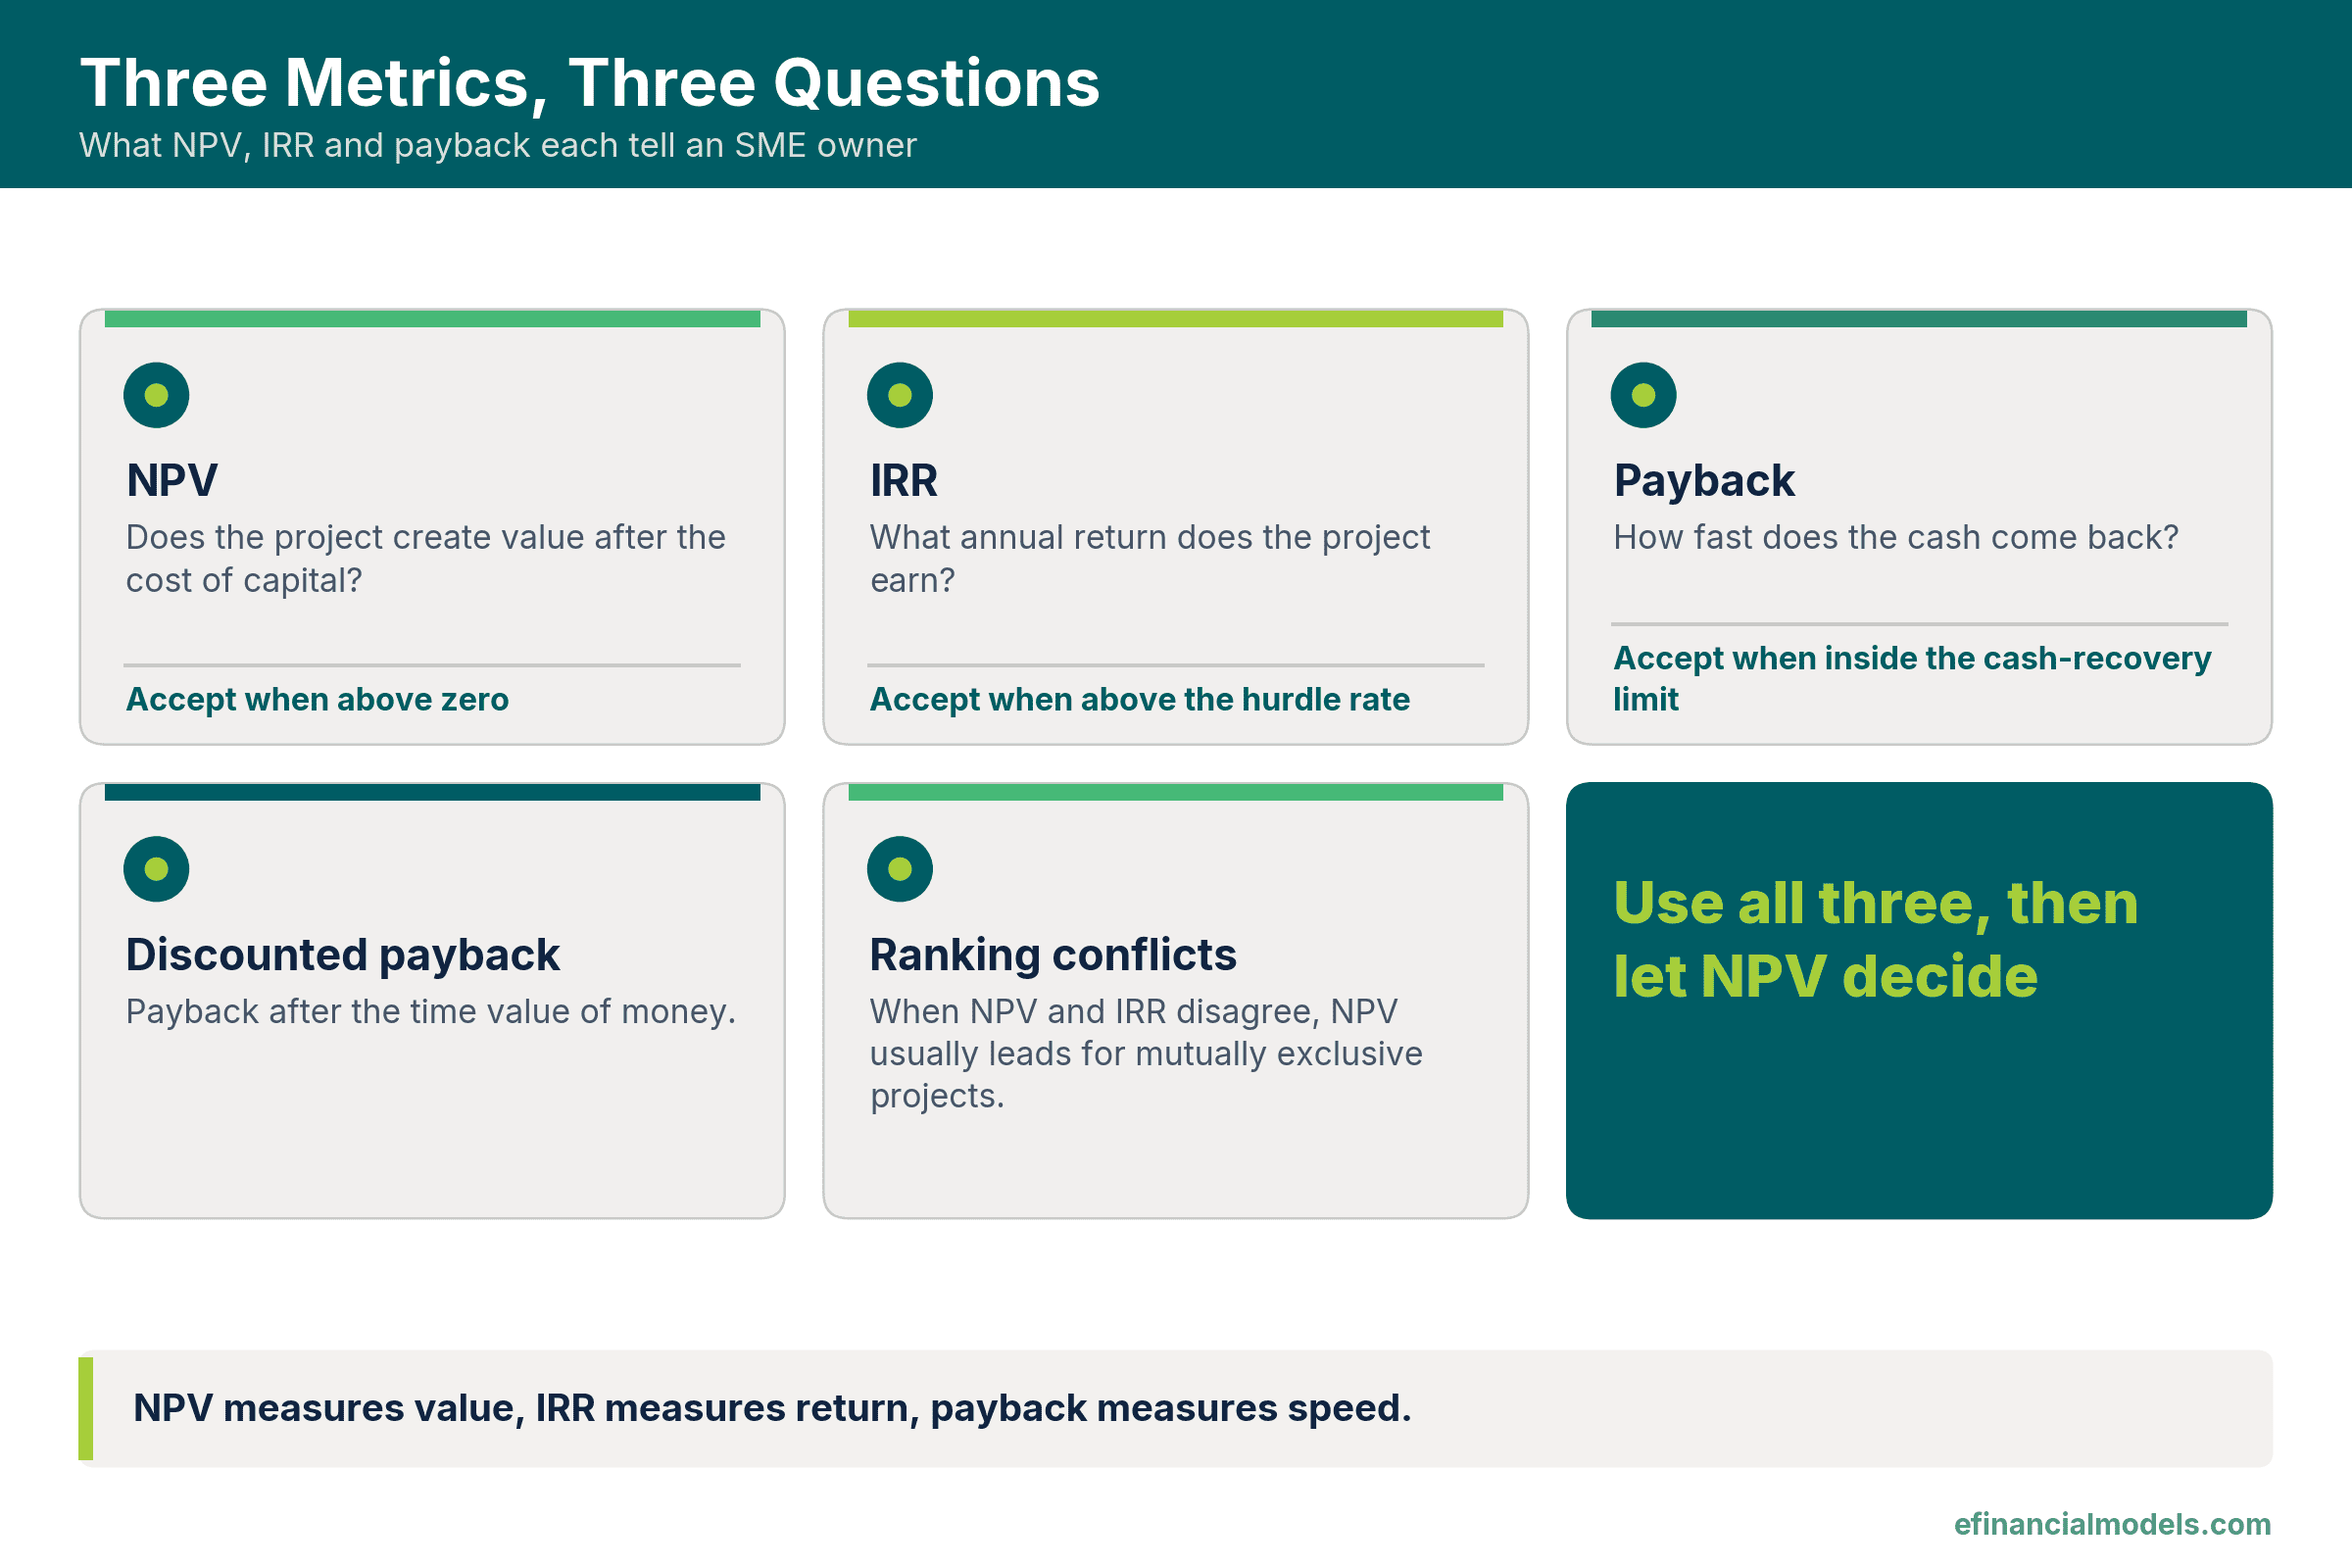
Each metric answers a different question, so an owner reads them together.
Step 5: Stress-Test the Answer
Sensitivity analysis, which means changing one input at a time to see how the result moves, shows whether the ranking survives a different discount rate. Here NPV was recalculated at four rates, and changing the inflows tests the cash flows the same way.
| Discount rate | Project A NPV | Project B NPV |
|---|---|---|
| 8 percent | 88,281 | 33,615 |
| 10 percent | 69,977 | 28,085 |
| 12 percent | 53,145 | 22,906 |
| 15 percent | 30,338 | 15,731 |
Both NPVs stay positive at every tested rate, and project A leads at each one. The two NPVs are equal at a rate of about 18.2 percent, the IRR of the cash flows that project A adds over project B, so project B ranks first only above that rate.
What This Means for a Growth-Stage SME
The Federal Reserve Banks’ 2026 Report on Employer Firms reported from its survey fielded in September to November 2025 that, among US small employer firms that applied for financing, 42 percent received the full amount they sought, 36 percent received some or most of it and 22 percent received none. The sample is not random.
An owner who cannot fund every positive-NPV project faces capital rationing, and should pick the affordable combination with the highest total NPV, using the profitability index (present value of inflows divided by outlay) to compare projects of different size. Here the index is 1.28 for project A (319,976.90 divided by 250,000) and 1.23 for project B (148,084.76 divided by 120,000). Tax treatment, depreciation allowances and loan terms change the cash flows and sit outside this method, so an accountant and a lender should review them.
Frequently Asked Questions
What counts as a good IRR for a small business project?
No single figure applies, because the benchmark is the hurdle rate for that project. A familiar line of business might need a return only modestly above the cost of funding, while a launch in a new market or an unproven technology justifies a wider cushion, a judgement to set with an adviser. A high rate on a very small project can also add less money than a modest rate on a larger one, so the rate should be read next to the amount invested.
Can a project with a negative NPV still be worth doing?
Occasionally, but the reason must be stated and measured. A legally required compliance upgrade or a safety investment may go ahead without a positive NPV, and the sensible choice is then the option with the least negative NPV. A project that merely feels strategic should be tested by estimating the later cash flows it would unlock, because a negative NPV means forecast returns fall below the discount rate.
Which spreadsheet functions calculate these metrics?
The NPV function discounts every value as if the first arrived one period from now, so the year-0 outlay is added outside the function. The IRR function takes the full range including year 0, and a date-based version handles irregular dates. Spreadsheets have no built-in payback function, so payback needs a cumulative cash row and a formula that finds the recovery year.
Conclusion
A sound appraisal forecasts incremental cash flows, discounts them at a risk-matched rate, and reads NPV, IRR and payback together, letting NPV decide between mutually exclusive projects. Readers who want a ready-made spreadsheet for the payback metric can use the eFinancialModels Payback Period Calculator.