
0 ITEMS

Fund Buying Distressed Real Estate: Financial Model Case Study
Table of Content

Key Takeaways
- Investor questions: what return can be expected, what can go wrong, which deals are profitable on their own, when cash comes back, and what the investors and the co-investing manager each earn.
- Business model: the fund buys at a discount, resolves the problem and sells at a fair price. The discount is not the profit, because time, legal cost, works and tax take a share.
- What mattered: returns per property, the time and cost of each route to resolve a property, net returns after costs and tax, and the manager’s performance share had to come from one integrated model, so that investors could test the plan before committing capital.
- Turning point: a fund-level IRR (internal rate of return, the annual return on the cash invested) blends all deals, so the model works per property and the fund and investor views are rolled up from it.
PDF2.5 MB
Free download · No email required
Download the Distressed Real Estate Fund Financial Model Case Study
✓ Model structure✓ Key assumptions✓ Results and takeaways
What return can investors expect from a fund that buys distressed real estate, and what can go wrong? Distressed assets are properties that are vacant, in default, in foreclosure or in need of repair, so they can be bought below their potential value. The fund itself is not in distress; the properties it buys are. Time, legal cost and works take their share of the discount, and a fund-level return averages every deal. The model prices the discount to value, the cost and time to repair or resolve each asset, and the resale or rental exit.
The Client and What Was at Stake
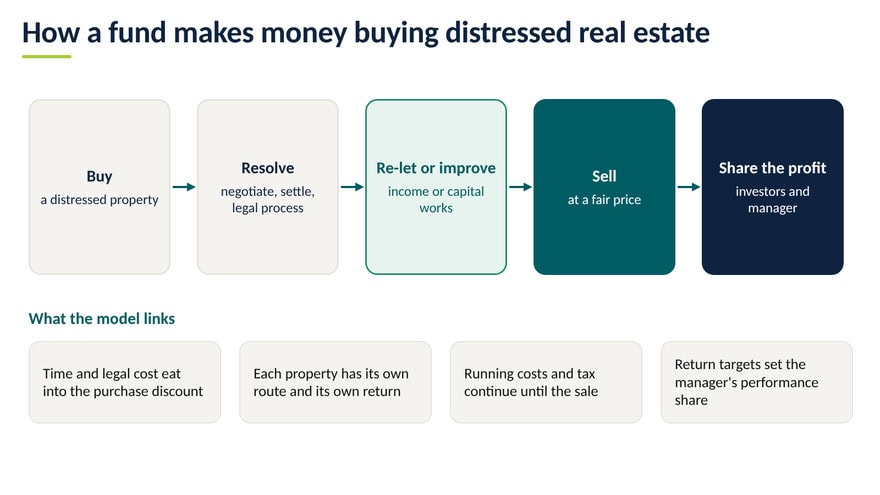
A private real estate fund, with a closed group of investor companies and a co-investing manager, planned to buy residential and commercial properties whose occupiers had defaulted on their loan repayments. Each had to be resolved, through negotiation, arbitration, legal process or re-letting, then a sale at a fair price rather than in a fire sale. The fund asked for a financial model. The fund buys a distressed property and resolves the problem by negotiation, arbitration or legal process, each with its own time and cost. Some properties are re-let, some need capital works. Waiting for a fair price avoids a fire sale, but costs accrue.
Why This Was Hard to Model
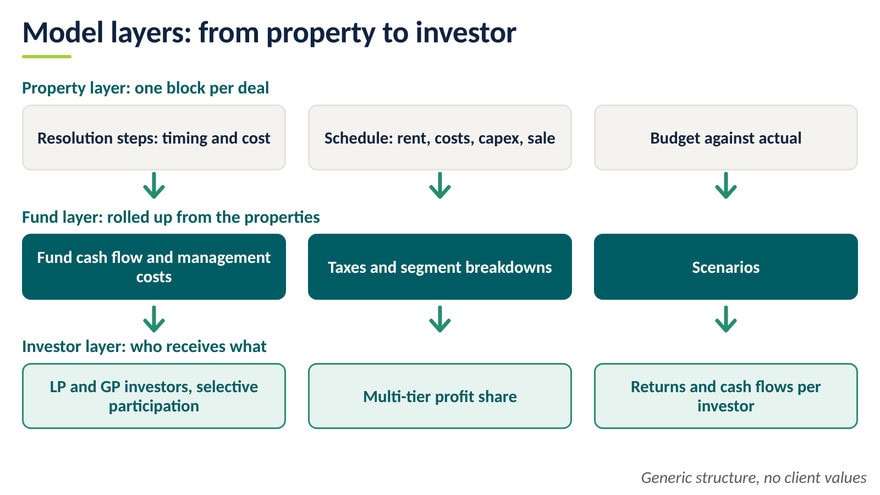
- Profit and return for every property. “What return can investors expect, deal by deal?” A fund-level IRR blends all deals, so strong deals mask weak ones. How we solved it: We built a schedule per property for rent, costs and sale, giving profit and return per deal, then summed to the fund.
- Pricing each route to resolve a property. “How long and how costly is each route, and what can go wrong?” Negotiation with the occupants, arbitration and legal process each take time, money and legal risk. How we solved it: We gave each step its own timing and cost, feeding the property’s cash flow.
- Settle, re-let, improve or sell. “What is the fallback if the preferred route fails?” Each route has its own assumptions and costs, and some properties need capital works (capex) first. How we solved it: We built each strategy in one property structure, so routes and the fallback compare on one basis.
- Costs and taxes, property to fund. “What is left for investors after running costs and taxes?” Property costs, fund costs, income tax and capital gains tax at exit arise at different points. How we solved it: We modelled each where it arises, per property or for the fund.
- Investor roles and the manager’s share. “What does each investor earn, and when? What if one joins only selected deals?” The manager co-invests and earns a performance share when return targets are met. How we solved it: We separated LP (limited partner) and GP (general partner, the manager) investors, routed each property’s cash to the investors in that deal, and built a multi-tier profit share.
- Market rates, portfolio mix and budget control. “Are prices in line with the market, and is each property on budget?” Properties differ in size and type, and overruns show early only with a budget per property. How we solved it: We compared price per unit of area with market rates, tagged each property by segment, and built a budget per property with actual costs, rolled up to the fund plan.
The Turning Point: From One Fund Figure to a Return Per Deal
A fund-level IRR can be calculated, but it blends every deal and does not show which deals are profitable on their own. The model therefore works per property, each with its own schedule, budget and return. Fund and investor views are rolled up from these, so each deal is judged on its own.
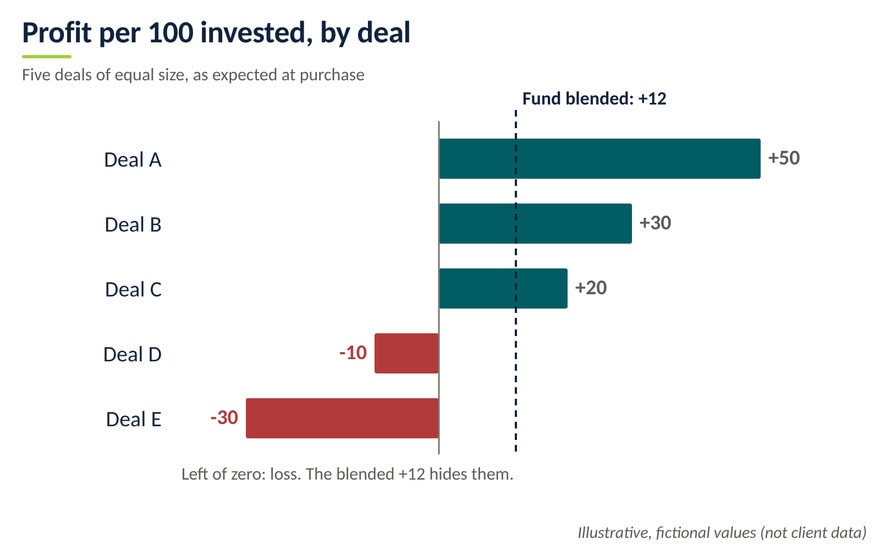
Worked example one: the fund figure hides weak deals. Take five equal deals of 100 each (invented numbers). The fund shows a profit of 60 on 500 invested, a multiple of 1.12, which looks acceptable. Yet D and E lose money; without them, the other three earn 100 on 300, a multiple of 1.33.
Worked example with fictional numbers: five deals as expected at purchase
| Deal | Invested | Expected to return | Profit | Multiple |
| Deal A | 100 | 150 | 50 | 1.50 |
| Deal B | 100 | 130 | 30 | 1.30 |
| Deal C | 100 | 120 | 20 | 1.20 |
| Deal D | 100 | 90 | -10 | 0.90 |
| Deal E | 100 | 70 | -30 | 0.70 |
| Fund, all five | 500 | 560 | 60 | 1.12 |
| Without D and E | 300 | 400 | 100 | 1.33 |
What Drives the Investors’ Return
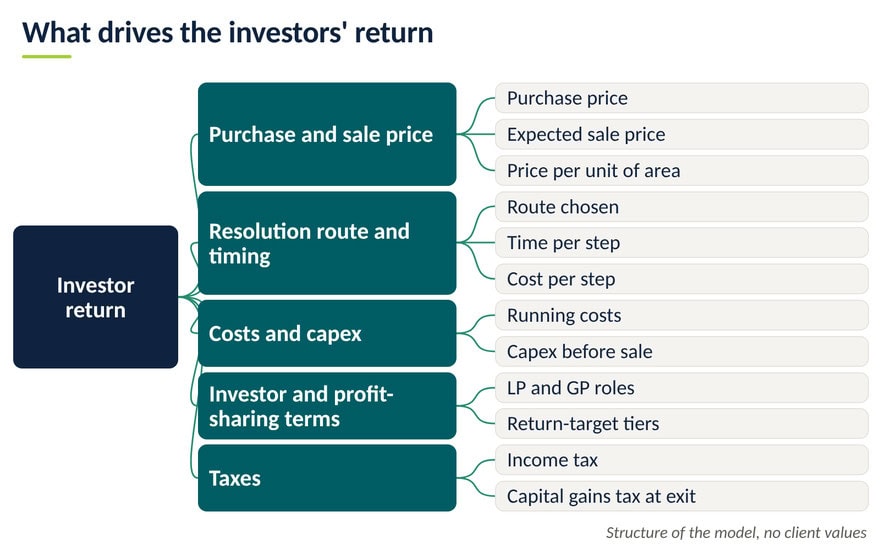
Five driver groups decide what investors receive: price, resolution route and timing, costs and capex, profit-sharing terms, and taxes.
Worked example two: the same property, two routes. A property bought at 100 sells for 150 on either route; running costs are 5 a year. Route A settles by negotiation for 5, paid in year 1, and sells at the end of year 2. Route B pays 15 for legal process in year 2 and sells at the end of year 4. Costs fall at year-end, before tax and fund costs. Profit falls by more than half and IRR from 15.5% to 3.1%: the same sale price arrives two years later, after a larger cost.
Worked example with fictional numbers: same purchase and sale price, two routes
| Item | Route A: settlement | Route B: legal process |
| Purchase price | 100 | 100 |
| Running costs (5 a year) | 10 | 20 |
| Settlement or legal cost | 5 | 15 |
| Total paid in | 115 | 135 |
| Sale price | 150 | 150 |
| Profit | 35 | 15 |
| Multiple (sale / paid in) | 1.30 | 1.11 |
| IRR | 15.5% | 3.1% |
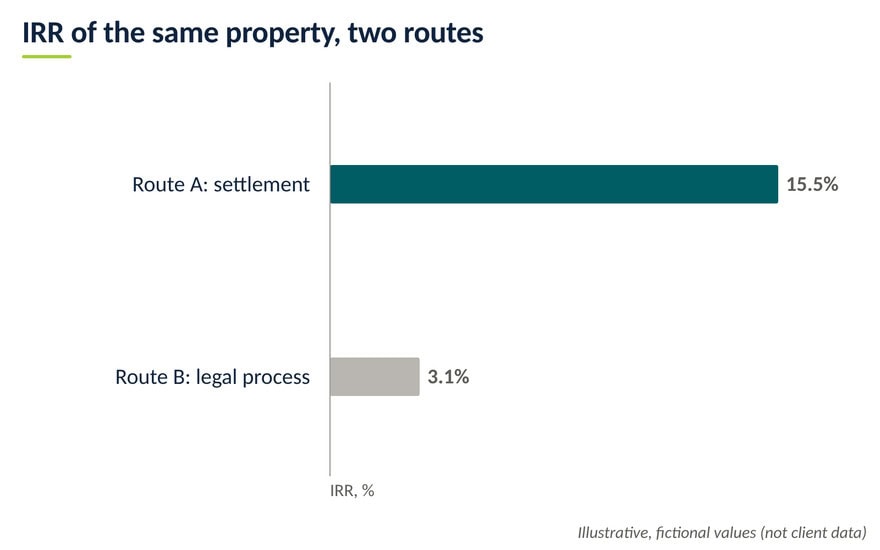
Weaker, planned and stronger paths: the range investors see. Investors judge the range, not one number, so scenarios run through property, fund and investor levels:
- A weaker path, for example: settlement fails, the legal route and a longer hold add time and cost, and the property is re-let once resolved and sold at a fair price, not in a fire sale.
- A planned path: the expected route and timing hold.
- A stronger path: settlement and sale come sooner, leaving more of the discount as profit.
How We Worked Together and the Result
How the model was built. The work started with a discussion. We analysed the fund’s strategy, the route from purchase to sale and the investor structure, then discussed the questions investors will ask. We planned the structure, a schedule per property with fund and investor layers rolled up from it, and built it. The result: the model lets the investors and the manager:
- Judge each deal on its own profit and return, adding only deals likely to pay.
- See the time and cost of each route to resolve a property.
- Read cash flows and returns for each investor, in all or selected deals, and the manager’s multi-tier performance share.
- Track actual costs against budget per property, and compare prices per unit of area with market rates.
Lessons and Questions for Anyone Modeling a Fund That Buys Distressed Real Estate
Three lessons.
- Start from the smallest unit a decision is made on. A fund return averages deals; a property schedule shows each one.
- Show the range, not one number. Scenarios tell investors what can go wrong before they commit.
- Choose depth or reading speed. Full statements give more ratios; a direct cash-flow view reads faster. This client preferred the direct view.
Questions to ask before you model a fund that buys distressed assets.
- What return can investors expect, and how wide is the range?
- What can go wrong, and what is the fallback if a settlement fails?
- Which deals are profitable on their own, and which should not be added?
- What does each investor earn, LP or GP, and when does the manager’s share start?
Planning a similar project? See our Real Estate financial models. If you need a model built for your fund, we build custom financial models. Write to us at [email protected].
FAQ
Short answers to the questions readers ask most often when they plan this type of model.
What does a fund that buys distressed real estate do?
It buys distressed assets: properties that are vacant, in default, in foreclosure or in need of repair, at a price below their potential value. It resolves or repairs them, then resells or rents them. Its return is the gap between purchase price and exit value after time, legal cost, works and tax. The fund is not in distress; the assets are.
What is the difference between a deal-by-deal and a whole-fund waterfall?
A waterfall sets the order of payouts. A deal-by-deal waterfall works out the manager’s performance share on each investment as it is sold; a whole-fund waterfall does so across all investments together. The choice changes when the manager is paid and who carries the risk of weak deals.
What scenarios should a fund buying distressed property show investors?
A weaker, a planned and a stronger path. The weaker path is the realistic fallback, such as a failed settlement followed by the legal route and a longer hold. Together the three show investors the range of returns they should expect before committing capital.
Why does IRR per deal matter?
IRR is the annual rate that sets the present value of all cash flows to zero; a fund IRR averages all deals, so strong deals can mask weak ones. IRR, multiple and profit per deal show which deals add to the return; IRR reflects timing, a multiple ignores it, so review all three.
Client details are anonymised to protect confidentiality. Charts, schematics and worked examples are illustrative and contain no client data.


