
0 ITEMS

Airbnb Building Acquisition Financial Model Case Study

Key Takeaways
- The decision: does the full cost of the building, not only its price, earn enough, and when does the cash come back?
- The outcome: long-term letting sets the floor if Airbnb underdelivers; base and upside cases follow on Airbnb.
- Why one model: seasons, funding, financing and the downside affect each other, so they are read on one monthly logic before money is committed.
- The turning point: gross yield is a useful first screen; the decision rests on the return on all-in cost and on when the cash arrives.
PDF2.5 MB
Free download · No email required
Download the Airbnb Building Acquisition Financial Model Case Study
✓ Model structure✓ Key assumptions✓ Results and takeaways
Before the first guest arrives, a short-term rental building has cost more than its purchase price. Purchase costs, renovation, furnishing and a calendar that takes time to fill all come first. A developer weighing such an acquisition for Airbnb rentals needs to know what that full cost earns, how deep the cash falls before income starts and what is left if Airbnb underdelivers.
The Client and the Decision
A developer was weighing the acquisition of one building with several apartments, to be renovated, furnished and rented out on Airbnb. The developer wanted a financial model to substantiate the investment analysis, with projected returns, risk and upside. The model also covers how cash would be shared if investors join, and what each of them would receive. The developer’s questions were practical:
- Return: what does the full cost of the building earn, and how wide is the range between downside, base and upside?
- Downside: if Airbnb falls short, what does long-term letting still earn?
- Seasons: do the low months still cover fixed costs and loan payments, and how thin is the margin?
- Funding: how much equity is needed, and how deep is the cash low point before income starts?
- Risk and upside: which assumption hurts most, and where is the upside?
- Investors: if they join, what does each receive under the agreed terms?
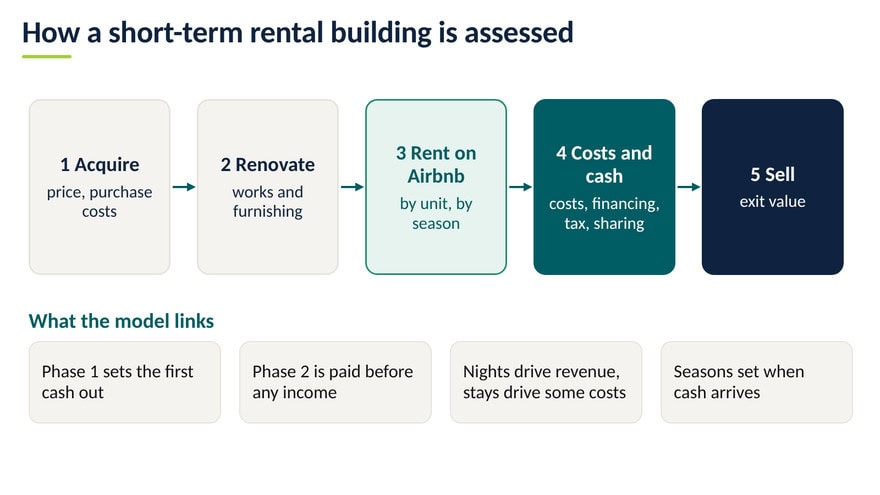
How a short-term rental building is assessed. The model follows the building through two phases before the first guest, then through renting and the sale.
- Phase 1: the acquisition. The developer pays the price and the purchase costs, such as fees and taxes, and chooses the financing, equity only or with a loan. This sets the first cash out.
- Phase 2: the renovation. Renovation and furnishing follow, item by item and unit by unit. They are paid before the first guest, and bookings need time to build after opening, so the ramp-up belongs to the cost as well.
- Renting and the sale. Then the apartments are rented on Airbnb: each unit rents nights at a rate that follows the calendar, and cash after costs, financing and tax goes to the developer and, if investors join, is shared under agreed terms. Finally the building is sold, and selling costs and tax reduce the proceeds.
Seasonality: What Low and High Seasons Mean
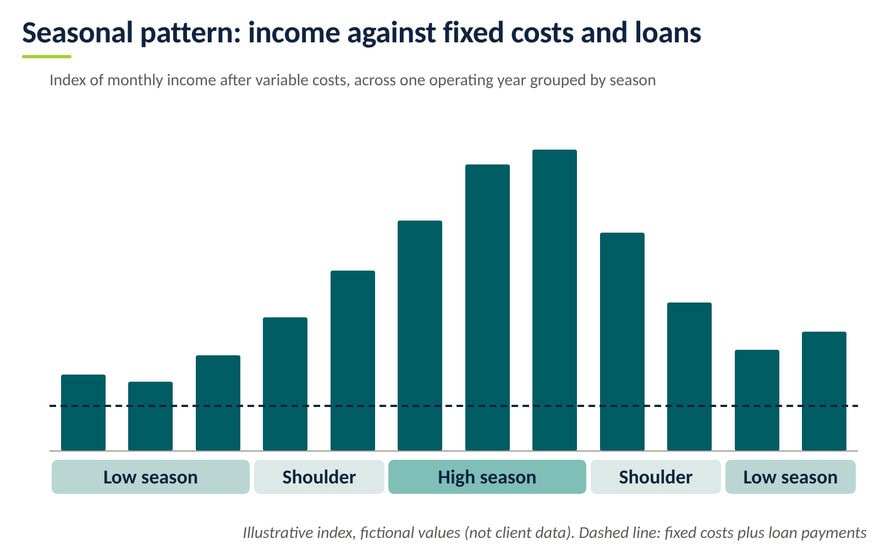
Demand for short-term rentals is rarely even through the year: occupancy and nightly rates rise together in high season and fall together in low season. The pattern runs through the model:
- Income concentrates in the high months.
- Costs split: per-stay and revenue-based costs follow bookings, while fixed costs and loan payments continue every month.
- Profit is strong in high season and thin in low season.
- Cash built in high season carries the low months.
- Loan payments fall due whatever the occupancy, so loan cover is tested month by month, not on the annual total.
- Every month covers fixed costs and loan payments; the thin low months set the size of the cash reserve.
The downside case: long-term letting. Airbnb income rests on nightly pricing and occupancy. When we study such a plan, we always include long-term letting as the downside case and run it first. Base and upside follow on one cost and financing logic. Side by side, the cases show how much of the return depends on short-term pricing. They show how the case could work out; they do not prove the assumptions.
- Downside: long-term letting, the fallback if the Airbnb plan falls short.
- Base: the Airbnb plan, with occupancy and rates following the season.
- Upside: stronger rate, occupancy or length of stay.
Why This Was Hard to Model
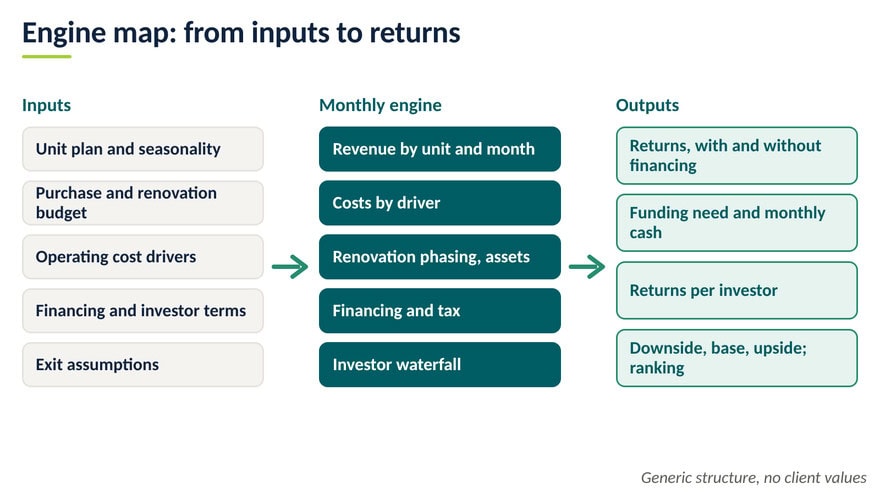
- Seasons: income, costs, cash, loan. “How thin do the low months get?” Income follows the season, while fixed costs and loan payments run all year. An annual average hides how little the weakest months leave. How we solved it: We indexed occupancy and rate by month and unit, tied each cost to its driver and followed cash after loan payments month by month, so the margin of every month is visible.
- Cash before any income. “How much cash is needed, and when is the low point?” Price, purchase costs, renovation and furnishing are paid before the first guest, and bookings need time to build. A later opening or an overrun deepens the low point. How we solved it: We phased each renovation item across the works, itemised furnishing per unit type and added an operation-start switch, so sources and uses and the peak funding need follow.
- Operating margin after per-stay costs. “Is this an operating margin or a gross yield?” Cleaning and other turnover costs are paid per stay, while revenue follows nights, so nights alone overstate the margin. How we solved it: We derived stays from nights and average length of stay, then linked per-stay costs to stays, revenue-based costs to revenue and fixed costs to annual cost increases.
- The building versus the financing. “How much of the equity return comes from the building, and how much from debt?” Answering needs two comparable cases, with tax recomputed without interest. How we solved it: We built unlevered and levered cash-flow blocks side by side, with a separate unlevered tax calculation, so both stay comparable year by year.
- What each investor would receive. “If investors join, what does each get?” Profit goes to the developer and, if investors join, is shared under agreed terms, and every payout must reconcile. How we solved it: We built the profit-sharing waterfall with a return per investor, and check rows rolled into a master check, so everyone reads the same numbers.
The Turning Point: Gross Yield Is the First Screen
Gross yield, annual revenue divided by the purchase price, tells a lot at the start. It ranks buildings quickly. The investment, however, costs more than the price: purchase costs, renovation, furnishing and the ramp-up all add to it. The decision therefore rests on the expected return on that all-in cost and on when the cash arrives.
Worked example with fictional numbers: one building, index units (price = 100)
| Item | Index |
| Purchase price | 100 |
| Purchase costs | 3 |
| Renovation | 11 |
| Furnishing | 5 |
| Ramp-up shortfall before bookings fill the calendar | 5 |
| All-in cost | price plus 24 |
| Revenue in a stable year | 16.6 |
| Operating costs in a stable year | 7.2 |
| Income after operating costs | 9.4 |
| Gross yield on price (index) | 100 |
| Same revenue as a yield on all-in cost (index) | 81 |
| Income yield on all-in cost (index) | 46 |
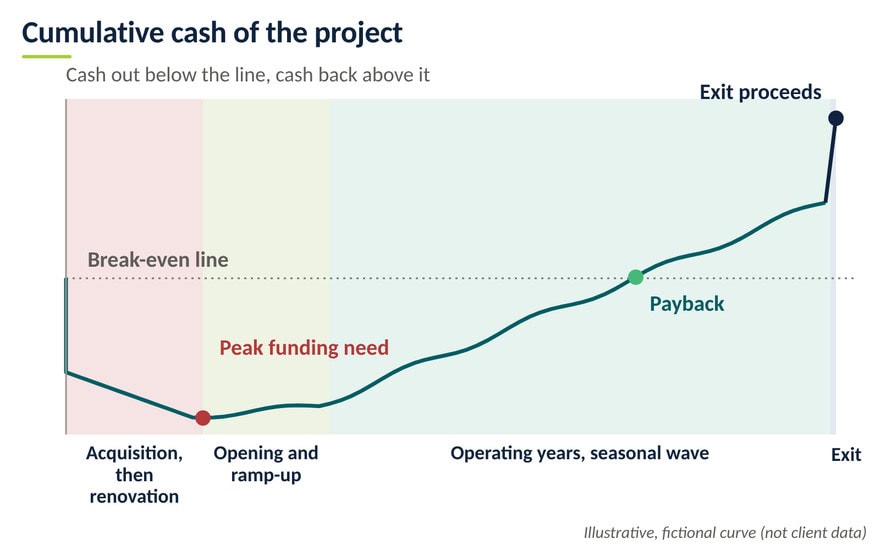
On the yield index, the same revenue is 100 as a gross yield on the price but only 81 as a yield on the all-in cost, and the income after operating costs is 46. The last figure links to the return on capital. Timing matters as well: the all-in cost goes out before and during opening, while income arrives later and in a seasonal wave. The cash curve shows how deep and how long cash stays negative.
How We Worked Together and the Result
How we worked together. The work began with a discussion that we prepared by analysing the investment case and led with the developer: returns, risk, upside, funding and distributions. We then planned, built and reviewed the model with the developer, and handed it over. The result:
- Downside, base and upside returns side by side, with and without financing.
- Monthly cash after loan payments, so the thin low months and the low point before income starts are visible.
- A return on all-in cost and a ranking of drivers.
Three Lessons for Anyone Modeling a Short-Term Rental Investment
- Run long-term letting first; it gives the range of returns a floor.
- Judge the building on its all-in cost and on when the cash arrives. Gross yield is the first screen, not the decision.
- Follow cash month by month, and count stays as well as nights.
Planning a similar project? See our real estate financial models. If your building needs something specific, we build custom financial models. Write to us at [email protected].
FAQ
Short answers to the questions readers ask most often when they plan this type of model.
Do you always include long-term letting as the downside case?
Yes. The long-term letting case runs first as the downside, then the base and upside cases follow. Side by side they show where the return lies and how much of it depends on short-term pricing, so the reader sees what the building still earns if the Airbnb plan falls short.
How does seasonality affect a short-term rental investment?
Income concentrates in high season, while fixed costs and loan payments run all year. Every month covers fixed costs and loan payments, and the thin low months set the size of the cash reserve. Loan cover is decided month by month, and a monthly model shows how thin the low months are.
Is gross yield useful for a short-term rental building?
Yes, as a first screen: annual revenue divided by the purchase price ranks buildings quickly. It ignores purchase costs, renovation, furnishing, ramp-up, operating costs and the timing of cash, so the decision should rest on the expected return on all-in cost, not on the gross yield alone.
What does an Airbnb financial model for a building acquisition show?
It follows the building from purchase and renovation through renting on Airbnb to the sale. It shows the return on all-in cost, the cash low point before income starts, the thin low-season months and what long-term letting still earns if the Airbnb plan falls short, with worst, base and best cases side by side.
Client details are anonymised to protect confidentiality. Charts, schematics and worked examples are illustrative and contain no client data.


