0 ITEMS

Franchise Payback Period: 3-Scenario Calculator Guide

A franchise’s numbers are realistic when even the pessimistic case recovers the initial investment inside the agreement term and the realistic case does so with room to spare. This guide builds pessimistic, realistic and optimistic cash flows from the Franchise Disclosure Document (FDD) and tests them against Item 19, Item 20 and the SBA franchise directory.
Key Takeaways
- Item 19 reports what some outlets earned, so treat it as a benchmark to test, never as a forecast of a new buyer’s results.
- Build three cases from the Item 7 investment range, because a single payback estimate hides how wide the real outcome can be.
- In the illustrative example, payback on cash before debt, tax and owner pay runs 5.86, 3.11 and 1.93 years across the three cases.
- A realistic payback far beyond the franchisor’s quoted figure, or high Item 20 turnover, are the fastest red flags to chase with current franchisees.
- Payback ignores cash after recovery and the time value of money, so read it beside the agreement term and the loan schedule.
A Franchise Passes the Realism Test When All Three Cases Pay Back Inside the Term
The payback period is the time a business needs to recover its initial investment from the cash it generates. A franchisor’s sales material usually quotes one case, and it is the favourable one. The Franchise Disclosure Document (FDD) is the legal disclosure that a franchisor must hand to a buyer, and the U.S. Federal Trade Commission (FTC) says the buyer must receive it at least 14 days before being asked to sign any contract or pay money to the franchisor. The same alert refers to 23 required items, and Item 7, Item 19 and Item 20 carry the numbers that matter here.
The pessimistic case deserves real weight. The U.S. Bureau of Labor Statistics (BLS) reported in 2024 that 34.7 percent of private-sector establishments born in March 2013 were still operating in March 2023, and that the rate fell by 20.4 percentage points in the first year alone. Those figures cover all U.S. private-sector establishments, not franchises, so they show early-year risk in general, not the risk of any single brand.
Item 19 Is a Benchmark to Test, Not a Forecast to Accept
Item 19 holds a franchisor’s financial performance representation, such as average unit revenue. The FTC alert explains that the Franchise Rule does not require a franchisor to provide that information, though most do, and that outside Item 19 a seller cannot make spoken or written earnings claims, apart from two narrow exceptions. A verbal figure that never appears in Item 19 is therefore a warning sign.
Three questions turn the Item 19 table into a usable benchmark. How many outlets are in the sample? A table built from the best locations lifts the average. Does the figure show revenue or profit? Revenue ignores the costs that follow. How old are the units? A mature outlet earns more than a first-year outlet, and a new buyer starts in year one. State regulators write the same caution into their commentary, where the standard admonition reads Your individual results may differ. There is no assurance that you’ll earn as much.
Build the Three Cases from the Item 7 Investment Range
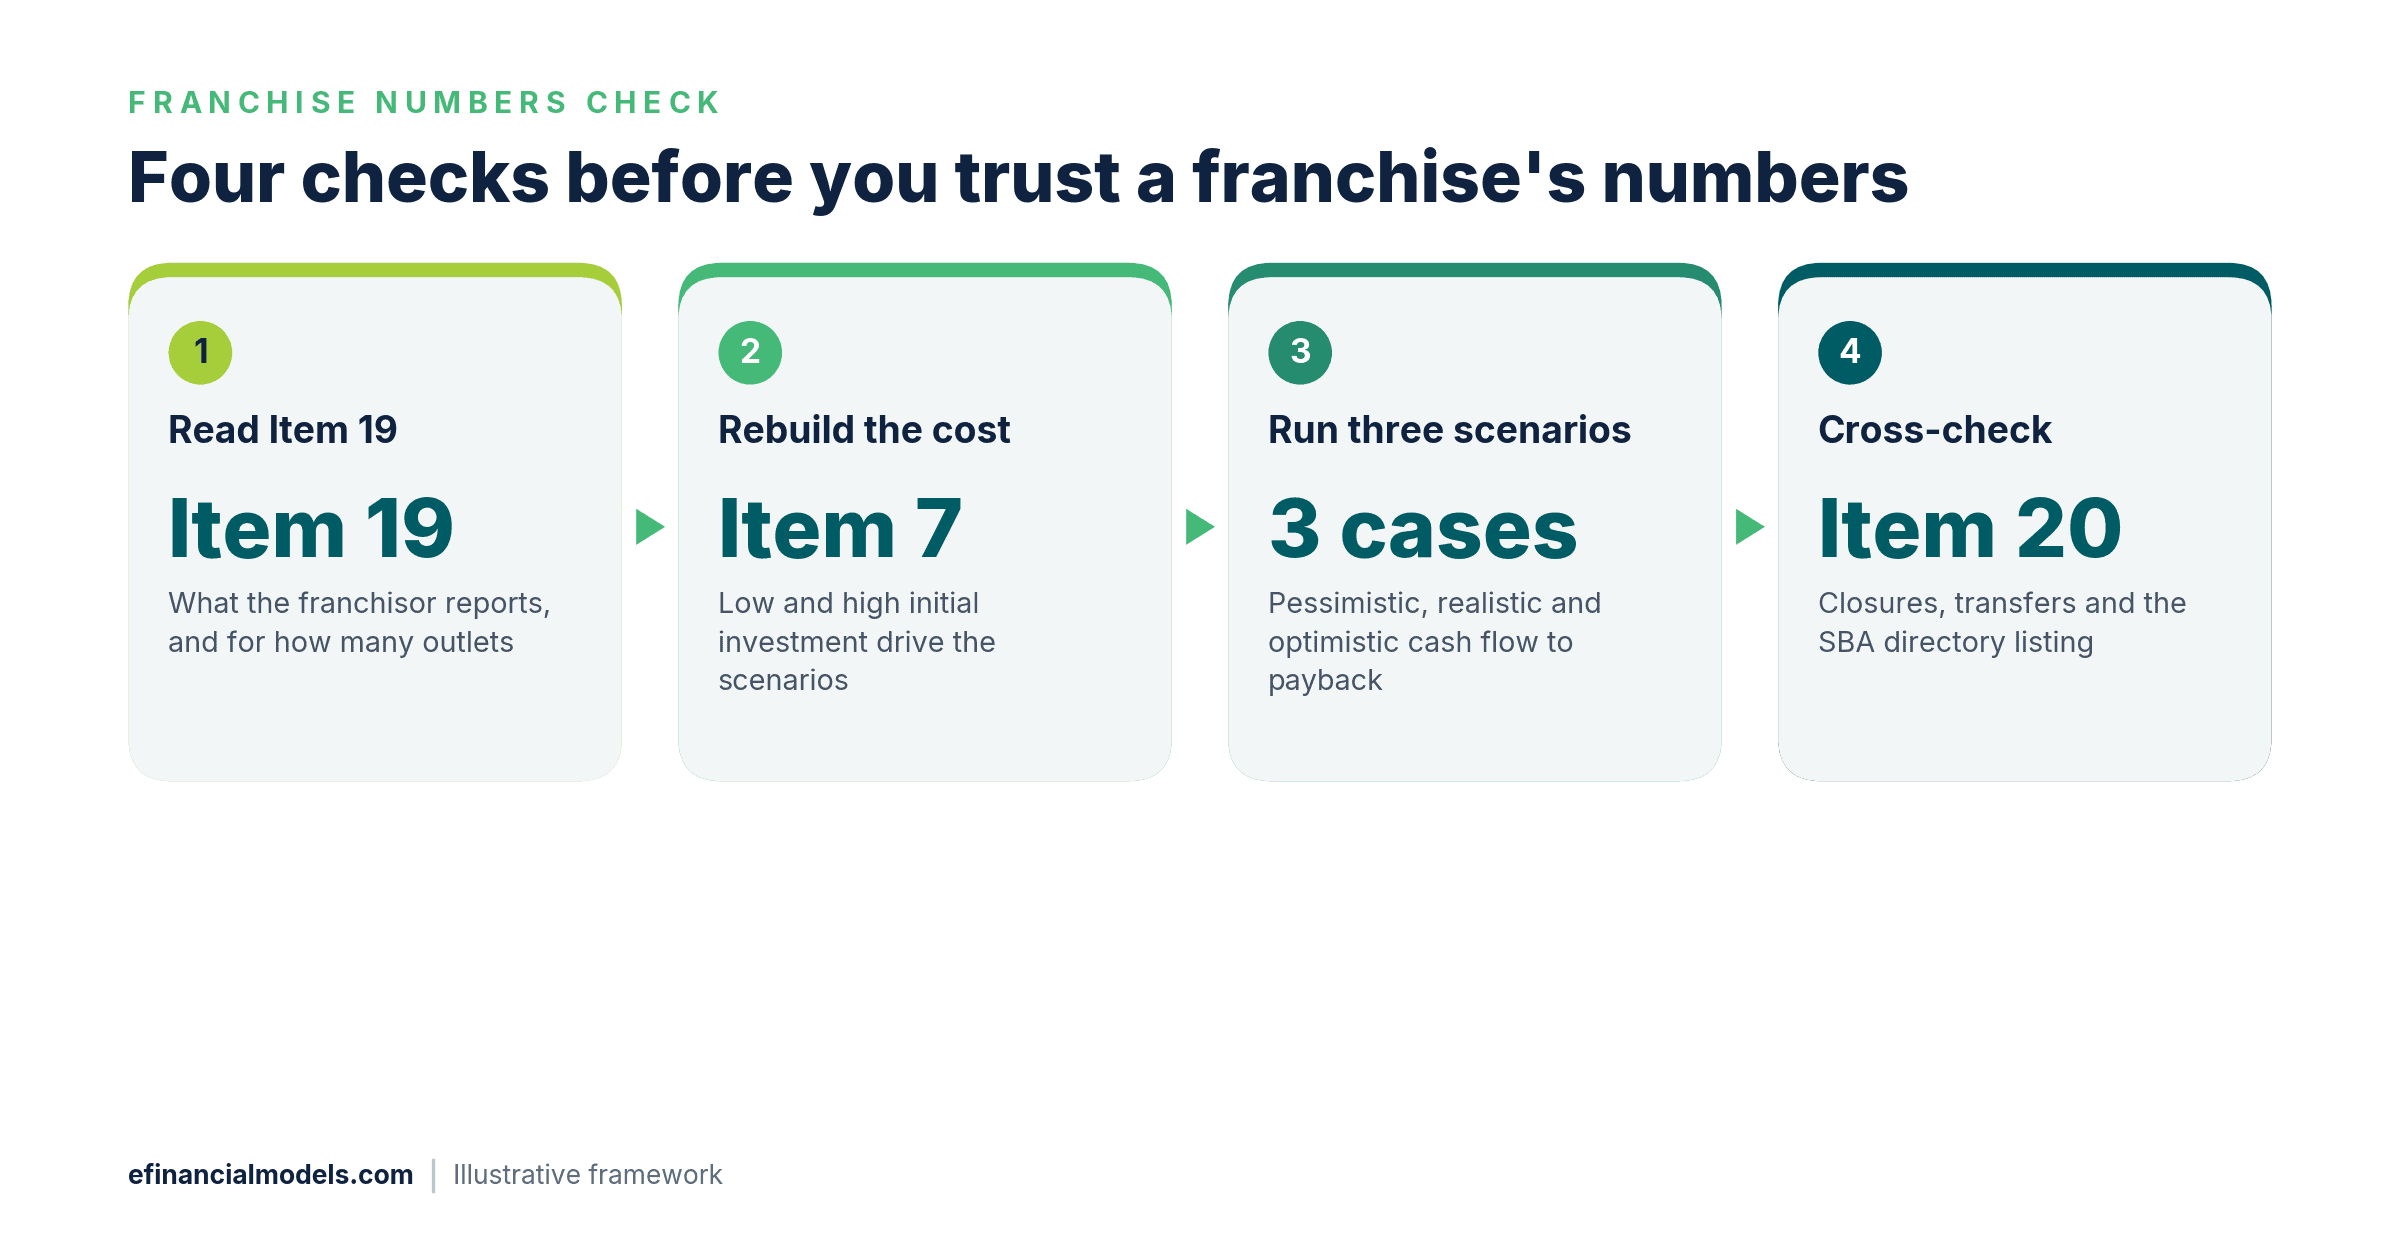
Items 5 to 7 go over some of the costs involved in starting and operating a franchise, according to the FTC, and Item 7 gives the franchisor’s estimate of the initial investment, usually as a low and a high figure. Four steps follow, and the logic is that of scenario analysis models.
- Set the investment per case. Use a figure toward the high end of the Item 7 range for the pessimistic case, one near the middle for the realistic case and one toward the low end for the optimistic case.
- Set year-one revenue. Anchor the realistic case slightly below the Item 19 average, because a new unit rarely opens at the mature average, and place the other cases on either side.
- Set the cost rates. Take them from the fee items, any Item 19 cost data and the books of current franchisees. Net cash flow is revenue minus operating costs (labour, cost of goods, rent and other running costs), the royalty and the brand fund, which is cash before debt service, income tax and the owner’s pay. Capital spending and cash tied up in stock and unpaid invoices are excluded.
- Accumulate cash until it passes the investment. The year in which the running total reaches the outlay is the payback year, and interpolation gives the fraction.
Worked Example: Three Scenarios for a Hypothetical Franchise
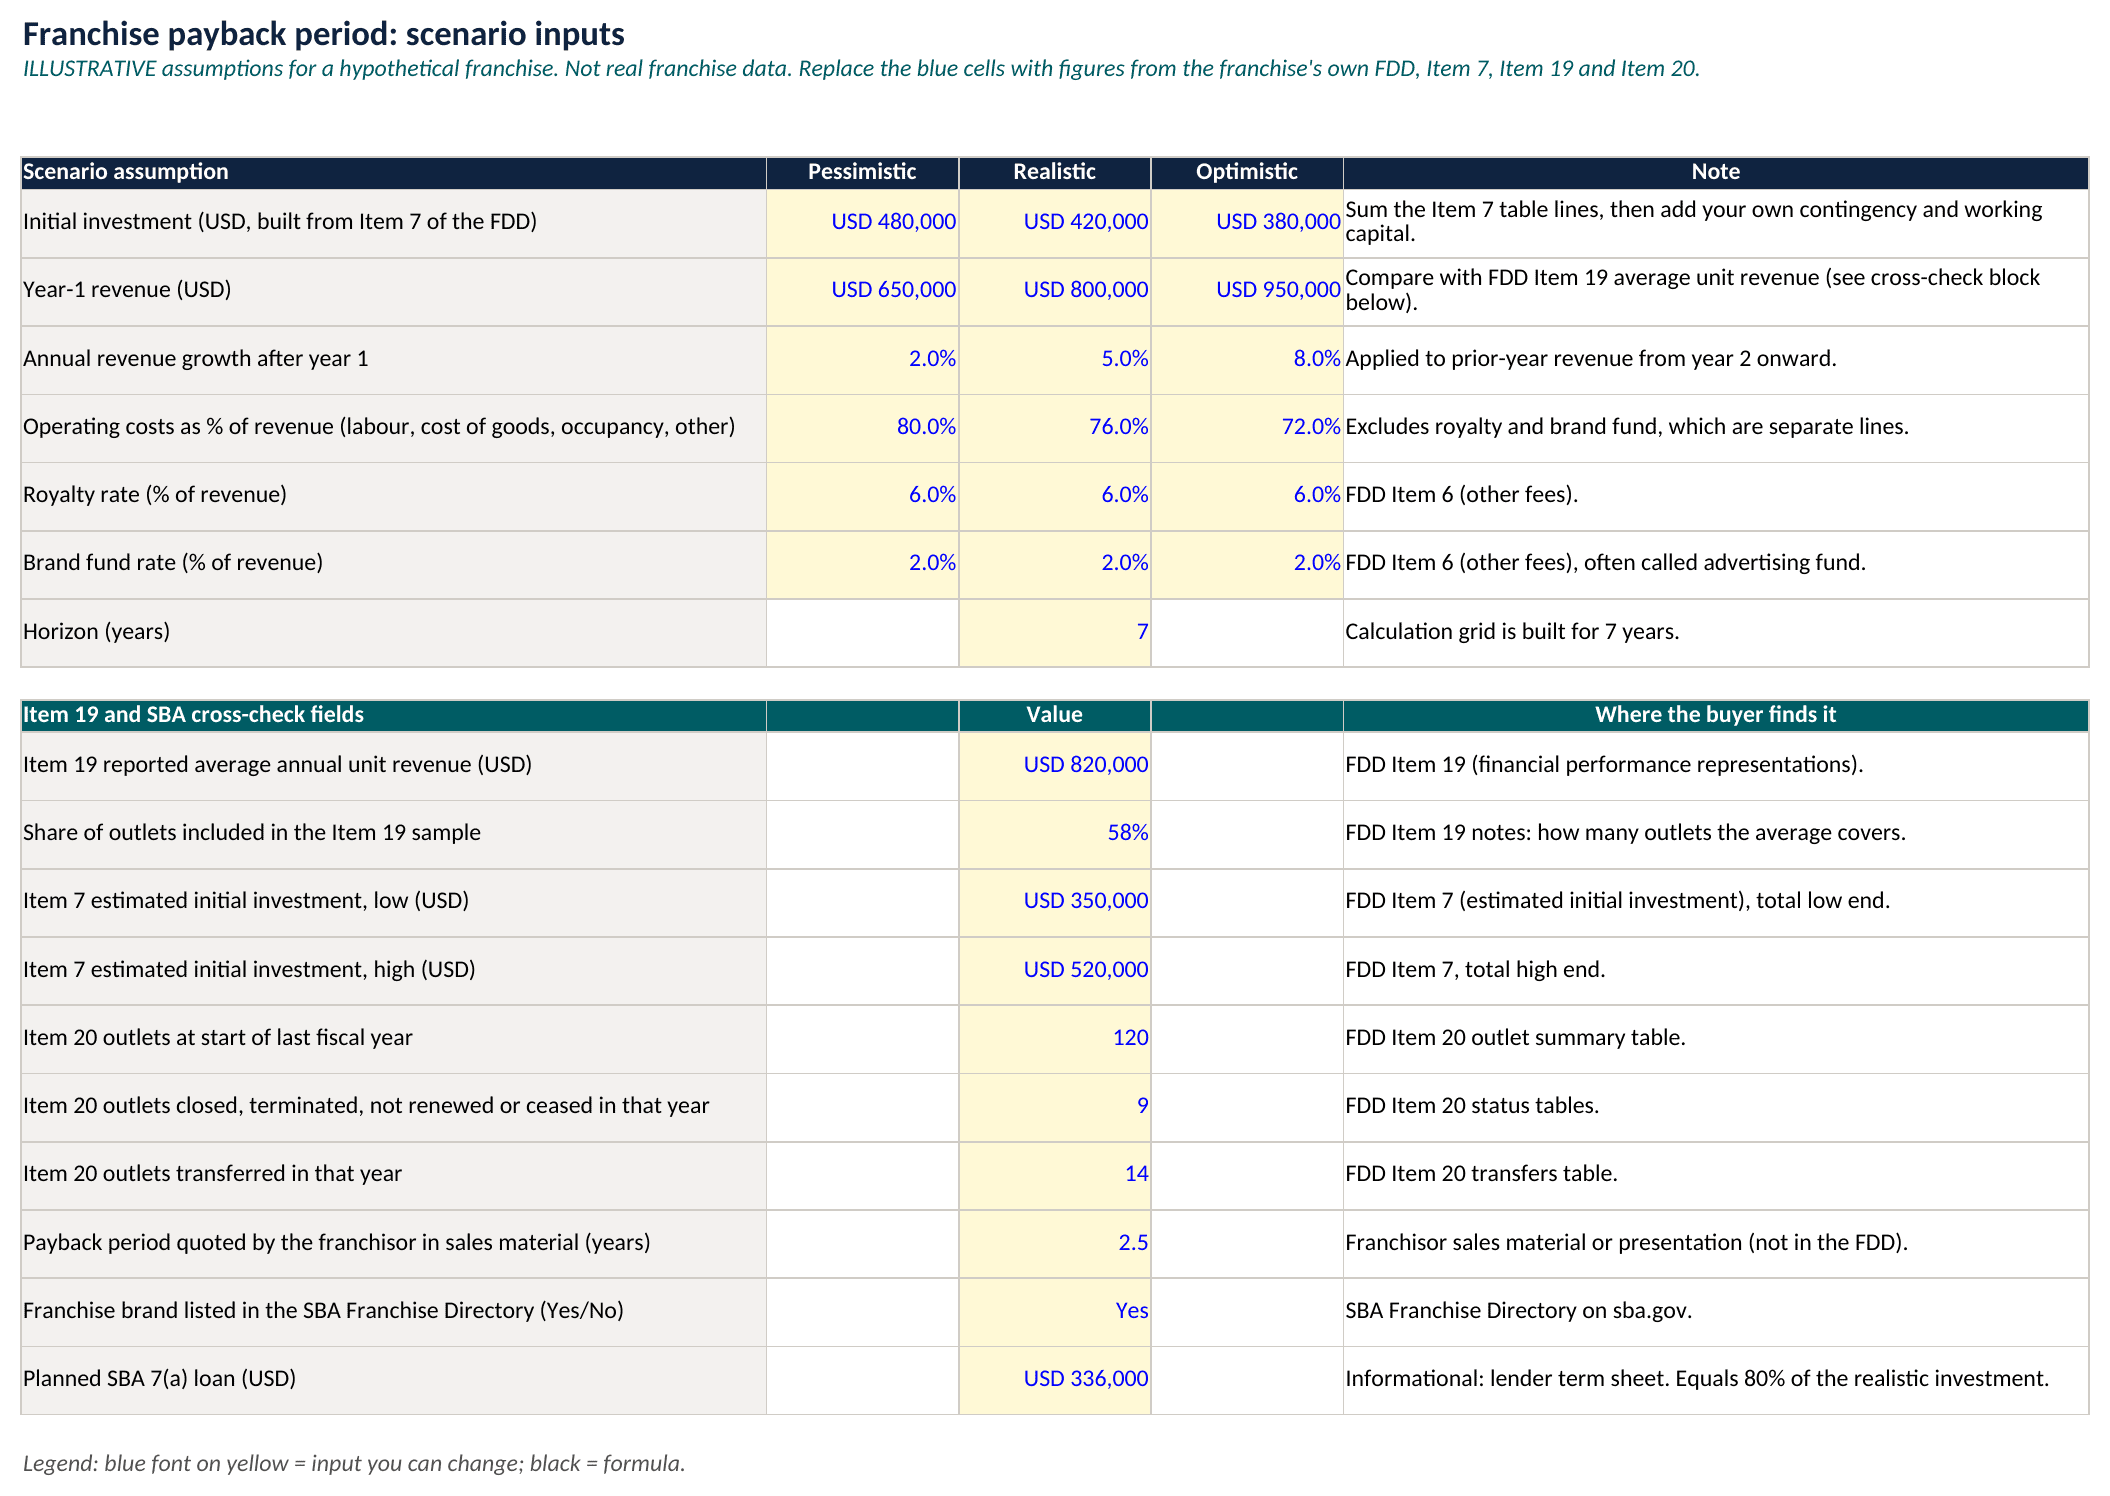
All amounts below are U.S. dollars, and every input is an illustrative assumption for a hypothetical franchise, structured like the franchise models at eFinancialModels. Assume a 10-year agreement term and initial investments of 480,000, 420,000 and 380,000 for the pessimistic, realistic and optimistic cases, which sit toward the high end, the middle and the low end of an assumed Item 7 range of 350,000 to 520,000. Assume year-one revenue of 650,000, 800,000 and 950,000, revenue growth of 2, 5 and 8 percent a year after the first year, and operating costs of 80, 76 and 72 percent of revenue. The royalty is 6 percent and the brand fund is 2 percent of revenue in every case.
Net cash flow, as defined above, is revenue times the net cash margin, which is 100 percent minus operating costs, royalty and brand fund, which gives 100 – 80 – 6 – 2 = 12 percent in the pessimistic case, 100 – 76 – 6 – 2 = 16 percent in the realistic case and 100 – 72 – 6 – 2 = 20 percent in the optimistic case. Year-one net cash flow is therefore 78,000, 128,000 and 190,000. In the realistic case, net cash flow is 128,000 in year one, 134,400 in year two and 141,120 in year three, so cumulative cash is 128,000, then 262,400 and then 403,520. The outlay of 420,000 leaves 16,480 to recover in year four, when net cash flow is 148,176, so payback is 3 plus 16,480 divided by 148,176, which is 3 plus 0.1112, or 3.1112 years, shown as 3.11 years and equal to 37.3 months.
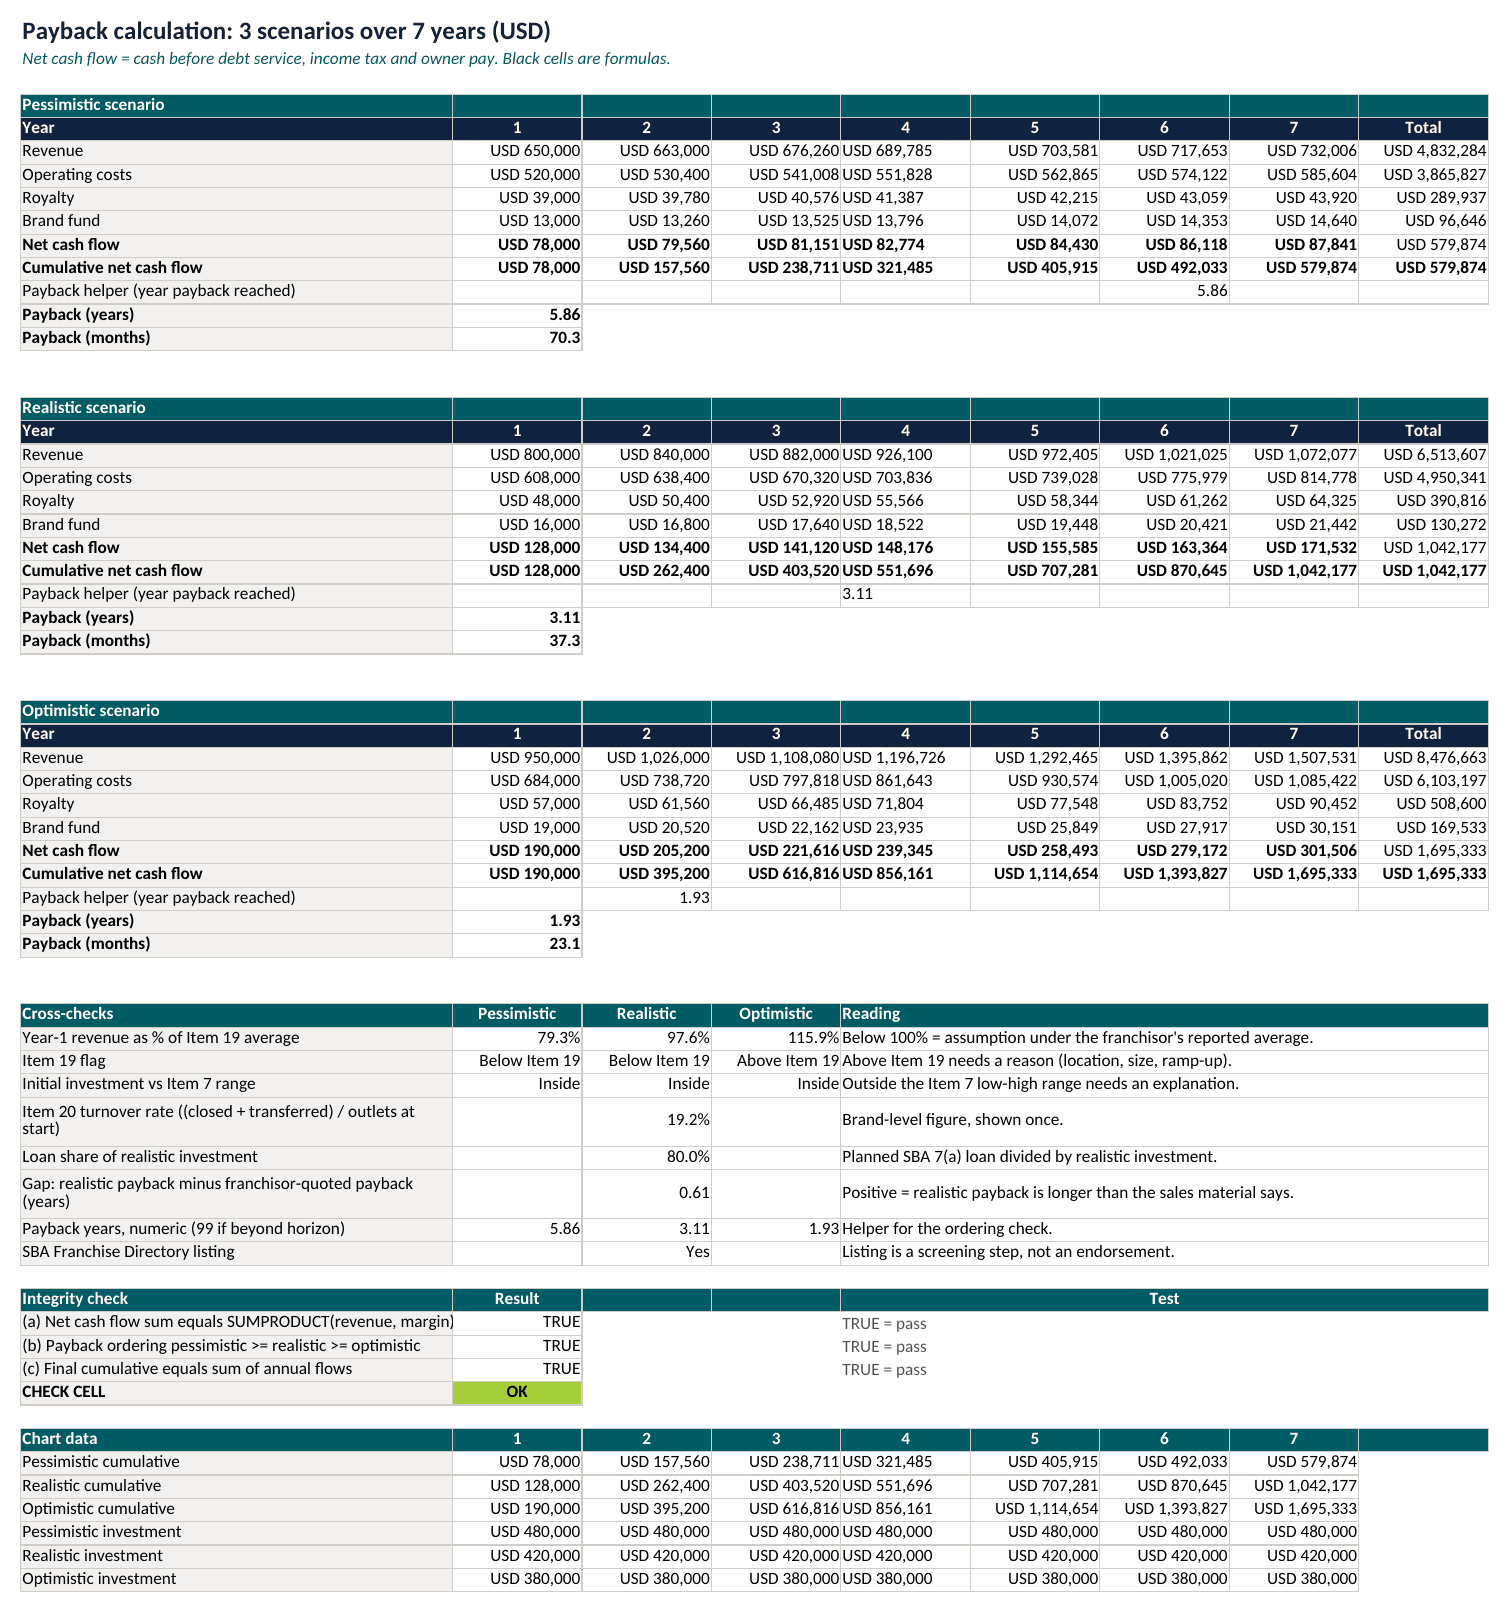
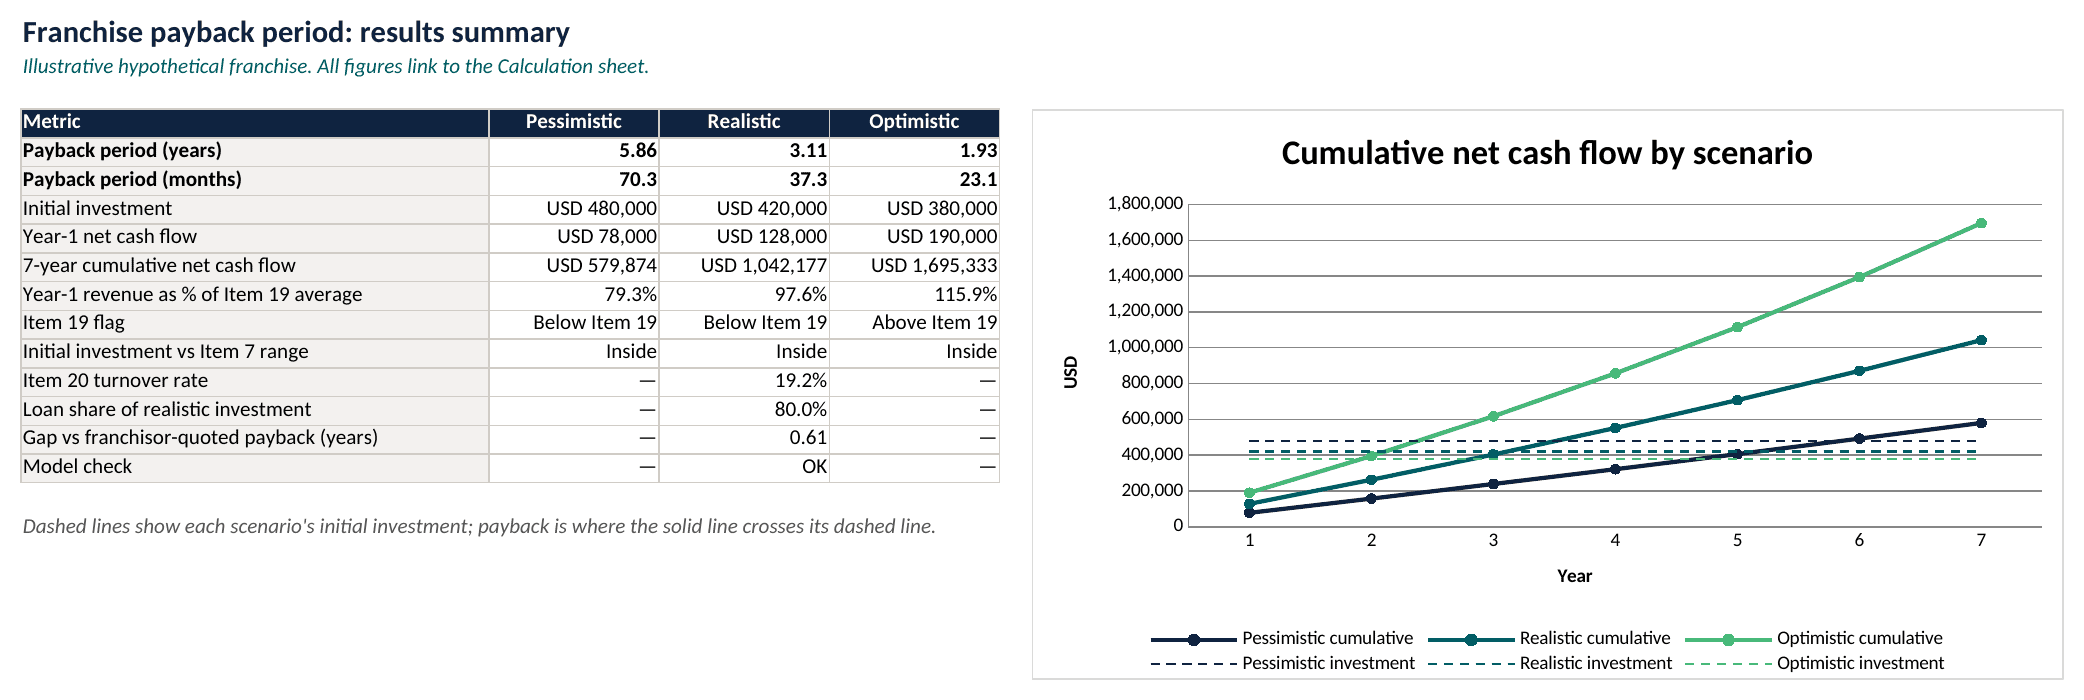
The same method gives 5.86 years in the pessimistic case, or 70.3 months, and 1.93 years in the optimistic case, or 23.1 months. Over seven years the cumulative net cash flow reaches 579,874, 1,042,177 and 1,695,333 before the investment, or 99,874, 622,177 and 1,315,333 after subtracting it. A buyer who sees only the optimistic line plans for recovery in under two years, while the pessimistic line asks for almost six. Against the assumed 10-year term, the realistic case recovers its outlay in about a third of the term and the pessimistic case in a little over half, so the hypothetical franchise passes the test. A pessimistic payback beyond the term would fail it. The screenshots show every input and formula group, so a reader can rebuild the sheet in Excel.
Worked Example Cross-Check Against Item 19, Item 20 and the SBA Fields
Assume the Item 19 table reports an average annual unit revenue of 820,000 for 58 percent of outlets. The realistic year-one revenue of 800,000 equals 97.6 percent of that average, which suits a new unit if the 58 percent sample holds units open for at least two years, an assumption made here. The pessimistic case is 79.3 percent of the average and the optimistic case is 115.9 percent, so the model flags the optimistic case as above Item 19.
Item 20 provides charts showing growth and owner turnover in the system, according to the FTC alert, and it also unlocks contact details for current and former franchisees. Assume 120 outlets at the start of the last fiscal year, 9 closed or ceased operations and 14 changed hands. The owner turnover that Item 20 shows, measured here as closures plus transfers divided by outlets at the start, is 23 divided by 120, or 19.2 percent. That is above an assumed alert level of 15 percent and justifies calls to former franchisees, whose contact details the FTC says Item 20 provides.
Assume the franchisor’s sales material quotes a payback of 2.5 years, a claim a buyer should ask to see in writing because it sits outside Item 19. The realistic case takes 3.11 years, a gap of 0.61 years. Against an assumed tolerance of one year, that gap passes, and a gap above one year would be a reason to ask what the quote assumes.
The model also holds the lender fields. The U.S. Small Business Administration (SBA) publishes a franchise directory, and its own support page states that placement of a franchise brand in the Directory is not an endorsement or approval of the brand and does not ensure the success of the business. A listing shows eligibility only. Assume a loan under the SBA 7(a) programme, the agency’s main guaranteed loan programme, of 336,000, which equals 80 percent of the realistic investment. A repayment test is outside this model, so the buyer should rerun the cash flows after debt service before borrowing.
What Payback Leaves Out
Payback, the measure behind the payback period models at eFinancialModels, is a simple measure. It stops counting once the investment is recovered, and it treats a dollar in year five like a dollar in year one. The example cash flow is also before debt service, income tax and the owner’s pay, so a buyer who needs a salary from the unit should deduct it, which pushes every payback date later. The FDD, FTC and SBA references are U.S. rules, so buyers elsewhere should check local franchise law, and a franchise attorney and an accountant should review any plan.
Frequently Asked Questions
Does a franchisor have to publish earnings in Item 19?
The Franchise Rule leaves that choice to the franchisor, so some disclosure documents carry no earnings table at all. Silence is not proof of weak results, but it removes the benchmark. The buyer then has to build year-one revenue from outside evidence, such as written figures from several current franchisees and local competitor data, and should widen the gap between the three cases.
Which payback period counts as acceptable?
No single number applies to every brand. Compare the realistic payback with the years left on the franchise agreement, the lease and the loan, because the time after recovery is where the owner earns a return. A realistic payback that consumes most of the agreement leaves no margin for a bad year, and the pessimistic payback shows how long living costs and debt must be funded.
How should debt payments and taxes enter the model?
Keep them out of the operating cash flow and add them as separate lines beneath it. Run the model twice, once before financing and once after it, then compare the two payback dates. Loan interest and principal delay recovery of the buyer’s own cash, and the after-financing run shows whether the monthly obligation can still be met during a weak first year, which the before-financing view cannot reveal.
How many years should the scenarios cover?
Cover at least one year beyond the pessimistic payback, so the table shows the crossing and some cash after it. The example uses seven years because its slowest case recovers the outlay in just under six years, which leaves one further year of cash visible on the table. If the pessimistic line never crosses the investment inside the agreement term, the buyer has found a structural problem before signing.
Conclusion
Franchise numbers are realistic when even the pessimistic case recovers the investment inside the agreement term and the realistic case does so with room to spare. Buyers who want to test their own figures can start from the eFinancialModels Payback Period Calculator, an Excel template for working out how long it takes to recover an investment, before committing capital.