0 ITEMS

Aquaponics Startup Financial Model: Costs and ROI by Scale

An aquaponics startup needs about USD 4,400 in funding at backyard scale, USD 78,800 for a small commercial greenhouse and USD 601,900 for a large commercial farm, according to the illustrative model in this article. At the stated assumptions, only the backyard case and a small farm selling everything direct earn an internal rate of return above the 10% discount rate, the backyard only if the owner’s time is free and the direct-sale farm only if buyers take every head at retail prices, while the base small farm and the large farm do not.
Key Takeaways
- Illustrative funding needs are USD 4,363 (12 m2 backyard), USD 78,800 (63 m2 commercial) and USD 601,875 (600 m2 commercial), including working capital.
- The 63 m2 farm at a 70% wholesale mix earns USD 8,601 yearly before tax and depreciation, with a 9.2-year payback and negative NPV.
- Selling direct to consumers instead of 70% wholesale lifts that farm’s annual operating profit from USD 8,601 to USD 16,498, if buyers absorb the full volume.
- For the 63 m2 farm, a 10% change in yield or price (all output) moves annual operating profit by USD 4,380; labor cost, by USD 2,400.
- Published studies put labor as the largest operating cost, so a startup model needs a separate labor line, though yield and price move profit more.
Startup Costs Run from Thousands to Hundreds of Thousands of Dollars
Aquaponics grows fish and plants together in one recirculating water loop and has no single startup price. An Oklahoma State University extension fact sheet reports total investment costs from USD 58,760 to USD 1,020,536 across the studies it reviewed, depending on scale (Oklahoma State University Extension). A 2022 study of a tilapia and lettuce system in Ohio, United States, put the initial investment at USD 69,230 to USD 69,600, with the greenhouse making up 42% of that cost (Ohio State University). A 2020 study in Seville, Spain, reported a headline EUR 1,643 for a small-scale system, including its greenhouse (EUR 1,063 without it), though its own table shows a higher total (Agronomy journal, 2020).
A financial model turns these ranges into a funding requirement: the startup capital (capex, short for capital expenditure) plus working capital, which is the cash needed to cover day-to-day costs before sales arrive. The worked example below assumes three months of operating costs as working capital.
Labor Is the Largest Operating Cost At Commercial Scale
Operating costs (opex) are the recurring costs of running the farm. The Ohio study reported annual operating expense of USD 33,100 to USD 33,300, with labor the major contributor at 52% (Ohio State University). A University of the Virgin Islands case study published by Sustainable Agriculture Research and Education found labor above 69% of total variable cost in year one and 65% in later years (Sustainable Agriculture Research and Education). The bases differ (total operating cost versus variable cost), so these percentages form a range, not one benchmark.
Worked Example: Three Illustrative Scenarios
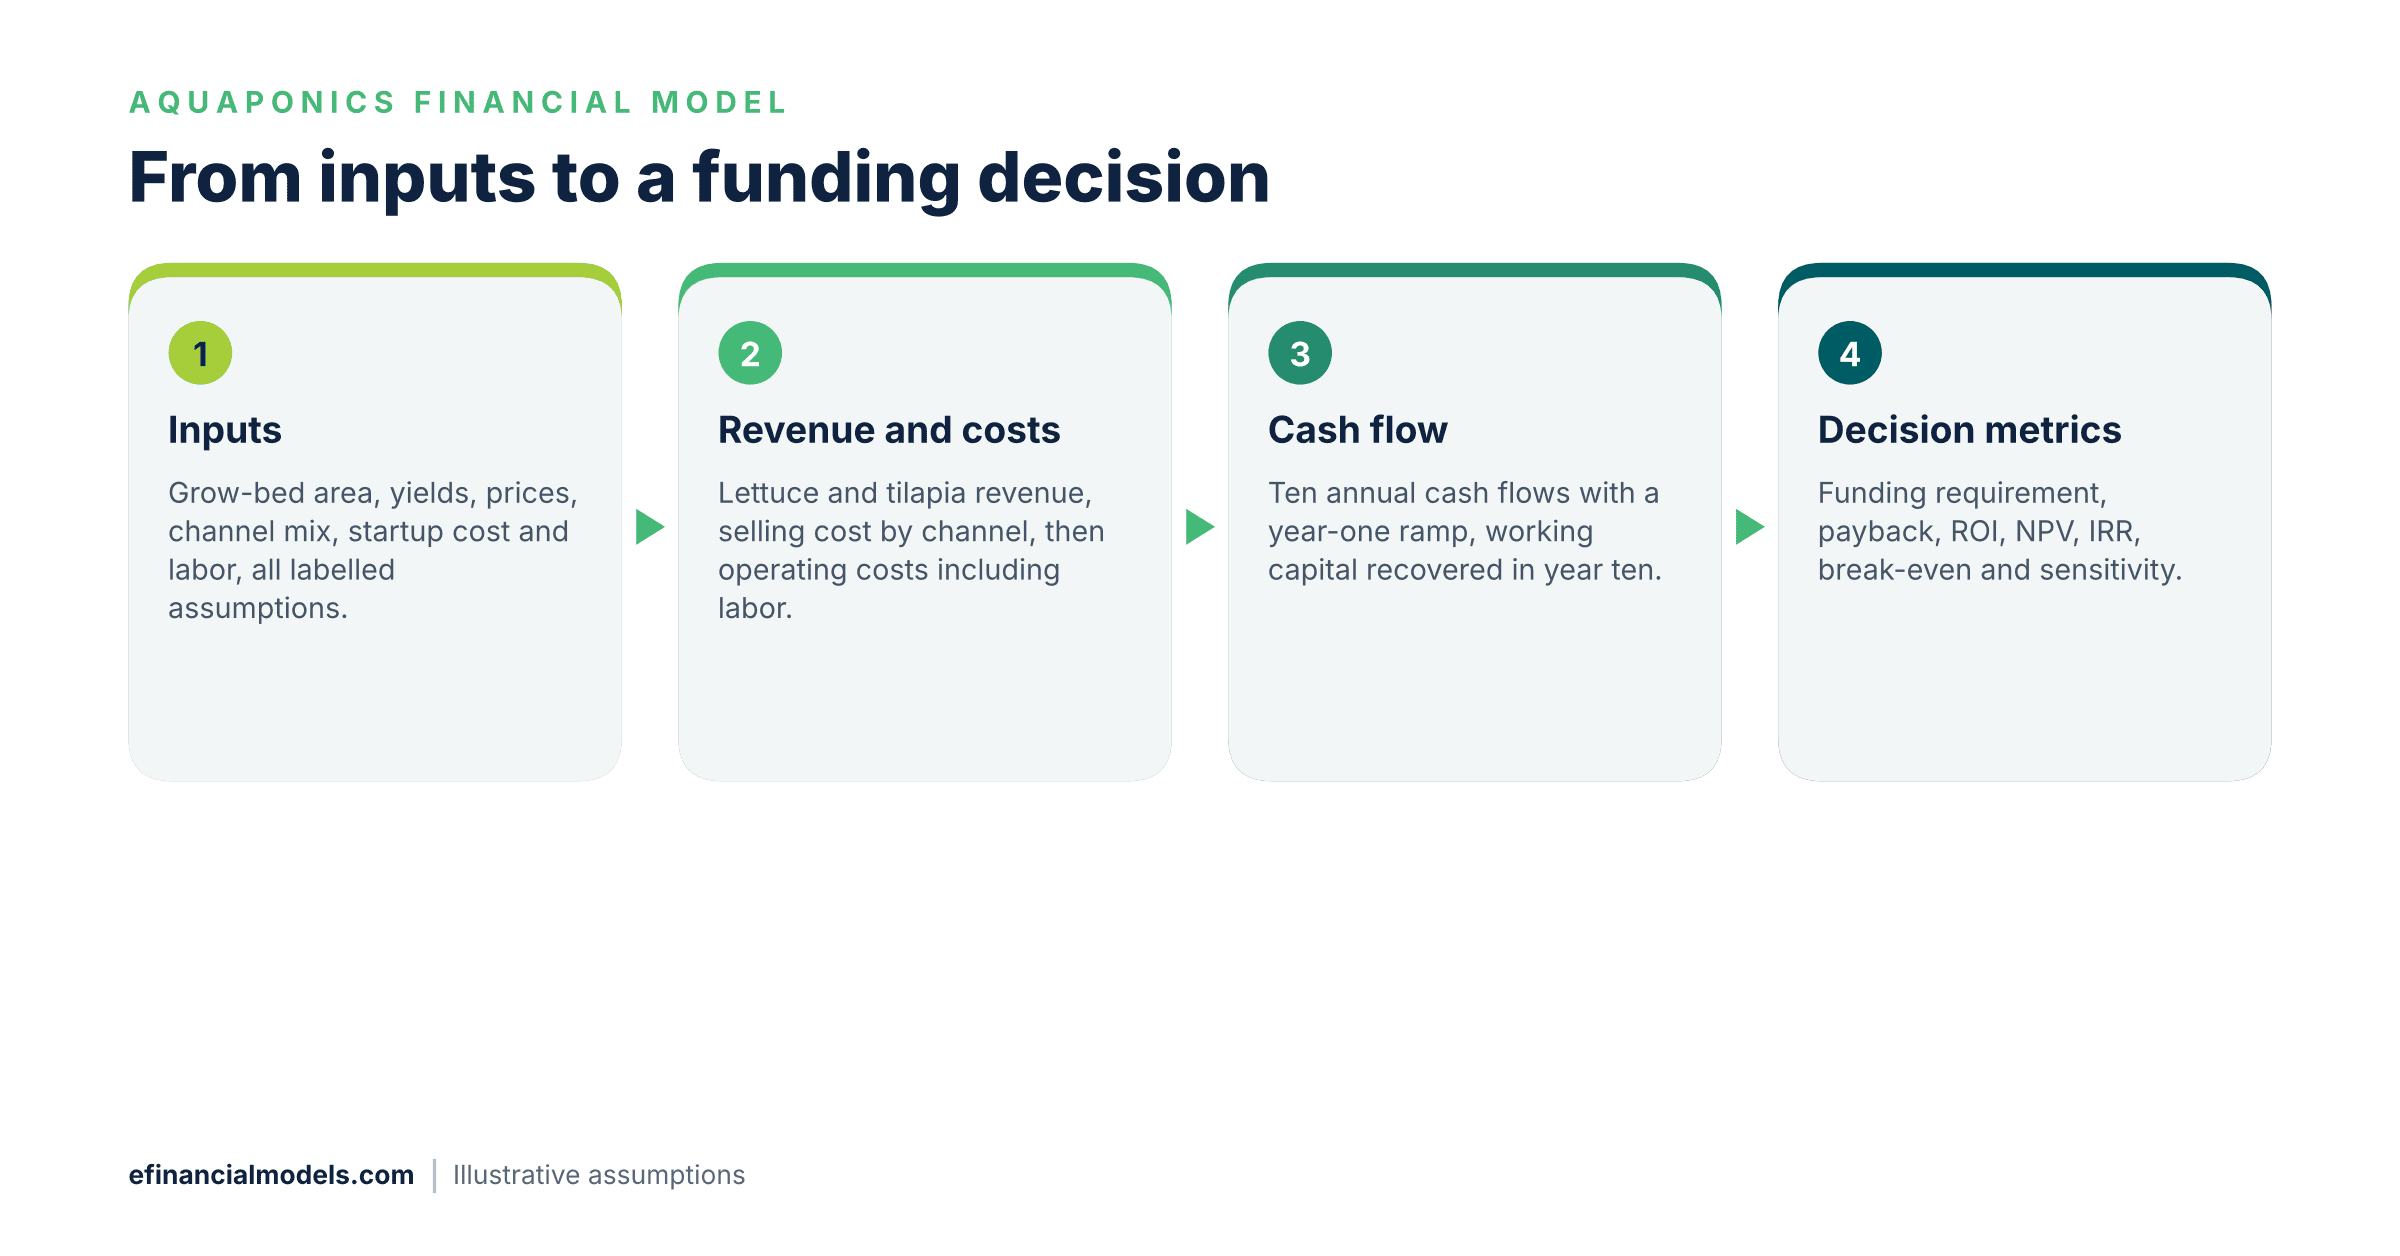
The scenarios are illustrative assumptions, not market data, selling lettuce and tilapia over a 10-year horizon. Direct sales to consumers are called business-to-consumer (B2C) sales, and sales to retailers or restaurants are business-to-business (B2B) wholesale. Every result recomputes from the inputs below. The backyard case assumes lower yields, a 40% sold share and a higher fish price because a hobby system sells its surplus to neighbors. The large farm sells 85% wholesale because its volume exceeds what direct retail absorbs. Commercial labor lines are assumed to include the founder’s own pay, and capex includes no separate contingency or permit line.
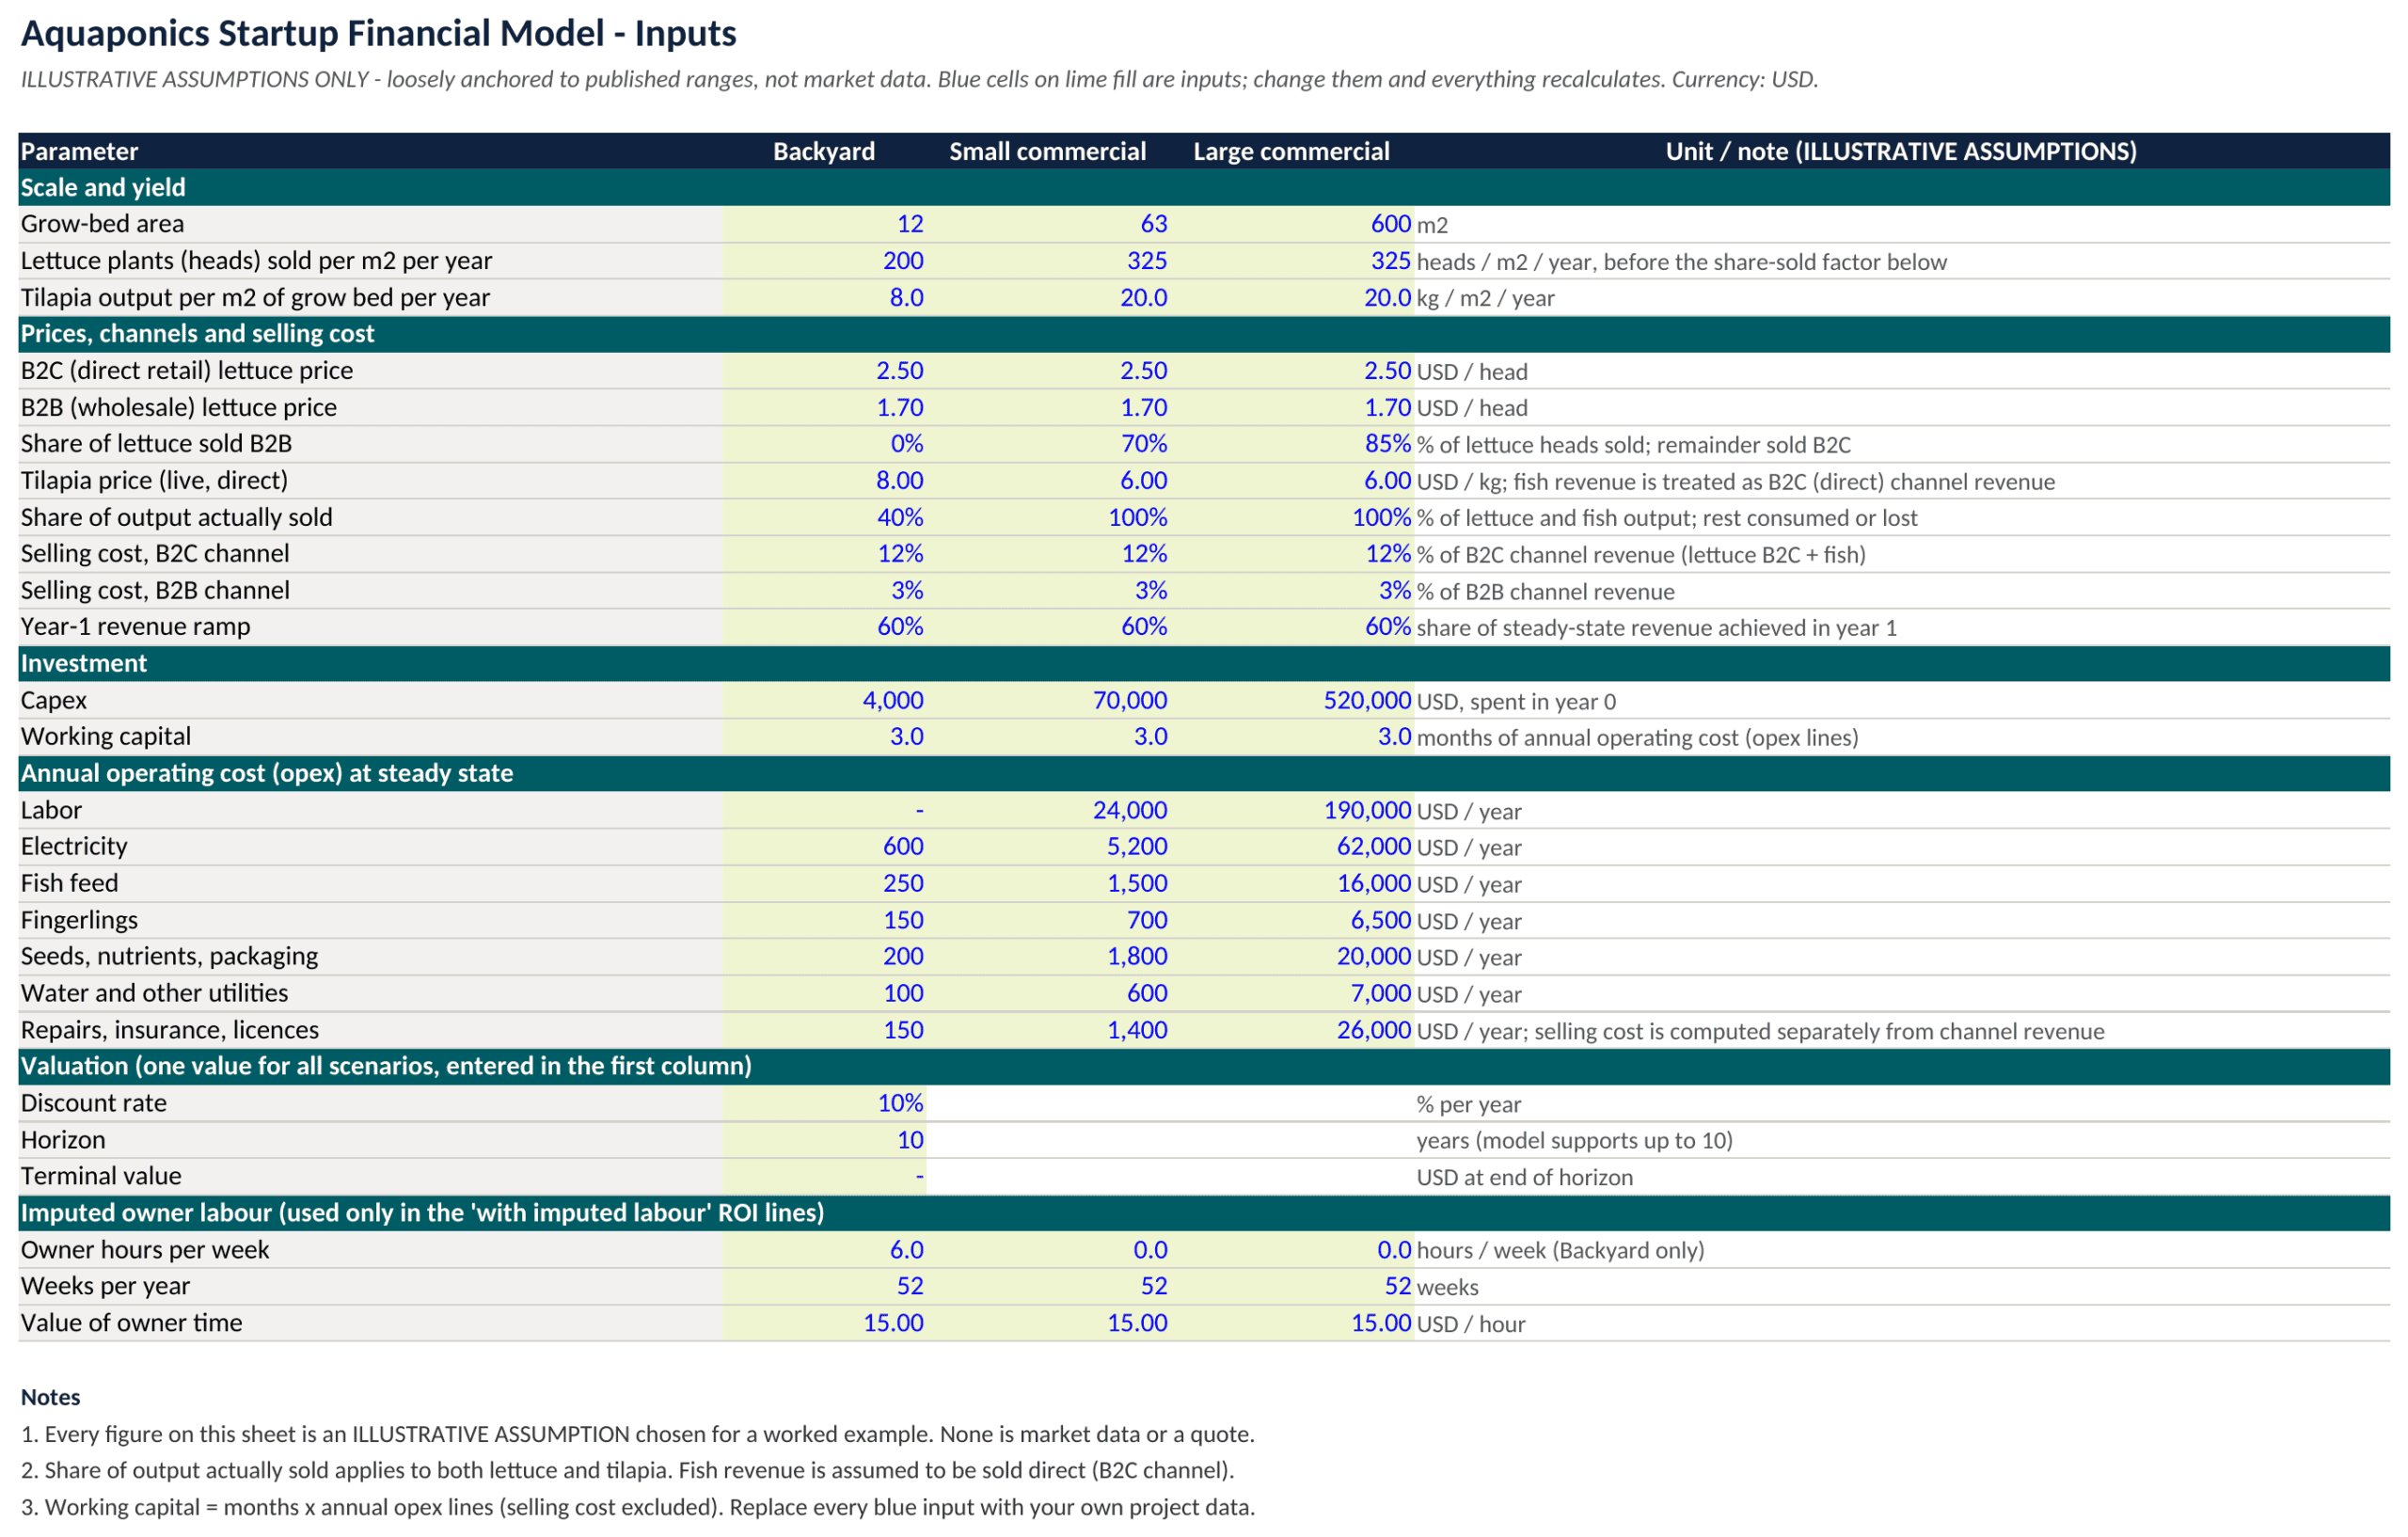
| Input (per scenario) | Backyard | Small commercial | Large commercial |
|---|---|---|---|
| Grow-bed area (m2) | 12 | 63 | 600 |
| Lettuce heads per m2 per year | 200 | 325 | 325 |
| Tilapia kg per m2 per year | 8 | 20 | 20 |
| Share of output sold | 40% | 100% | 100% |
| Lettuce price, B2C / B2B (USD per head) | 2.50 / 1.70 | 2.50 / 1.70 | 2.50 / 1.70 |
| Share of lettuce sold B2B | 0% | 70% | 85% |
| Tilapia price (USD per kg) | 8.00 | 6.00 | 6.00 |
| Startup cost, capex (USD) | 4,000 | 70,000 | 520,000 |
| Operating costs before selling cost (USD per year) | 1,450 | 35,200 | 327,500 |
| of which labor (USD per year) | 0 | 24,000 | 190,000 |
| of which electricity (USD per year) | 600 | 5,200 | 62,000 |
| of which feed, fingerlings, seeds, water, repairs (USD per year) | 850 | 6,000 | 75,500 |
Selling cost is 12% of B2C revenue and 3% of B2B revenue, and tilapia counts as a direct sale in every case. For the small commercial farm, 63 m2 times 325 heads gives 20,475 heads. Selling 70% B2B at USD 1.70 and 30% B2C at USD 2.50 gives lettuce revenue of USD 39,722, and 1,260 kg of tilapia at USD 6.00 adds USD 7,560, for revenue of USD 47,282. Selling costs are USD 3,481 and operating costs are USD 35,200, so annual operating profit, meaning revenue minus operating and selling costs before tax, interest and depreciation, is USD 8,601. The model treats that profit as annual cash flow, ignoring tax, interest and payment timing.
Return on investment (ROI) here is annual operating profit divided by capex, and simple payback divides the funding requirement by annual operating profit. Net present value (NPV) is the sum of the 10 annual cash flows discounted to today, minus the funding requirement. The discount rate, the annual rate that converts future cash into today’s value, is 10%, set as an illustrative 4% government-bond yield plus a 6% premium for single-site farm risk rather than a market quote. The internal rate of return (IRR) is the discount rate at which NPV equals zero. Year 1 earns 60% of steady-state profit, working capital is recovered in year 10, and the terminal value, the value of the farm after year 10, is zero.
| Result (USD unless stated) | Backyard | Small commercial | Large commercial |
|---|---|---|---|
| Funding requirement | 4,363 | 78,800 | 601,875 |
| Steady-state annual revenue | 2,707 | 47,282 | 426,900 |
| Annual operating profit | 932 | 8,601 | 73,532 |
| ROI (annual profit / capex) | 23.3% | 12.3% | 14.1% |
| Simple payback (years) | 4.7 | 9.2 | 8.2 |
| NPV at 10% | 1,167 | -25,688 | -145,227 |
| IRR | 15.5% | 2.5% | 4.6% |
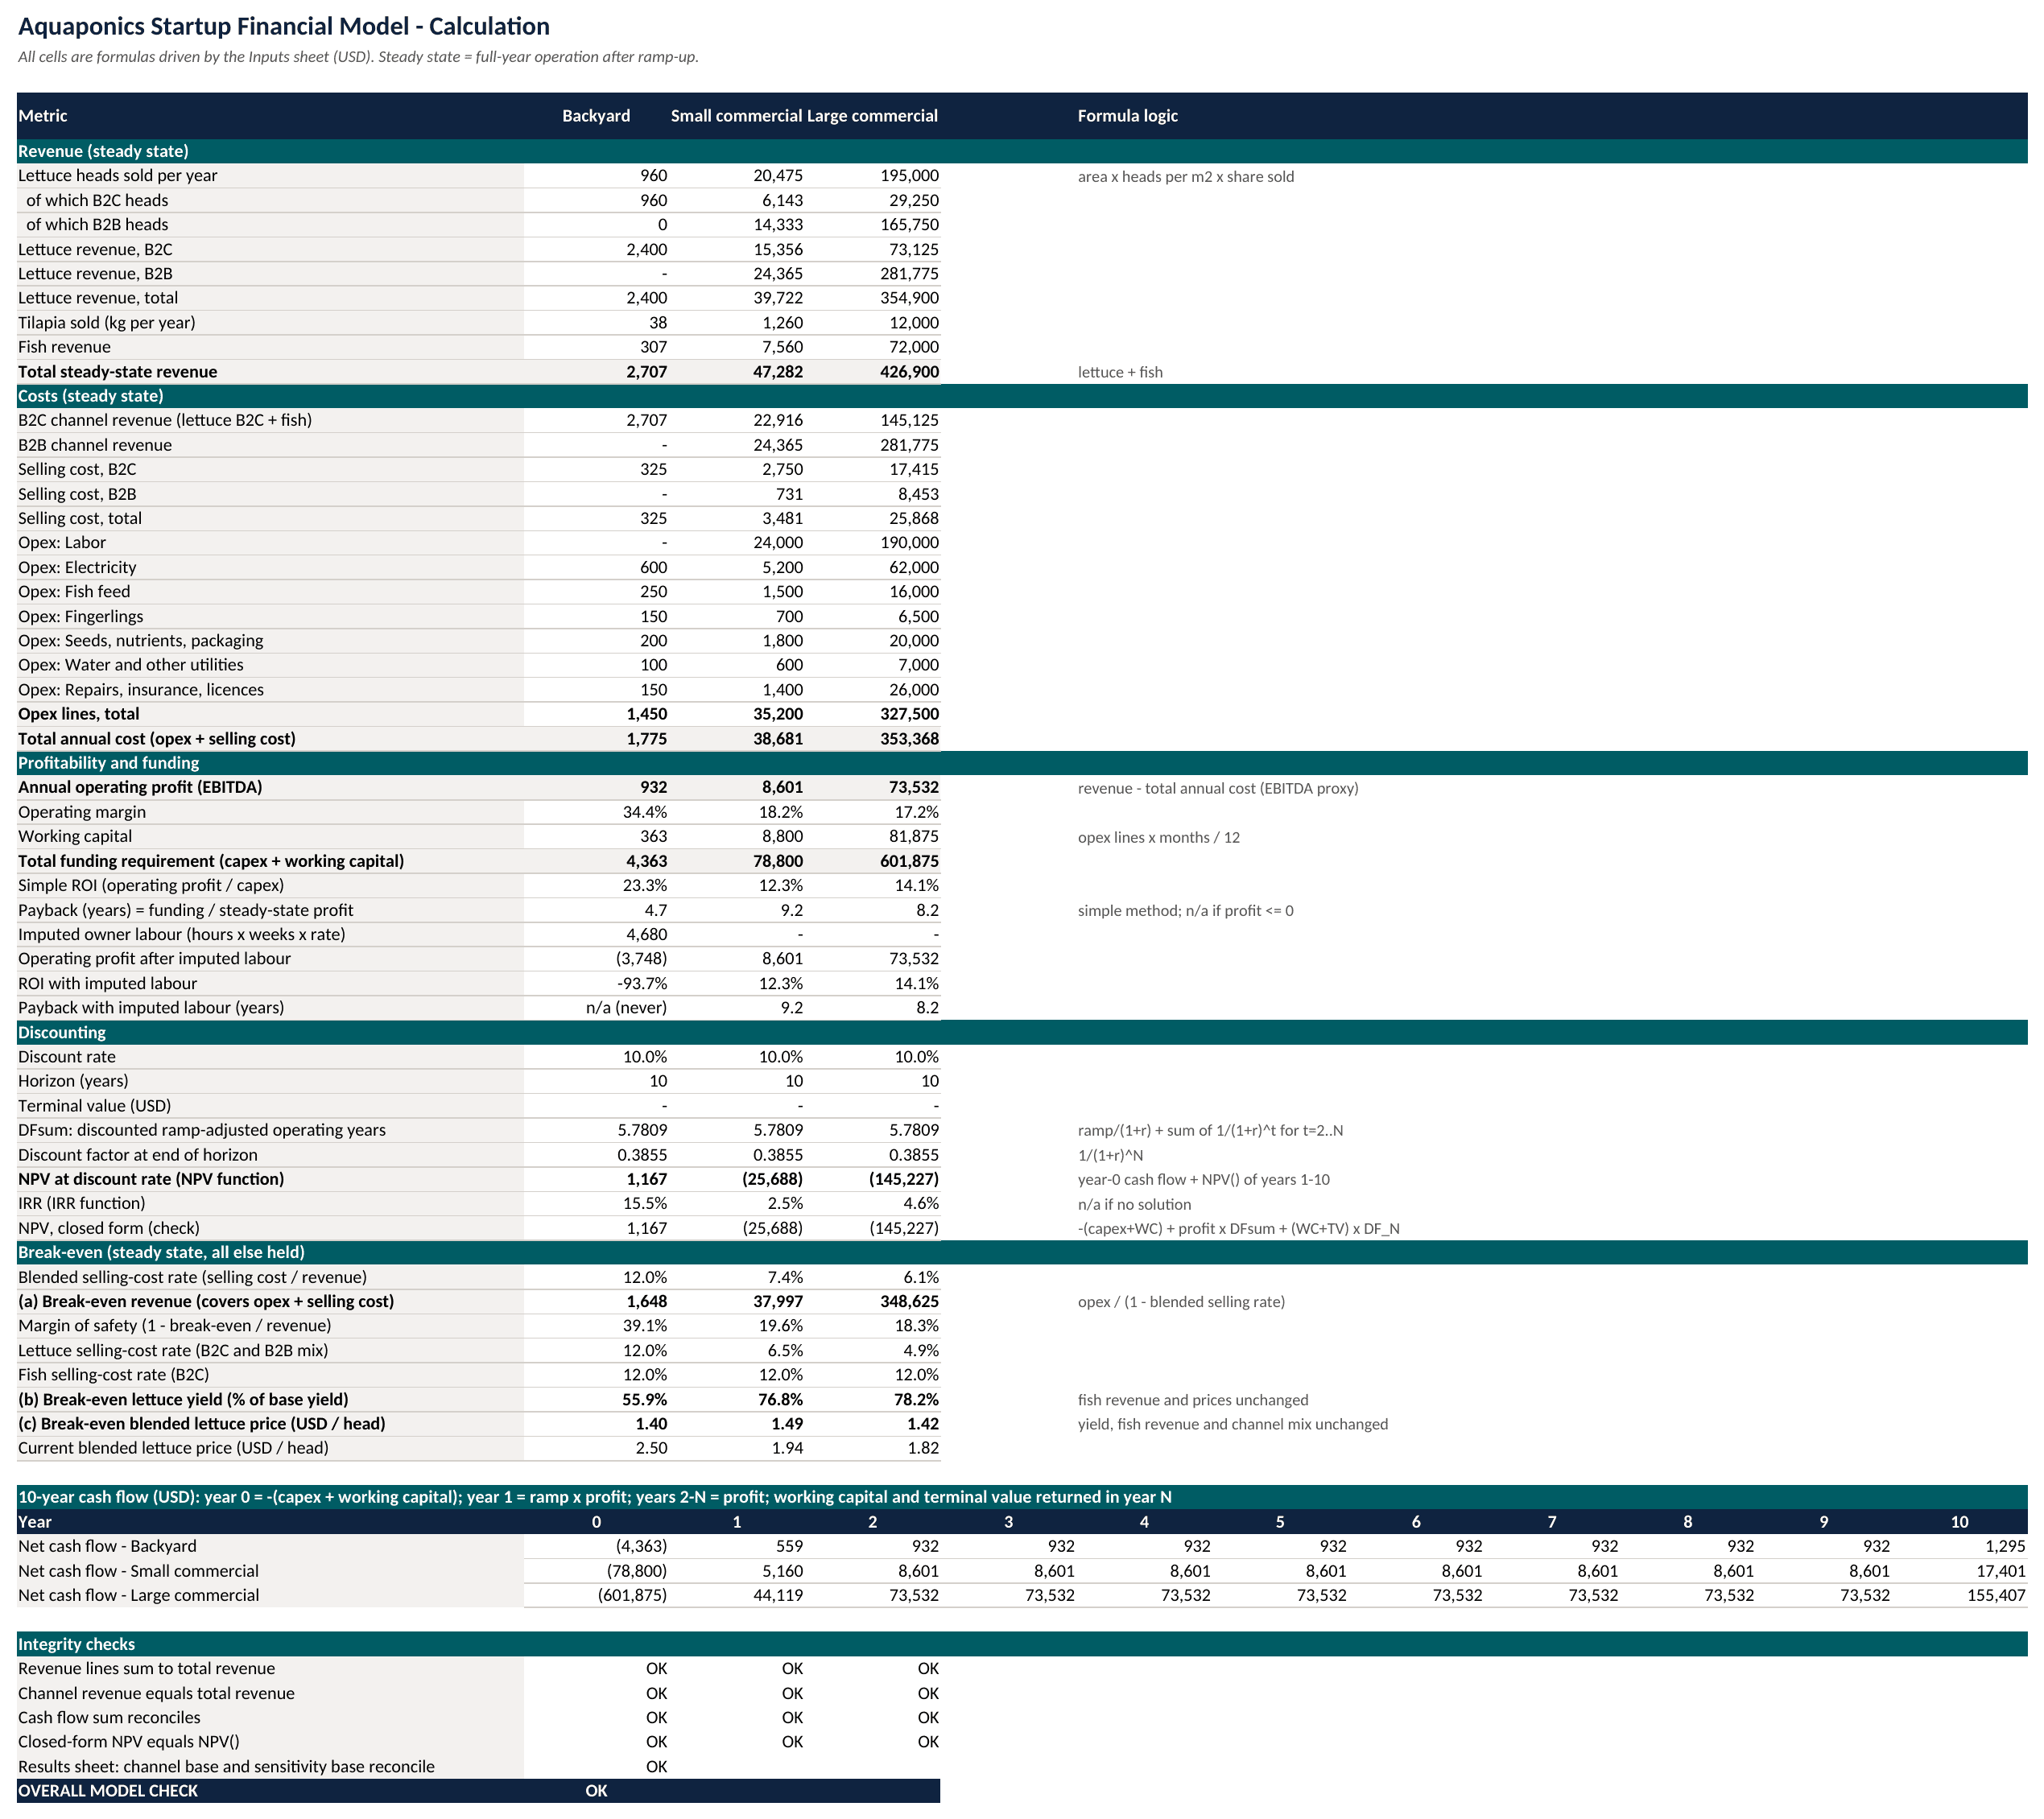
Among the three base scenarios, only the backyard case has a positive NPV, and only if the owner’s time is free: valuing six hours a week at USD 15 an hour (USD 4,680 a year) turns its USD 932 profit into a loss of USD 3,748.
Break-Even Lettuce Yield Is About Three Quarters of Plan At Commercial Scale
Break-even here is an operating break-even: the point where revenue equals total annual cost, with no recovery of the startup investment, so a farm at break-even still has a negative NPV. Each result below cuts only lettuce yield and holds fish output, prices and fixed costs unchanged, with selling cost falling alongside lettuce sales. The small farm breaks even at 76.85% of planned lettuce yield, which is revenue of USD 38,085 (0.7685 times USD 39,722 of lettuce plus USD 7,560 of tilapia), or a blended lettuce price of USD 1.49 against USD 1.94 planned. The large farm breaks even at 78.22% of planned yield, revenue of USD 349,617 and a blended price of USD 1.42 against USD 1.82. The backyard breaks even at 55.86%, revenue of USD 1,648 and a blended price of USD 1.40 against USD 2.50.
Yield and Price Move Profit Nearly Twice as Much as Labor
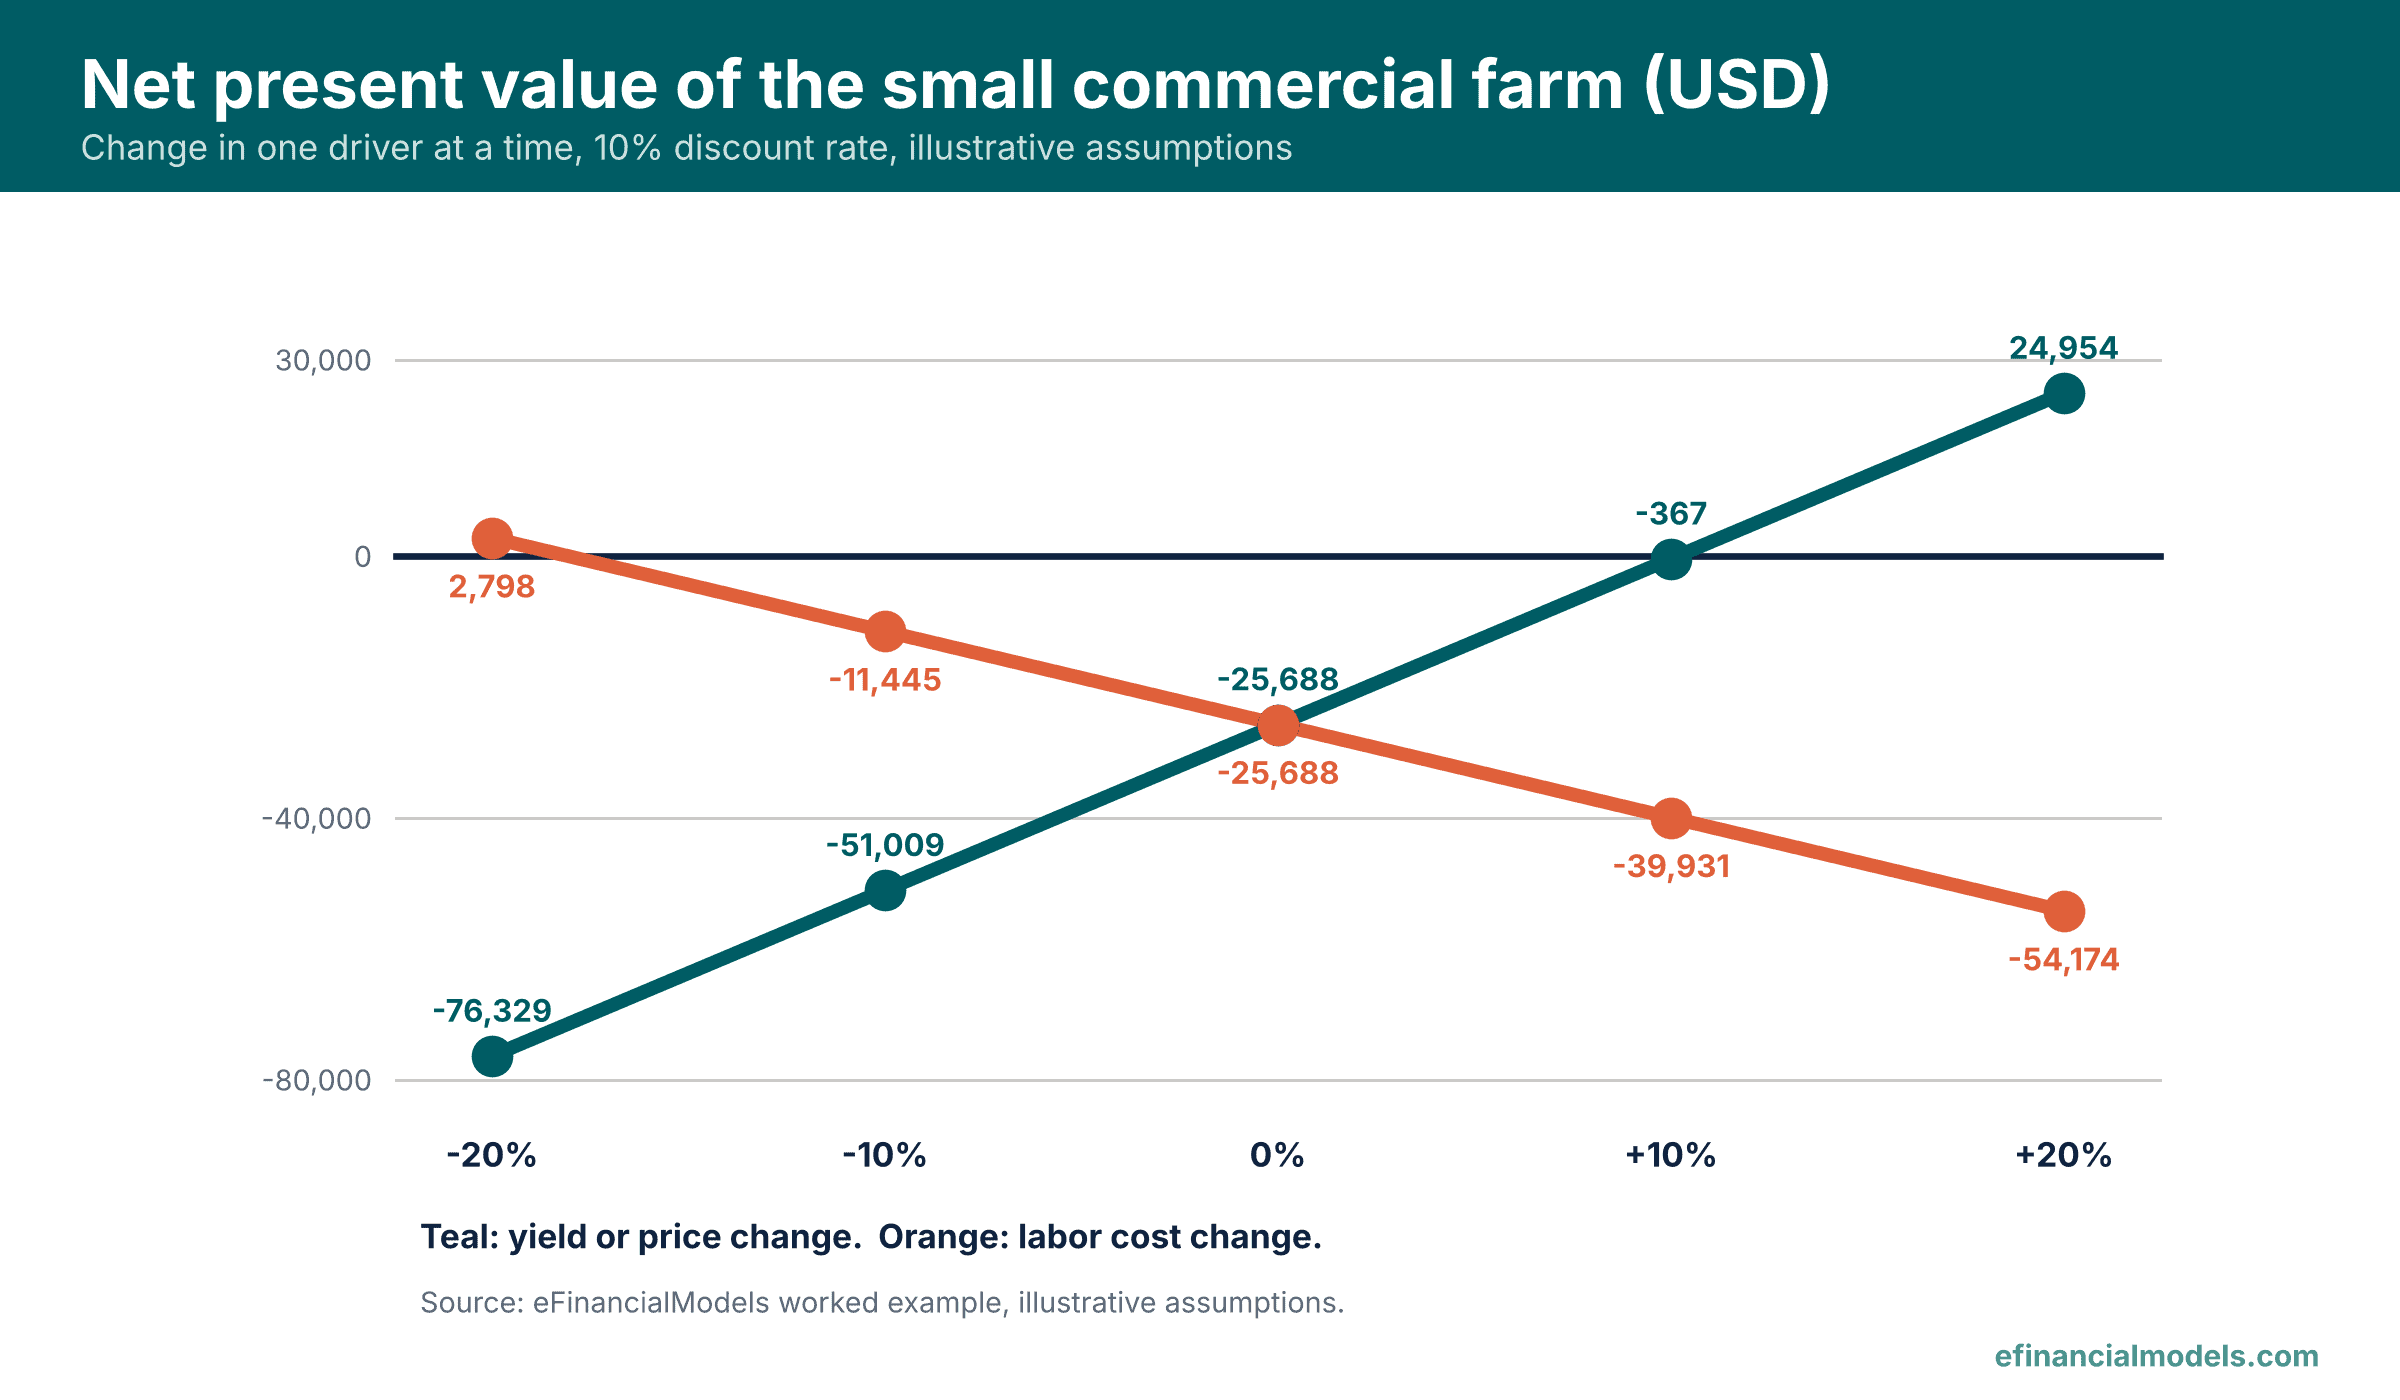
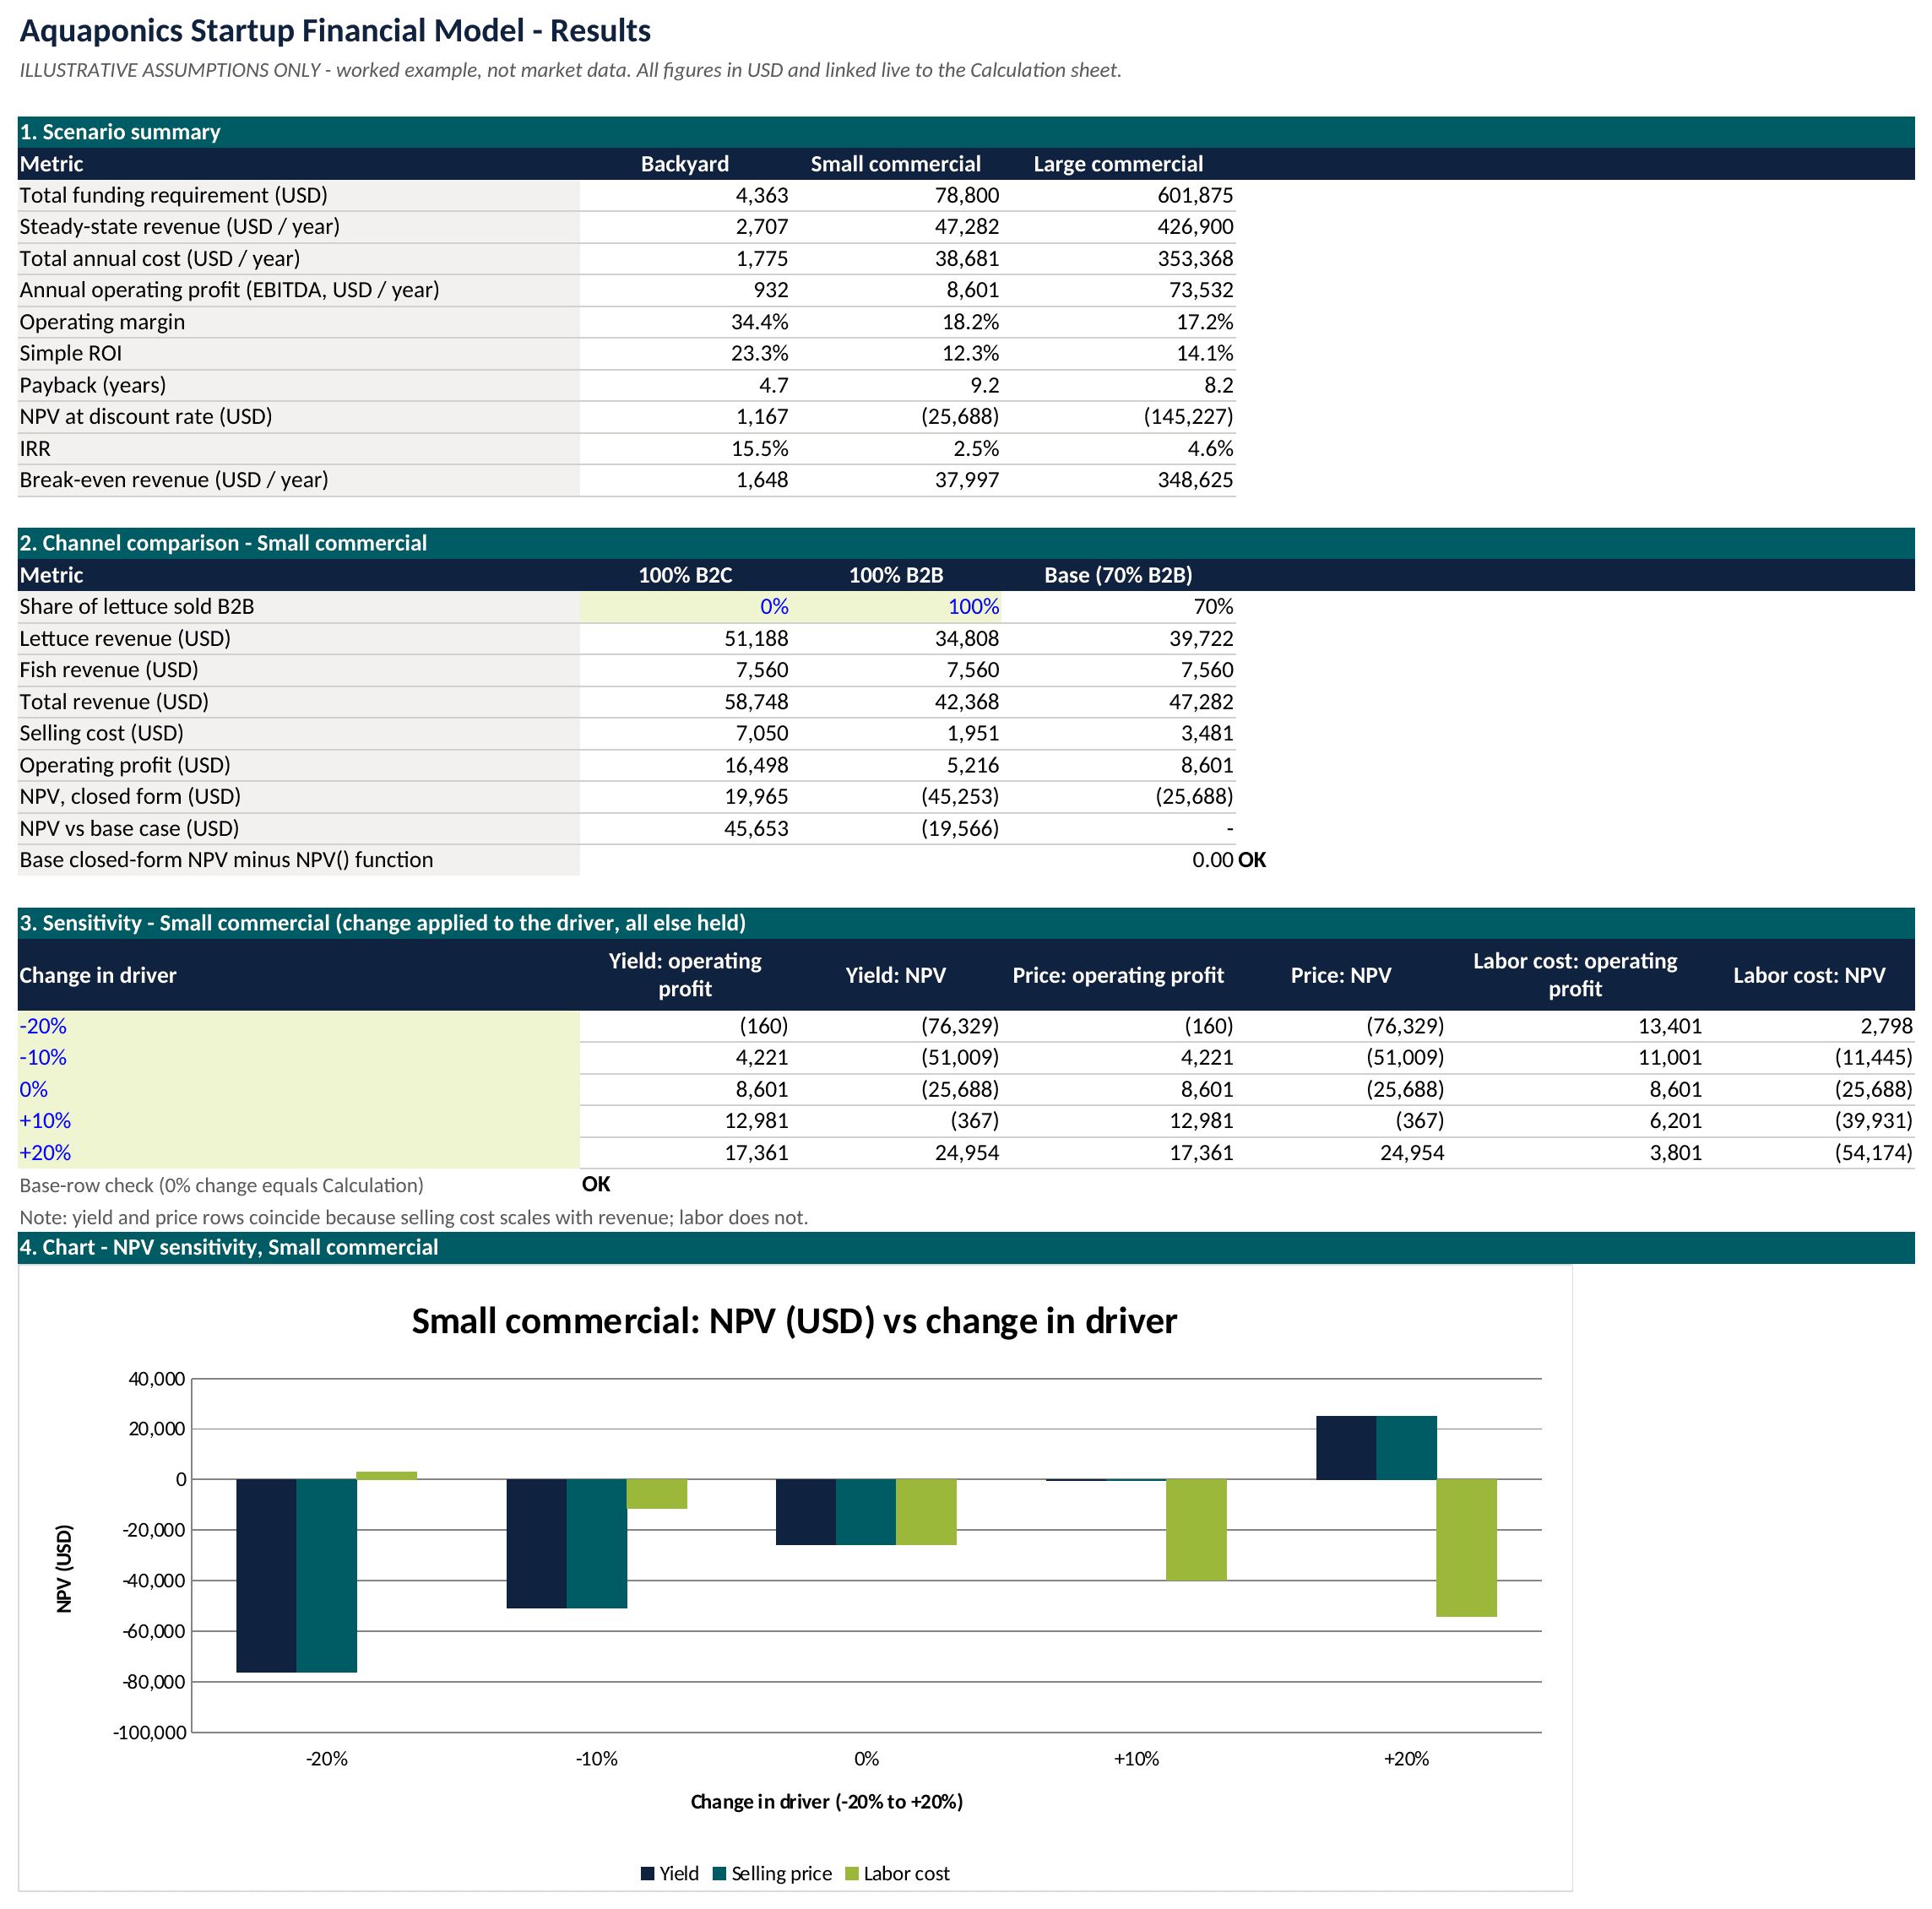
Sensitivity analysis is the practice of changing one input at a time to see how a result responds. The table varies the small commercial farm, changing lettuce and tilapia yield or price together with input costs held fixed; the two coincide because selling cost is proportional to revenue.
| Change in driver | Profit: yield or price | NPV: yield or price | Profit: labor cost | NPV: labor cost |
|---|---|---|---|---|
| -20% | -160 | -76,329 | 13,401 | 2,798 |
| -10% | 4,221 | -51,009 | 11,001 | -11,445 |
| 0% | 8,601 | -25,688 | 8,601 | -25,688 |
| +10% | 12,981 | -367 | 6,201 | -39,931 |
| +20% | 17,361 | 24,954 | 3,801 | -54,174 |
A 20% rise in yield or price turns NPV positive at USD 24,954, and a 20% cut in labor cost does so at USD 2,798.
B2C Direct Sales Versus B2B Wholesale Changes the Verdict
Only the selling channel changes across these runs of the 63 m2 farm; figures are rounded from the workbook.
| Channel mix | Revenue | Selling cost | Operating profit | NPV at 10% |
|---|---|---|---|---|
| 100% B2C | 58,748 | 7,050 | 16,498 | 19,965 |
| 70% B2B / 30% B2C (base) | 47,282 | 3,481 | 8,601 | -25,688 |
| 100% B2B | 42,368 | 1,951 | 5,216 | -45,253 |
The B2C result is a demand assumption: it needs buyers for every head at retail prices and keeps labor fixed although retail selling takes more time.
US Microloans and Questions for Advisers
In the United States, Farm Service Agency (FSA) microloan limits in October 2024 were USD 50,000 for farm ownership and USD 50,000 for operating loans, USD 100,000 combined (Farm Service Agency microloans, 2024). The USD 78,800 small-farm requirement exceeds either single cap and fits only if both loan types qualify, the USD 601,875 large farm does not fit, and the document does not name aquaponics, so eligibility is unconfirmed. Outside the United States, a national agricultural lender or extension service plays the same role. Tax treatment, permits, water rights and food-safety rules fall outside the model; a tax adviser, the local extension office and a lender can answer them.
Conclusion
An aquaponics financial model should show funding requirement, break-even output and sensitivity before equipment is bought, because channel, yield and labor can decide the outcome. Founders who want a ready structure for a fish-farming business can start from the Fish Farm Valuation Model from eFinancialModels, an Excel valuation model for fish farmers and investors. More templates sit in the Fish Farming category, with Break-Even and Sensitivity Analysis tags for the two checks above.
Frequently Asked Questions
What should an aquaponics startup budget include?
A complete budget lists tanks, grow beds, pumps, aeration, a greenhouse or building, monitoring equipment, permits and licences, and a contingency reserve for equipment failure or fish loss. Cash for feed, fingerlings, electricity and wages until the first harvests sell must be added, because budgets that stop at equipment understate the cash a new farm needs in its first year of operation.
What returns have published studies reported?
One 2026 study of a micro-scale system in Bandundu, Democratic Republic of the Congo, found the net present value turned positive only beyond a scale-up of about 34 times, and at 40 times payback was 4.89 years and the internal rate of return about 15.71% (Frontiers in Sustainable Food Systems). A 2026 study of small tilapia and arugula modules in Rio Verde, Brazil, reported an IRR above 90% and a modified internal rate of return (MIRR) of 44% at its higher fish densities (Anais da Academia Brasileira de Ciencias). Both are small-scale results, so local prices and wages make them reference points, not forecasts.
Does fish or lettuce bring in more revenue?
In the small commercial case, lettuce brings in roughly five times the revenue of tilapia, so plants carry the business and fish mainly supply nutrients. That ratio shifts with species, stocking density and local fish prices, and a farm selling premium fish directly could change the balance, which is why fish and plant inputs should be tested separately in any model.