0 ITEMS

Break-Even Analysis: Calculate Your Time to Profitability

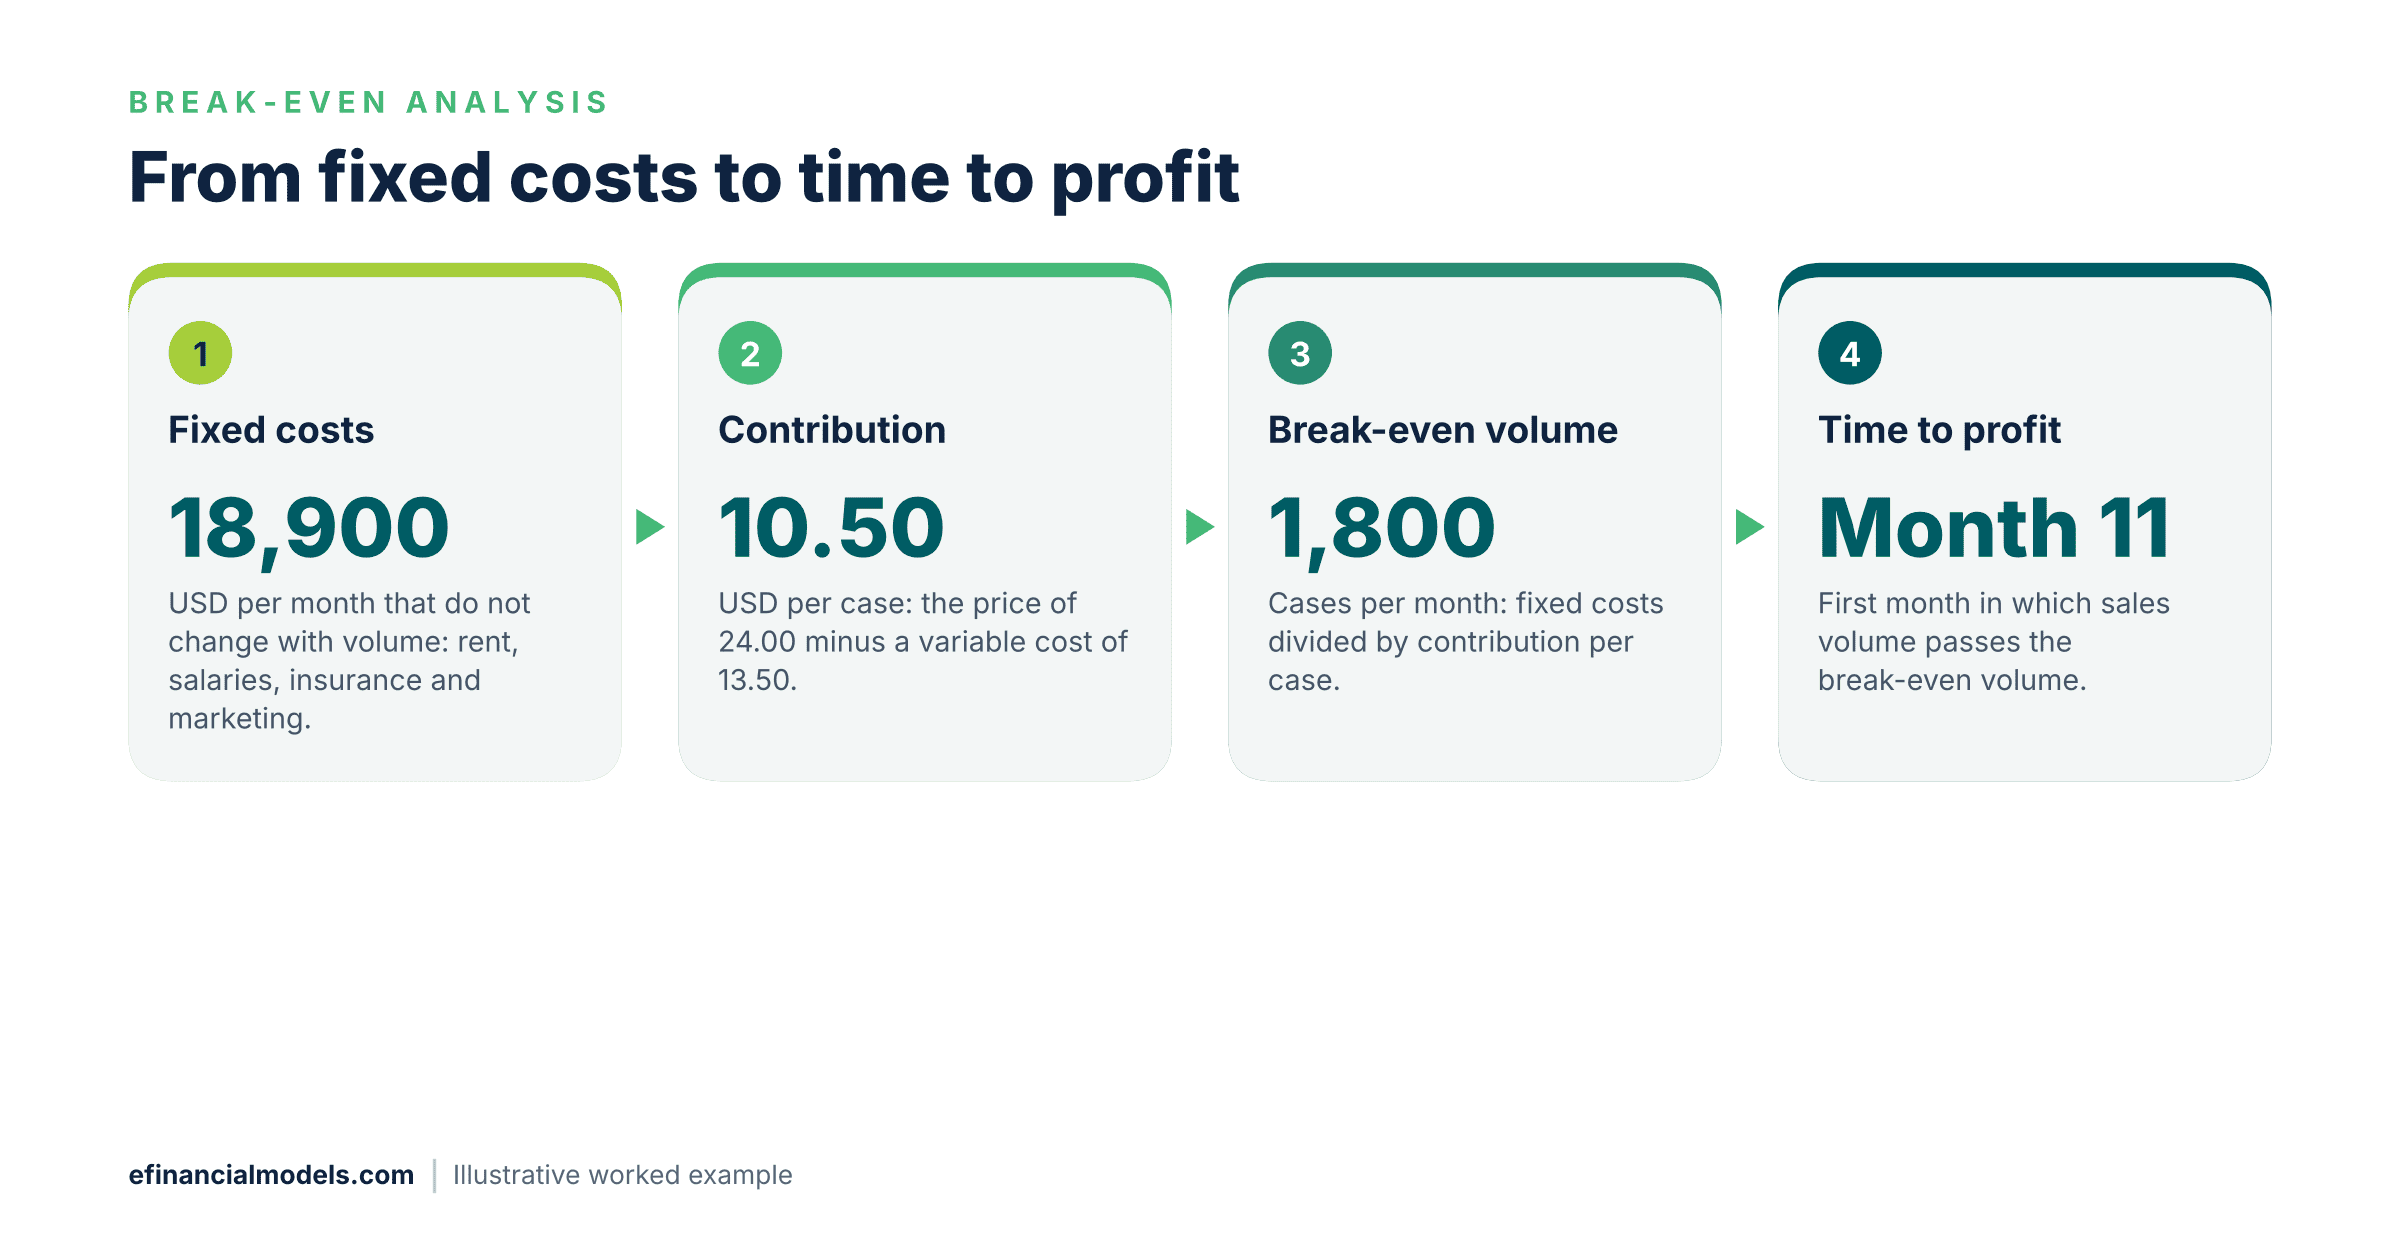
A beverage startup breaks even when sales revenue minus variable costs covers its fixed costs, which takes 1,800 cases a month in the worked example below, and the example reaches that volume in month 11. Time to profitability depends on how fast sales ramp up, so the same formula gives different dates for different growth paths.
Key Takeaways
- Break-even volume equals fixed costs divided by contribution per unit, where contribution is the selling price minus the variable cost of one unit.
- In the worked example, 1,800 cases a month cover USD 18,900 of monthly fixed costs at a contribution of USD 10.50 per case.
- Break-even volume is a quantity and time to profitability is a date, so the sales ramp decides how long a startup waits.
- The example turns profitable in month 11, but cash recovers the USD 120,000 investment plus early losses only in month 29, before tax and financing.
- In the worked example, a USD 1.50 price cut lifts break-even volume to 2,100 cases a month, so price deserves an early test.
Break-Even Analysis Finds the Sales Volume Where Revenue Equals Total Cost
The US Small Business Administration (SBA) states that “the break-even point is the point at which total cost and total revenue are equal” (SBA startup cost guide, accessed November 2026). The same guide gives the formula as fixed costs divided by price minus variable costs, which equals the break-even point in units. A fixed cost is a cost that stays the same at any sales level, such as rent or salaries. A variable cost rises with every unit sold, such as ingredients, cans and freight. Contribution per unit is the price minus the variable cost, and it is the amount each unit adds toward paying the fixed costs.
Contribution per case = Price per case - Variable cost per case
Break-even cases per month = Fixed costs per month / Contribution per case
Break-even revenue = Break-even cases x Price per case
The result is a volume, not a date, and a faster sales ramp reaches it sooner. Templates for this calculation sit in the eFinancialModels Break-Even and Food and Beverages collections.
Time to Profitability Has Two Milestones
The first profitable month is the first month in which operating profit, which is revenue minus variable and fixed costs, rises above zero. The payback month is the month in which cumulative cash turns positive after the startup investment in equipment, permits and first inventory has been recovered. Outside funding has to cover the whole period of negative cumulative cash, which starts at launch and not at the first profitable month, and the funding need is the deepest point of that cash curve, which falls before the first profitable month.
Planning Guidance and Industry Data Show Why the Timeline Matters
The SBA startup cost guide states that “you’ll want to count at least one year of monthly expenses, but counting five years is ideal” (SBA startup cost guide, accessed November 2026).
Craft brewing is a closely related segment and gives broad context, not a timeline for any single startup. US craft brewery openings dropped to 300 in 2025 from 518 in 2024, closures fell to 481 from 591, and craft production fell 4% to 22,034,000 barrels, according to the Brewers Association (Brewers Association, 2026). Whenever volume falls, the same fixed costs are spread over fewer units, which pushes break-even further away.
Worked Example: Break-Even for a Canned Beverage Startup
This worked example is illustrative. Every figure is an assumption chosen for the example, not market data. Assume a startup sells sparkling juice in cases of 24 cans to distributors at USD 24.00 per case. Ingredients cost USD 4.20, packaging USD 6.30 and freight USD 3.00 per case, so the variable cost is USD 13.50 per case. Fixed costs are USD 18,900 a month: USD 6,000 for rent and utilities, USD 9,000 for salaries, USD 1,200 for insurance and admin, and USD 2,700 for marketing. The startup investment is USD 120,000. Sales start at 600 cases in month 1, and each later month equals the previous month’s rounded volume times 1.12, rounded to whole cases, until the 3,000-case monthly capacity is reached. Fixed costs exclude any founder draw, which the FAQ adds as a separate case, and profit figures exclude tax, interest, depreciation and working capital, which is the cash tied up in inventory and unpaid distributor invoices.
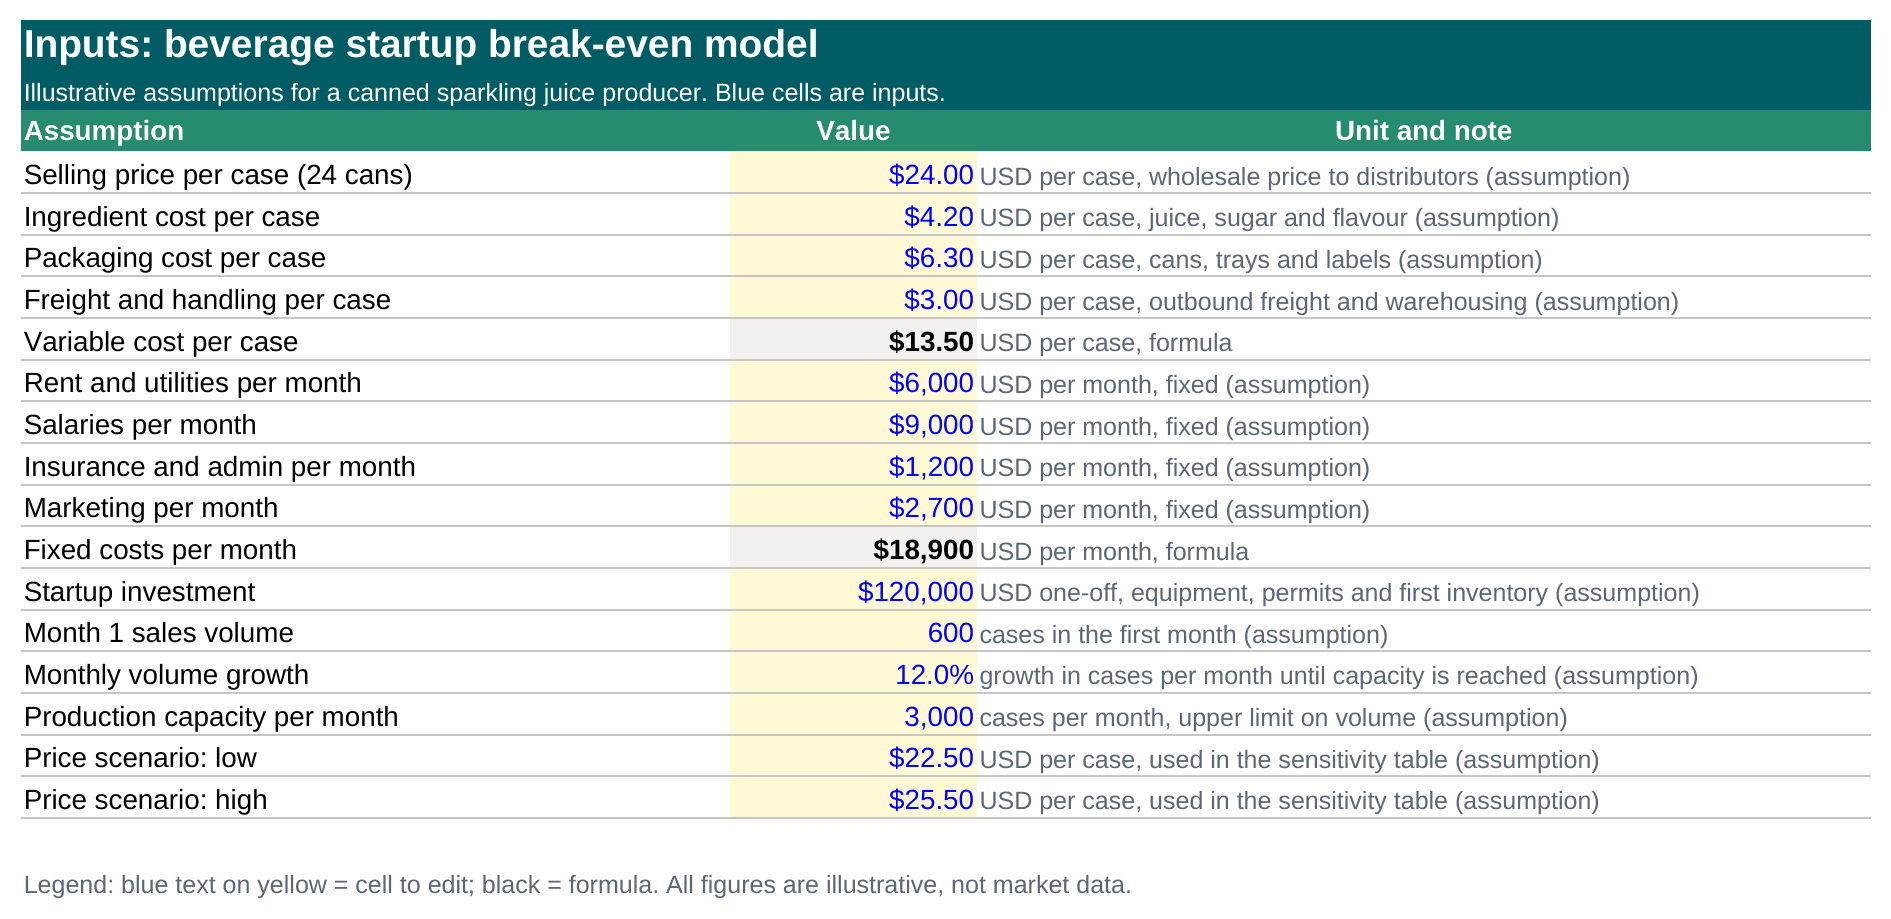
Contribution is USD 24.00 minus USD 13.50, which is USD 10.50 per case, and the contribution margin is USD 10.50 divided by USD 24.00, which is 43.75%. Break-even volume is USD 18,900 divided by USD 10.50, which is exactly 1,800 cases a month. Break-even revenue is 1,800 times USD 24.00, which is USD 43,200 a month, and the volume is 60.0% of the 3,000-case capacity.
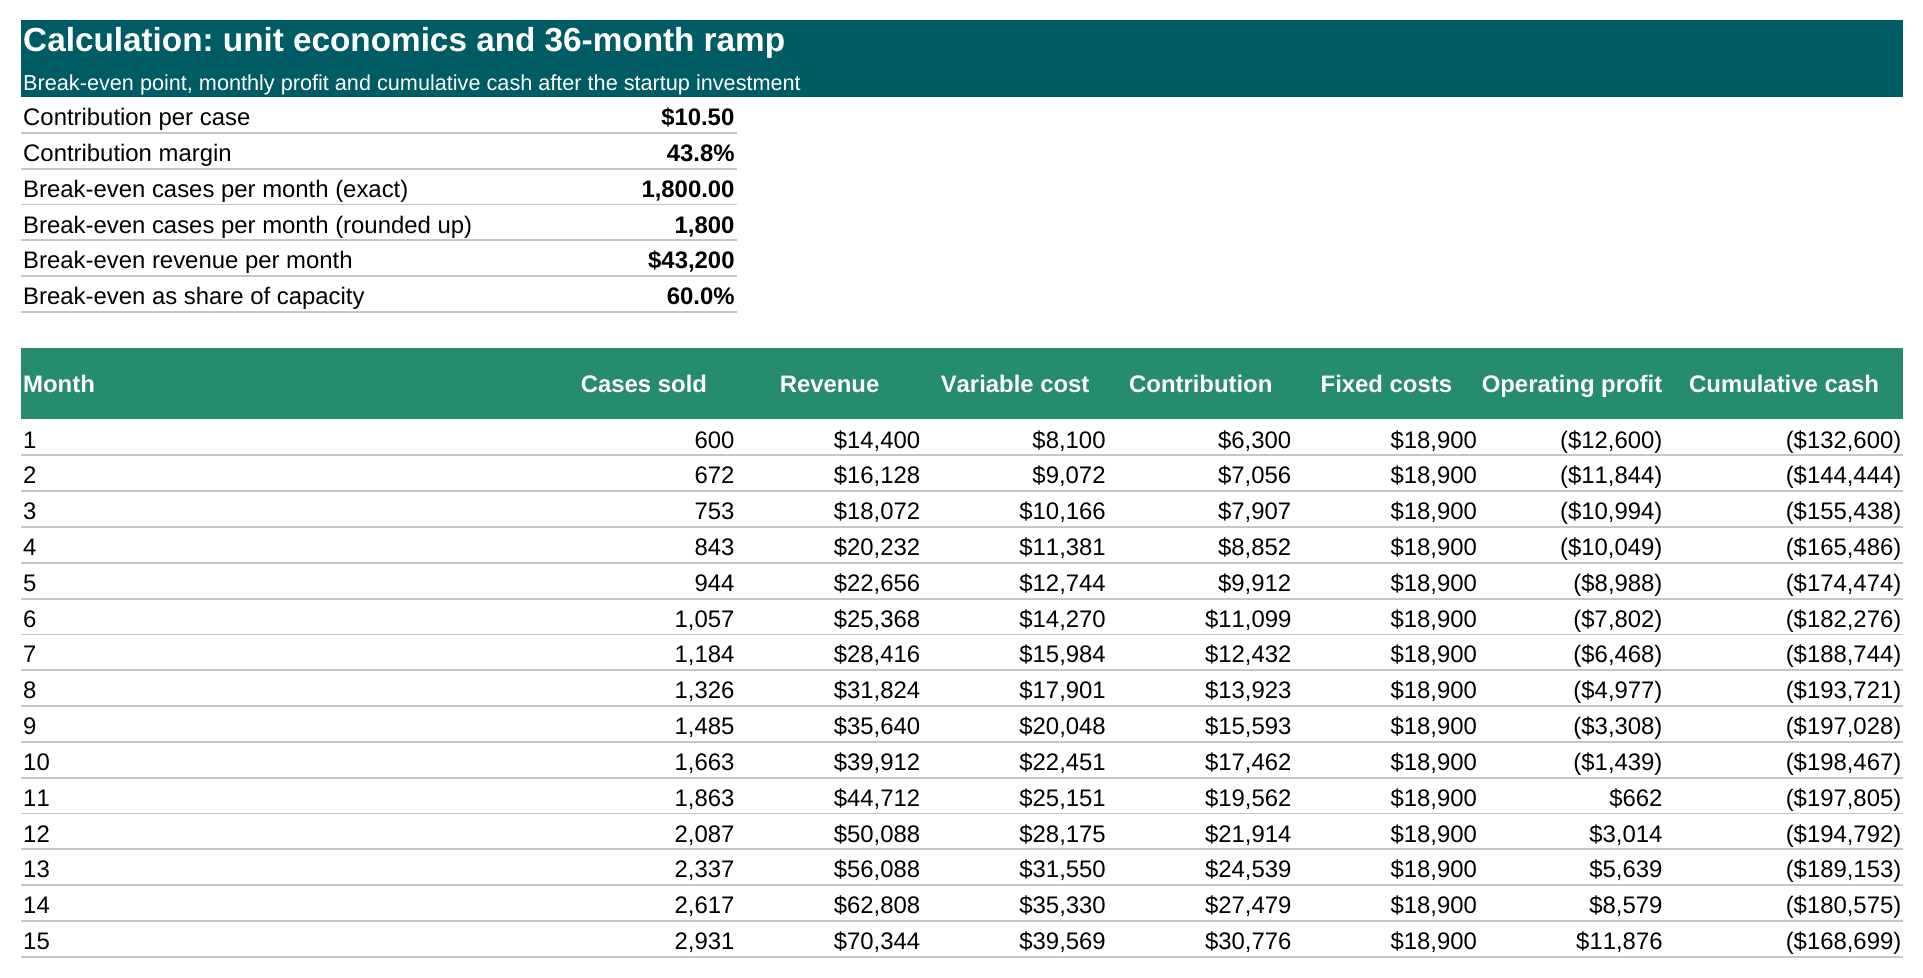
| Month | Cases sold | Operating profit (USD) | Cumulative cash (USD) |
|---|---|---|---|
| 1 | 600 | -12,600 | -132,600 |
| 5 | 944 | -8,988 | -174,474 |
| 10 | 1,663 | -1,439 | -198,467 |
| 11 | 1,863 | 662 | -197,805 |
| 16 | 3,000 | 12,600 | -156,099 |
| 29 | 3,000 | 12,600 | 7,701 |
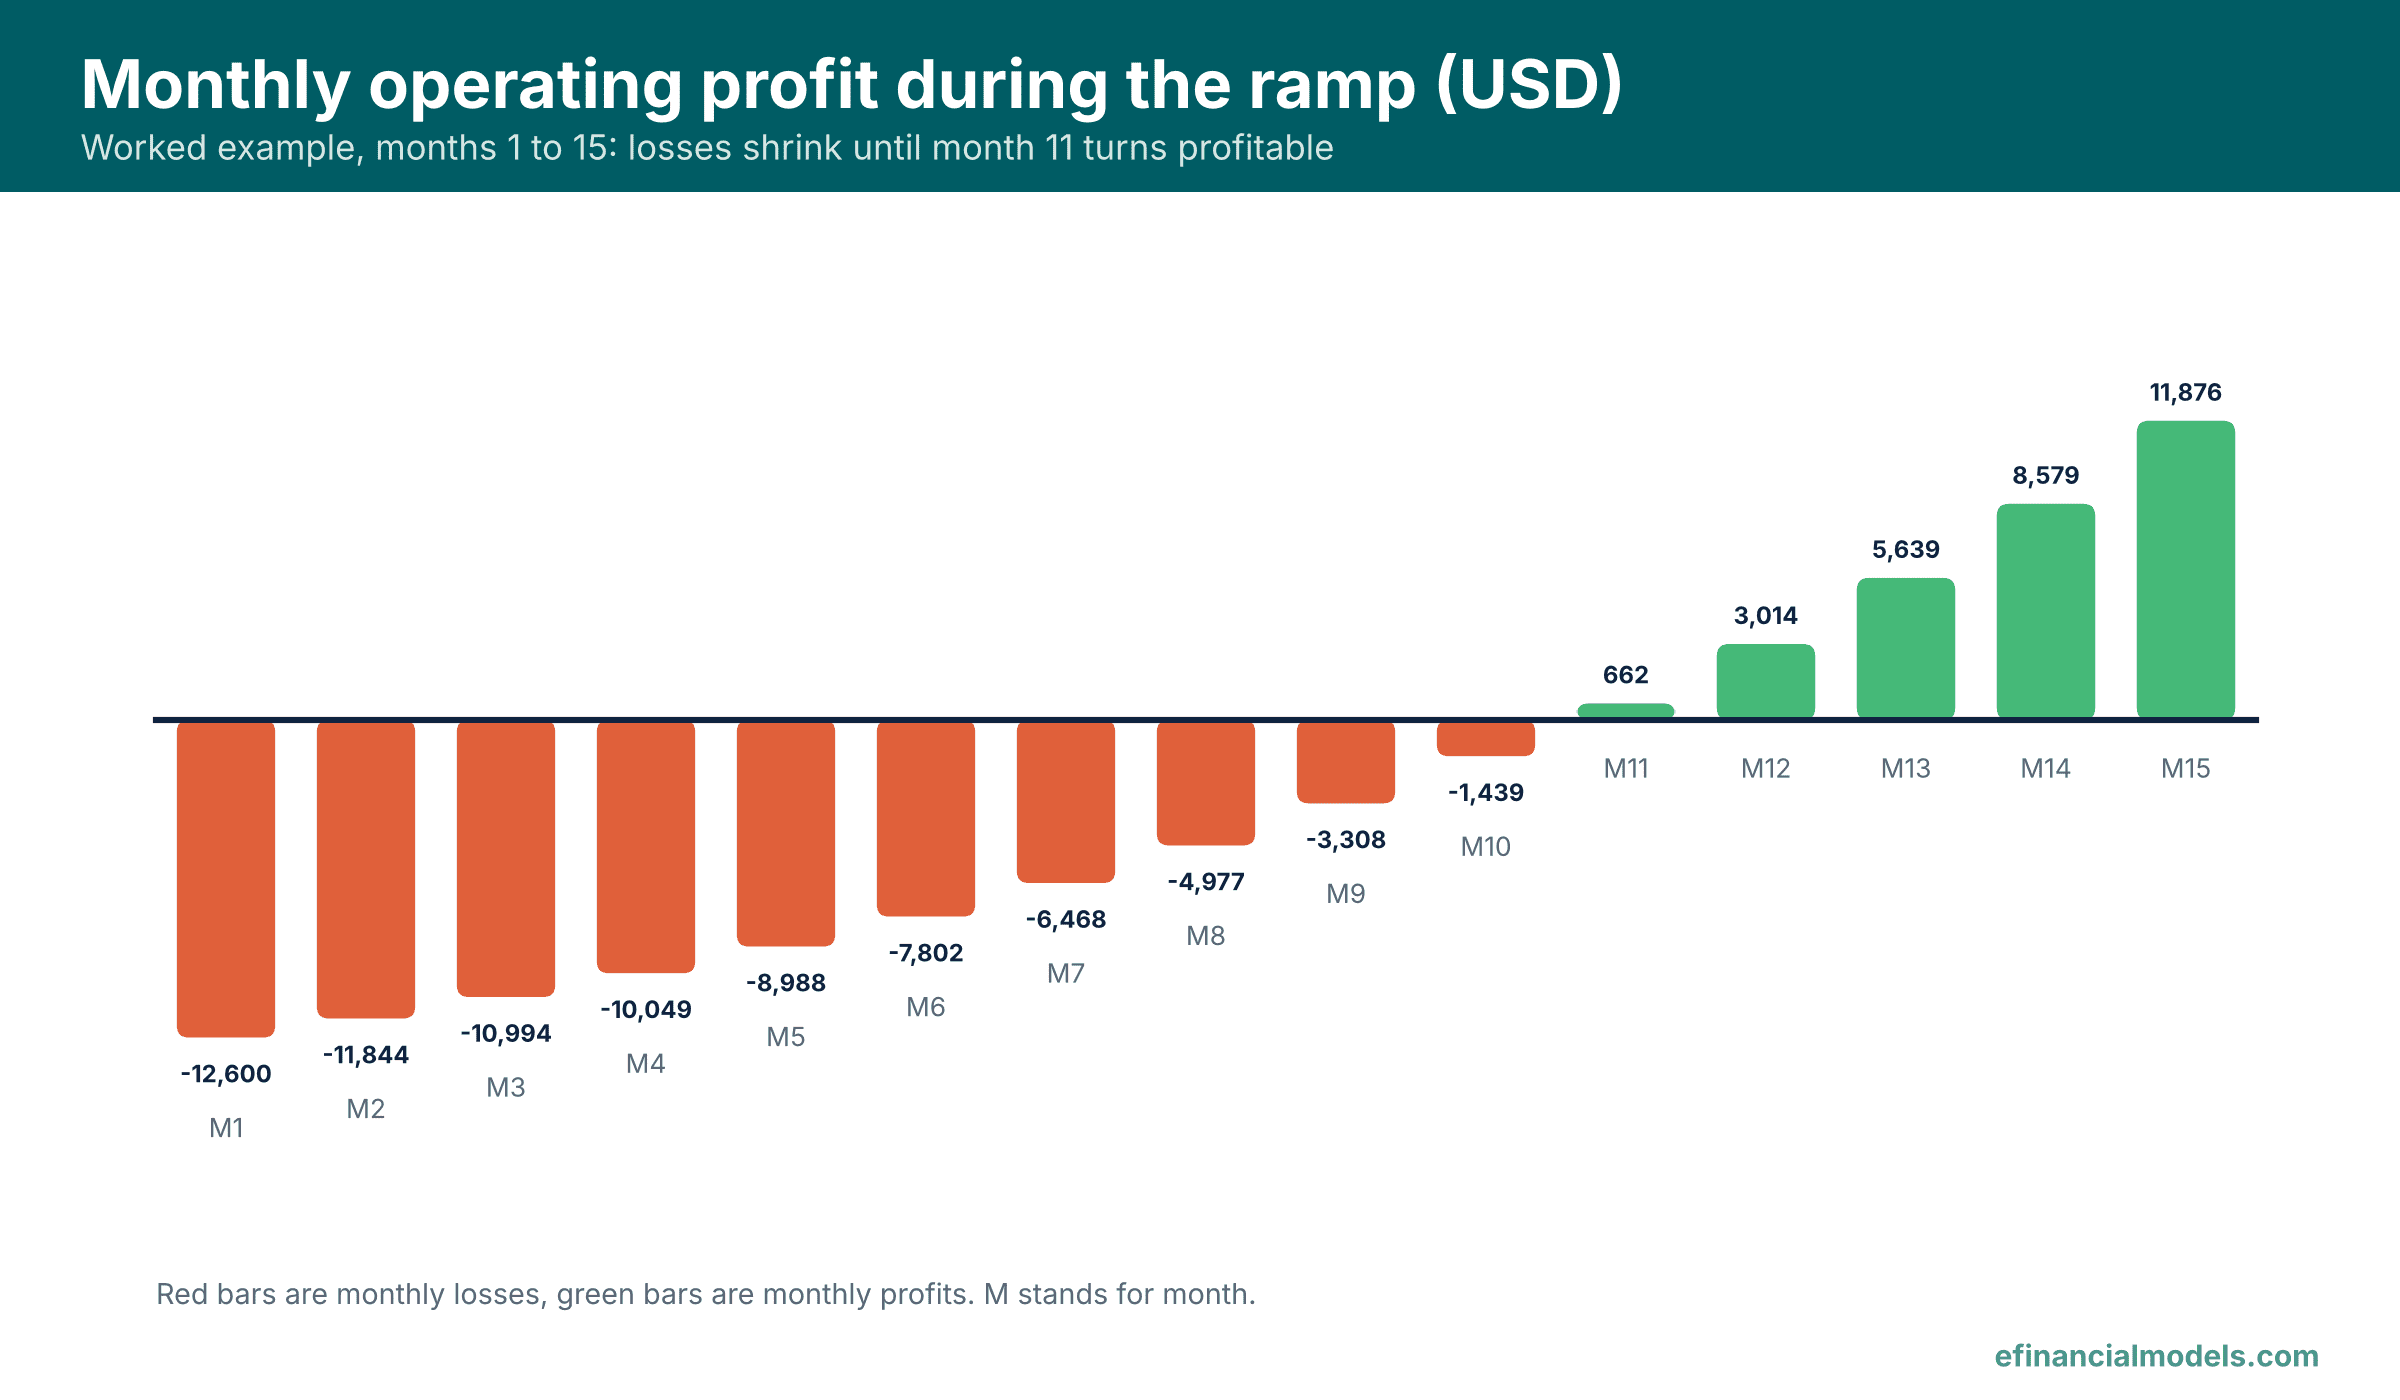
Month 10 sells 1,663 cases, which is below the 1,800-case break-even volume, so that month still loses money. Month 11 sells 1,863 cases, which is 63 cases above break-even volume, and earns USD 662, so month 11 is the first profitable month. Cumulative cash falls until month 10, and its low point of USD -198,467 is the real funding need: the USD 120,000 investment plus about USD 78,467 of early operating losses. From month 16 the startup sells at capacity and earns USD 12,600 a month, and cumulative cash turns positive in month 29, which means month 29 recovers the investment plus the early operating losses. A first-time founder can estimate a real ramp from distributor commitments and pilot sales, and an accountant can add tax and financing to the model.
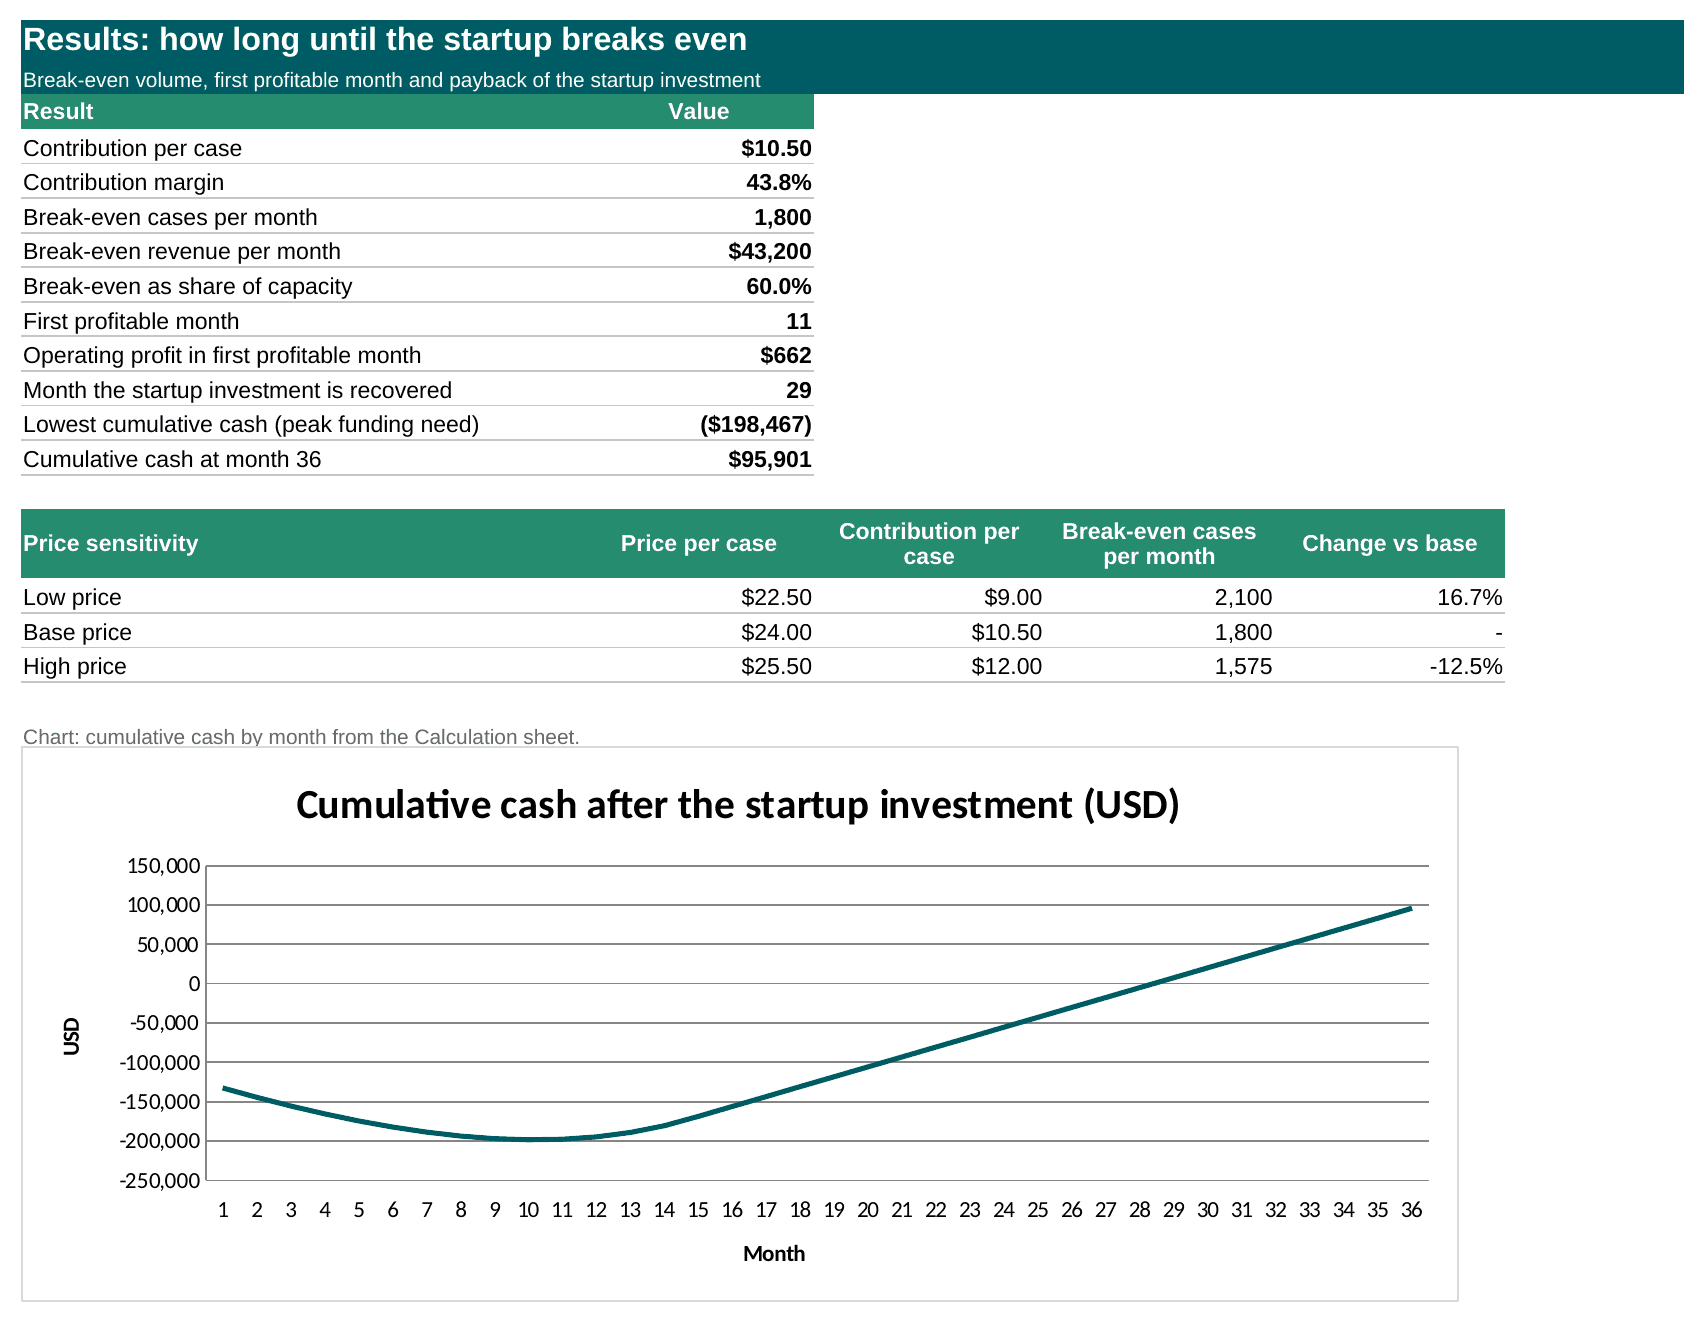
The price scenarios show how sensitive the result is to one input. A price of USD 22.50 cuts contribution to USD 9.00 and lifts break-even volume to 2,100 cases a month, which is 16.7% above the base case. A price of USD 25.50 raises contribution to USD 12.00 and lowers break-even volume to 1,575 cases, which is 12.5% below it.
How SaaS, E-Commerce and Restaurants Change the Inputs
The formula stays the same in every industry, and only the inputs change. Software as a service (SaaS) businesses sell subscriptions, so variable cost per customer is small, but customer acquisition cost and churn, which is the share of customers who cancel in a period, decide the timeline. E-commerce stores carry shipping, payment fees and returns inside variable cost, so contribution per order can be thin. A beverage maker that hires a contract bottler moves cost from fixed to variable, which changes both contribution per case and break-even volume.
Restaurants carry heavy variable costs. In 2024, fullservice restaurants with annual sales of USD 2 million or more reported median food and non-alcohol beverage costs of 31.0% of sales, and those below USD 2 million reported 33.7% (National Restaurant Association, 2025). The gap shows that higher-volume operators reported a lower variable cost ratio, which raises contribution per sale.
Avoid Three Break-Even Mistakes
- Treating break-even volume as a date. The volume says nothing about timing until a monthly sales ramp is added, so the model needs a month-by-month forecast.
- Leaving out the owner’s pay. Fixed costs without a founder draw understate the volume needed, so the worked example labels its timeline as excluding that pay and the FAQ shows the effect.
- Never updating the inputs. Ingredient, packaging and rent prices change, so a quarterly review of the inputs keeps the break-even volume realistic.
Frequently Asked Questions
How do you convert break-even volume into months?
Divide the cash to recover by the monthly profit, then adjust for the ramp. Assume the startup in the example already earned a steady USD 12,600 a month: the USD 120,000 investment would be recovered in about 9.5 months. Real ramps lose money first, so a month-by-month cumulative cash column, which adds each month’s profit or loss to the running total, gives the honest answer instead of a single division.
Should a first-time founder include the owner’s salary in fixed costs?
Yes. Assume the founder draws USD 2,100 a month on top of the existing USD 18,900. Fixed costs rise to USD 21,000, and break-even volume becomes 2,000 cases a month, because USD 21,000 divided by USD 10.50 is exactly 2,000. Leaving the draw out makes the business look healthier than it is, and it hides the point at which the owner can stop funding living costs from savings.
How does break-even work when a startup sells several products?
Use a weighted average contribution. Assume half of the cases are a flavour with USD 10.50 contribution and half are a larger pack with USD 7.50. The blended contribution is USD 9.00, and USD 18,900 divided by USD 9.00 gives 2,100 cases a month in total. Break-even then depends on the sales mix, so a shift toward the lower-margin product pushes the volume up even when total sales look unchanged.
What happens when break-even volume is above production capacity?
The business cannot reach profit at those prices and costs. Assume capacity is 1,600 cases a month against the 1,800-case break-even volume. The founder then has to raise price, cut variable cost, reduce fixed costs or add capacity. At a price of USD 25.50 the volume drops to 1,575 cases, which fits inside a 1,600-case limit, so a price test can settle the question quickly.
How often should a break-even analysis be updated?
Update it every quarter and whenever a major input moves, because supplier price lists, packaging quotes, rent reviews and wage changes all alter contribution or fixed costs. Each quarter, replace forecast volumes with actual cases sold, re-run the cumulative cash column and compare the new first profitable month with the plan. A founder who tracks that gap early can adjust price or spending before the cash runs short.
Conclusion
Break-even analysis turns a hopeful plan into two testable numbers: the monthly volume that covers fixed costs and the month in which cash recovers. Founders who want to test their own price, cost and growth assumptions can start from the eFinancialModels Beverage Manufacturing Start-Up Financial Model, an Excel template whose break-even analysis calculates the sales volume and average price needed to break even in a chosen year, alongside startup costs and payback metrics.