
0 ITEMS

Airbnb Rental Arbitrage Financial Model: Short-Term Rental Portfolio of Leased Units, Break-Even and Max Rent per Door, US and Canada
Excel model for an Airbnb rental arbitrage business: lease apartments or houses, furnish them and rent them by the night or the month. Door-by-door rollout with a new-listing ramp, lease anniversaries, deposits and free rent, five landlord deal structures, per-door break-even and the most rent you can offer, after-tax owner IRR, NPV and payback. US markets by default with a Canadian option. Feasibility and Due Diligence editions, no macros, fully unlocked.
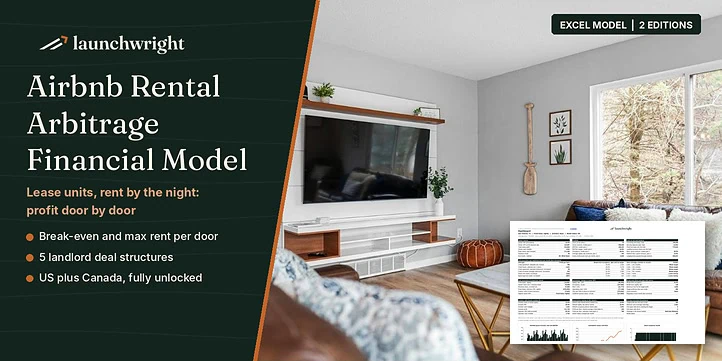
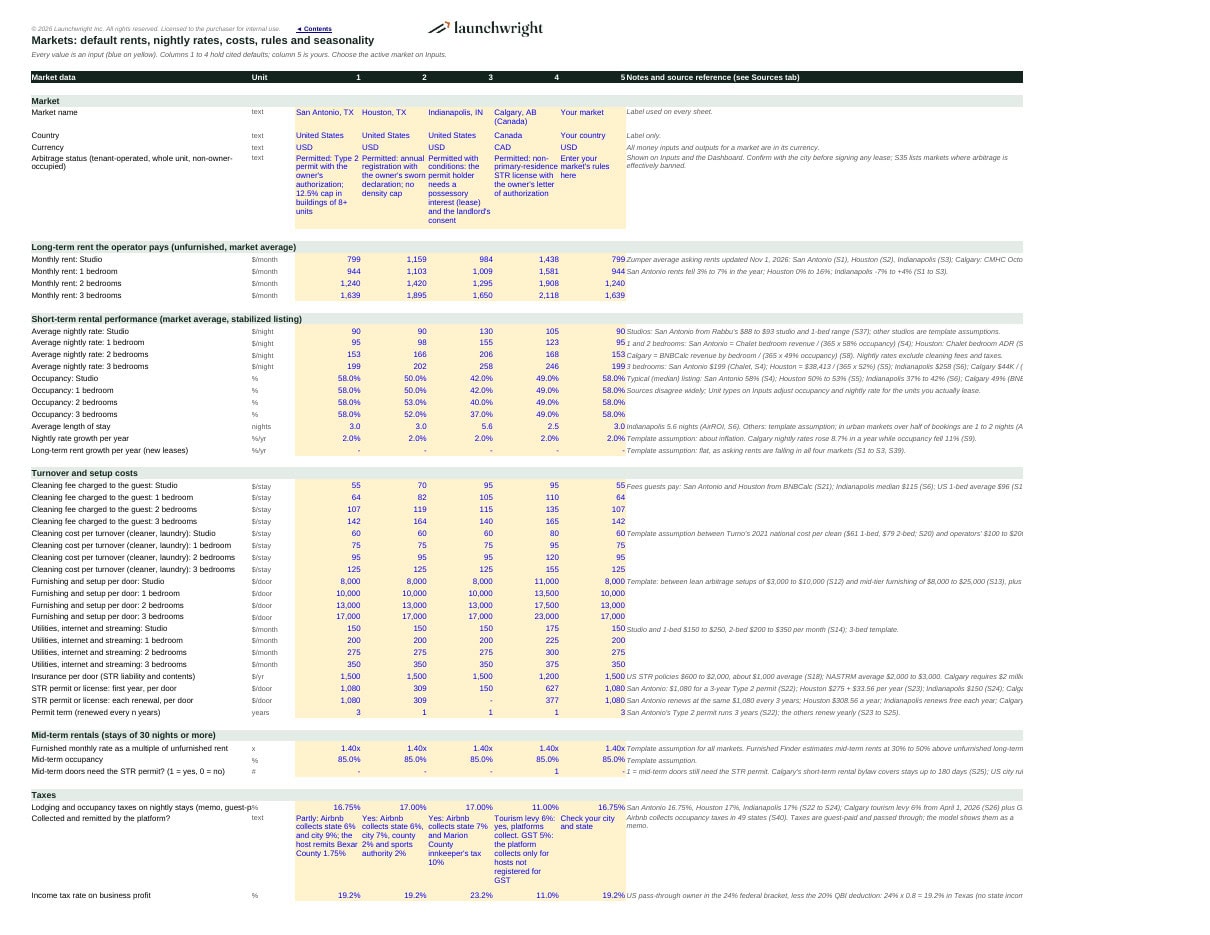
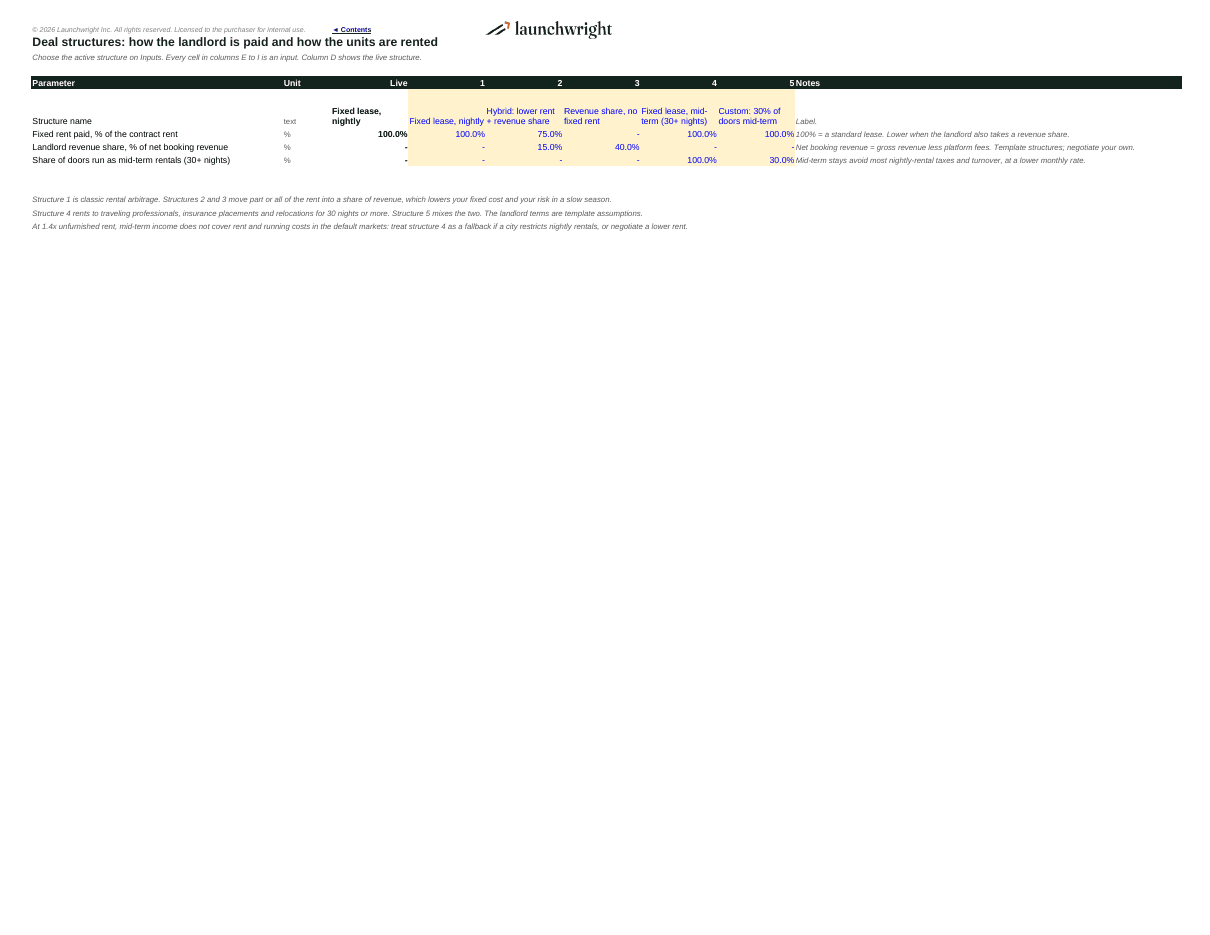
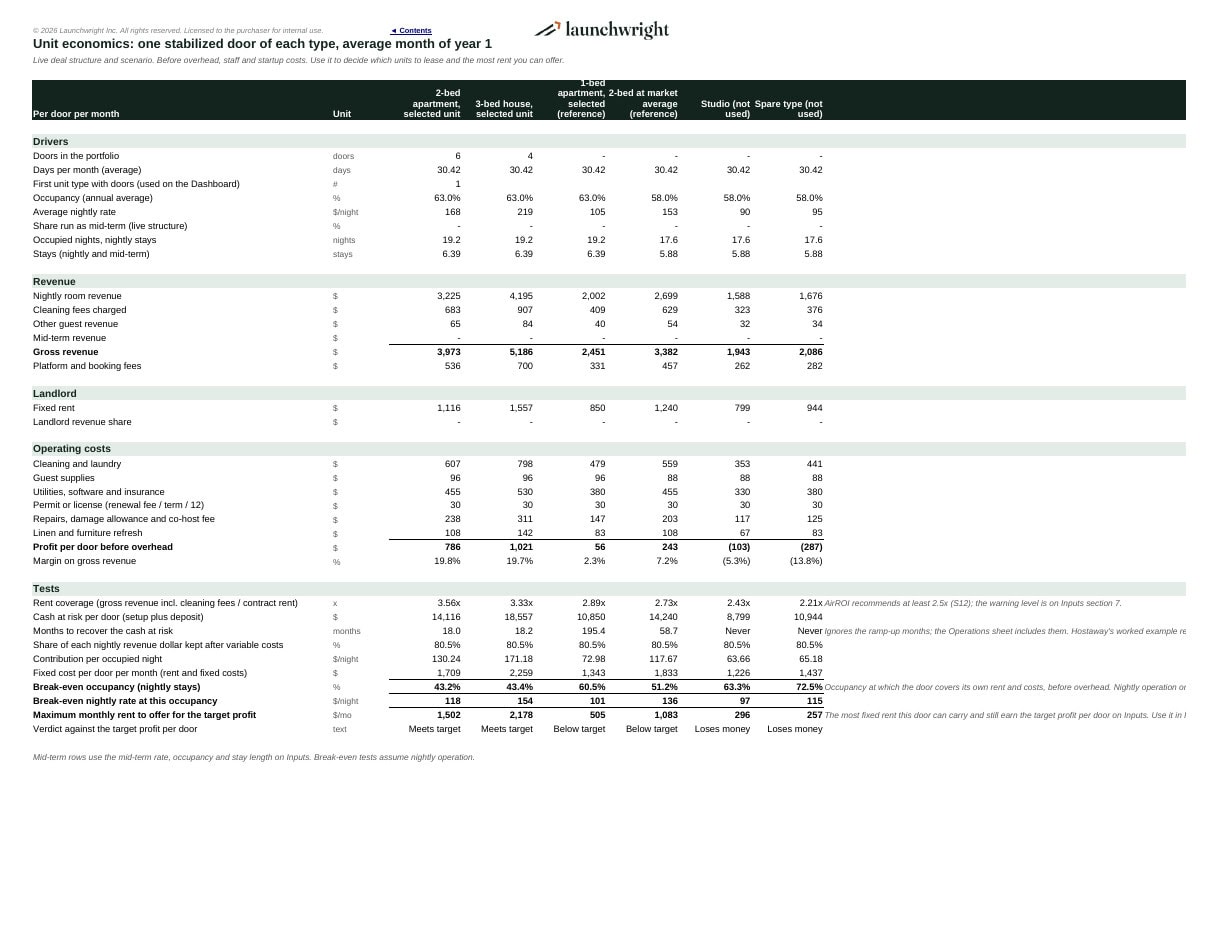
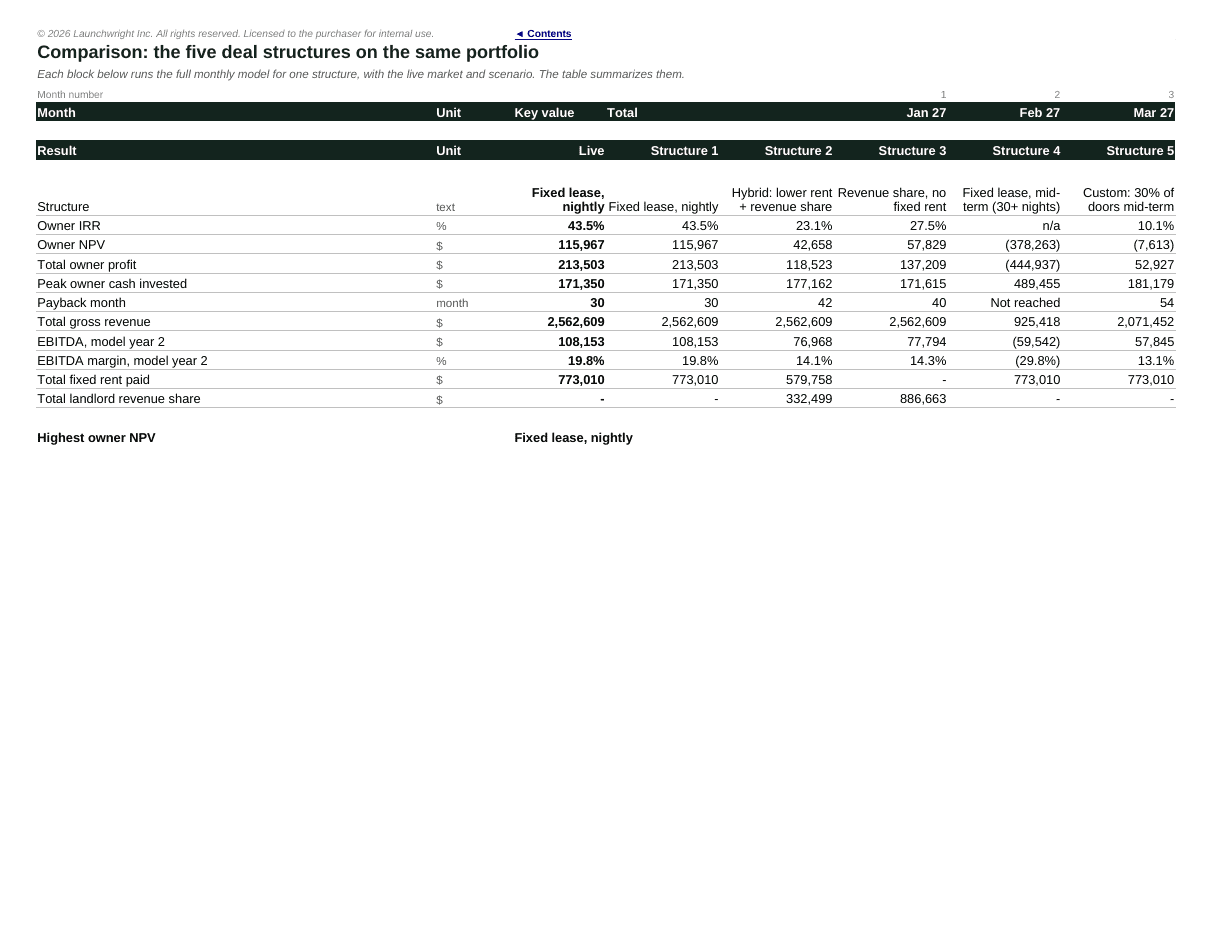
Rental arbitrage looks simple: lease an apartment, furnish it, list it on Airbnb and keep the difference. In most cities the difference is thin. AirROI’s 2026 analysis finds most urban markets fall below 2.0 times revenue to rent, while it recommends at least 2.5 times to cover platform fees, cleaning, utilities, furnishing and slow months. This Excel model tells you, door by door and month by month, whether a portfolio of leased units pays, which units to lease, how much rent you can offer a landlord, and what happens when rates, occupancy or the city’s rules change.
Why this model
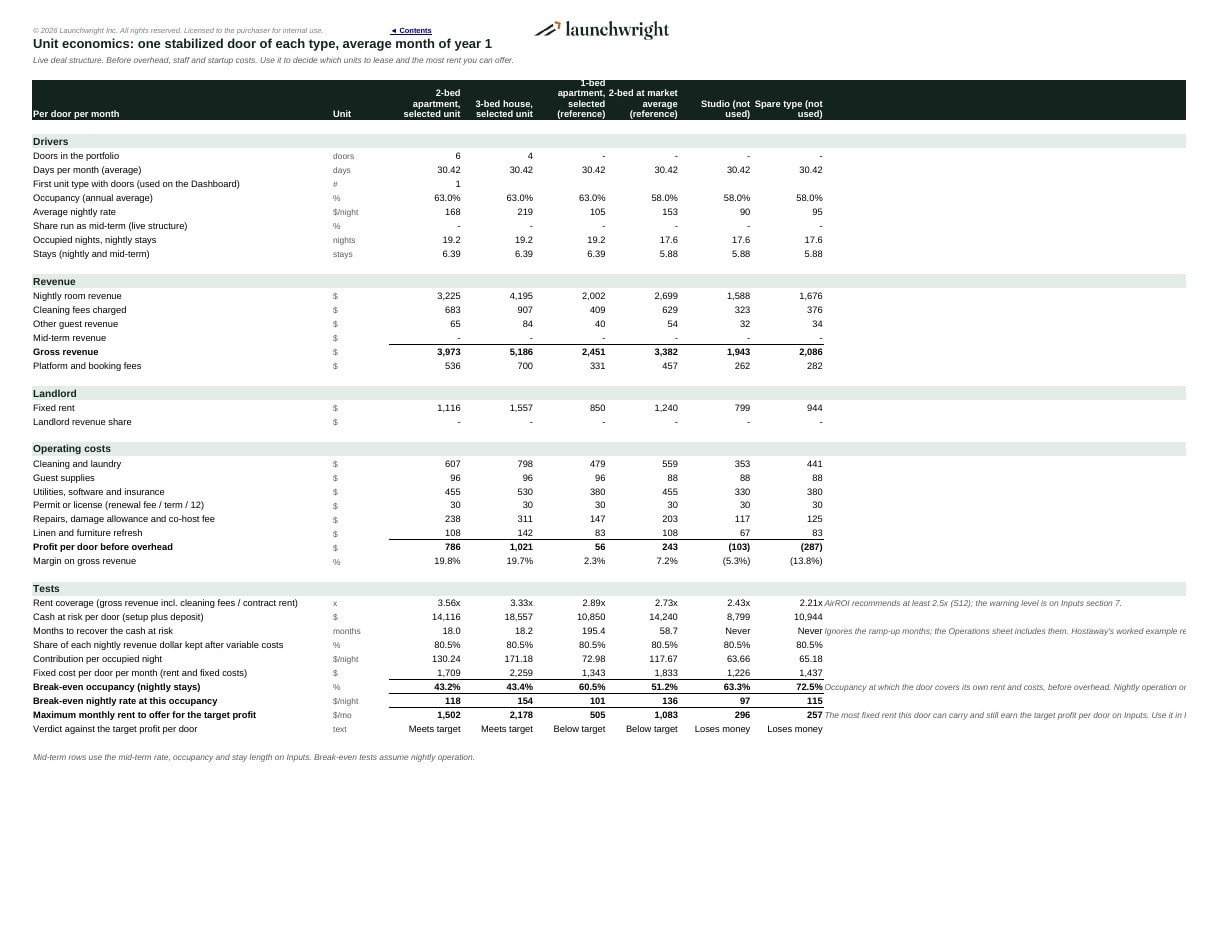
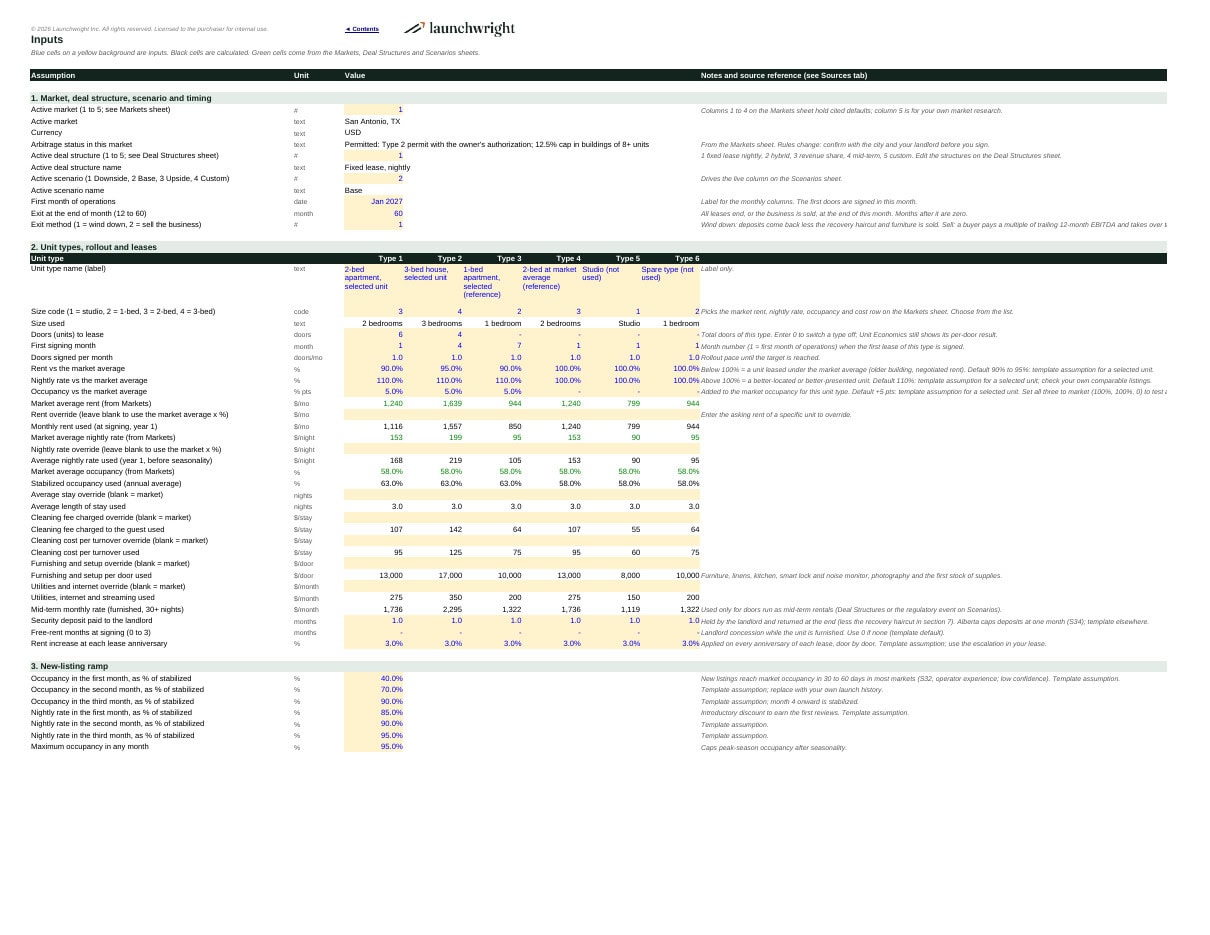
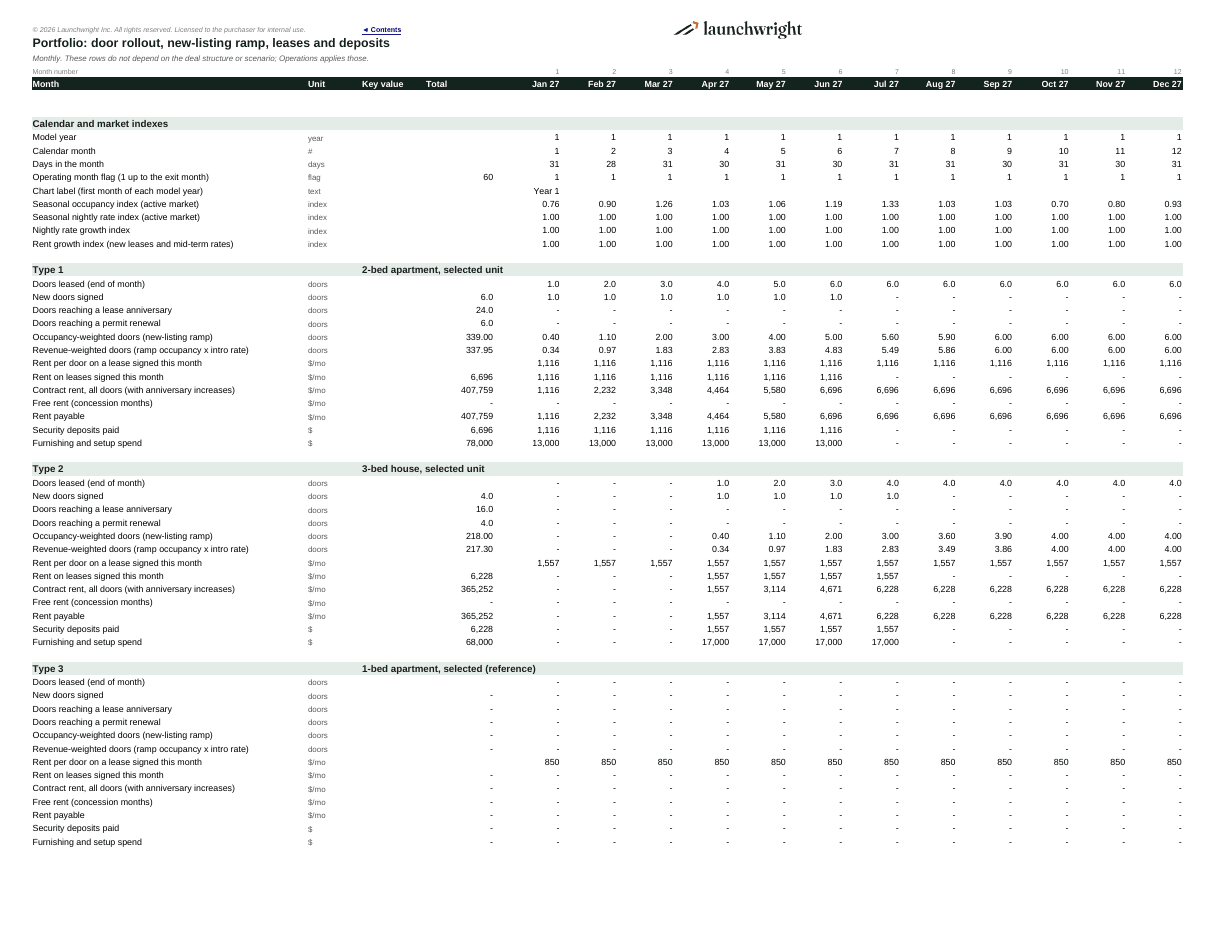
It models the business as an operator runs it: a portfolio of up to six unit types signed door by door, each new listing ramping up over its first three months, every lease rising on its own anniversary, deposits held by landlords and returned at the end, and the owner funding the cash gaps. Six unit-type groups take any number of doors each, with their own signing month, pace, rent and nightly rate. Unit Economics shows each door’s monthly profit, break-even occupancy, break-even nightly rate and the maximum rent it can carry for your target profit, so you can negotiate before you sign. Every default is a published market figure or a rule, cited on a Sources tab, or labelled a template assumption.
Lease and landlord mechanics
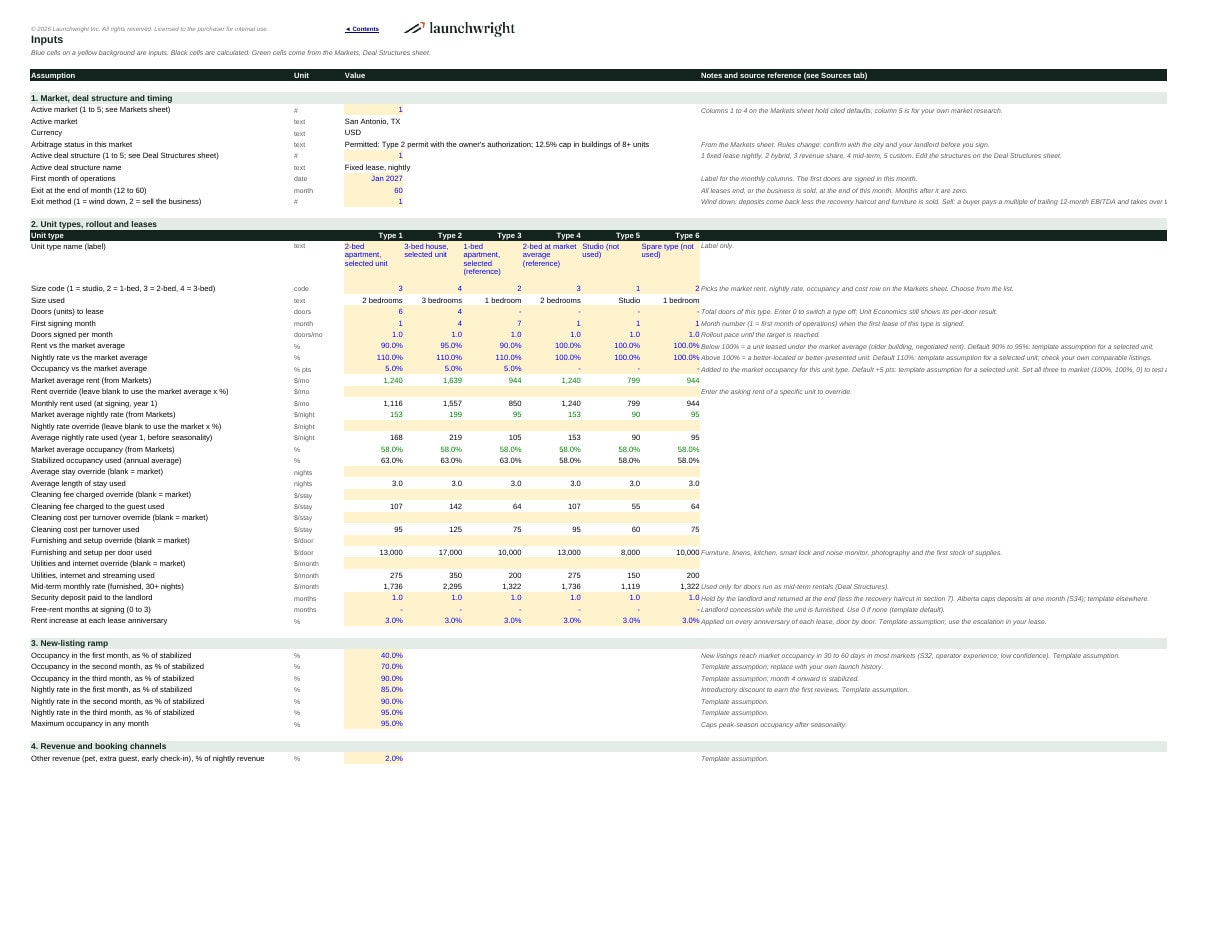
- Rent per door at signing (market average x your negotiated %, or a specific asking rent), growing with market rents for later leases
- Rent increases at each lease anniversary, door by door; free-rent months while the unit is furnished; security deposits in months of rent
- Five deal structures: fixed lease, hybrid (lower rent plus a revenue share), revenue share only, mid-term rentals (30+ nights) and a custom mix
- Exit by winding down (deposits back less a haircut, furniture sold) or selling the business at a multiple of trailing 12-month EBITDA
Revenue and costs
- Nightly rate and occupancy by bedroom count from market data, adjusted for the units you actually lease; seasonality by month; annual rate growth
- New-listing ramp: occupancy and introductory pricing in the first three months
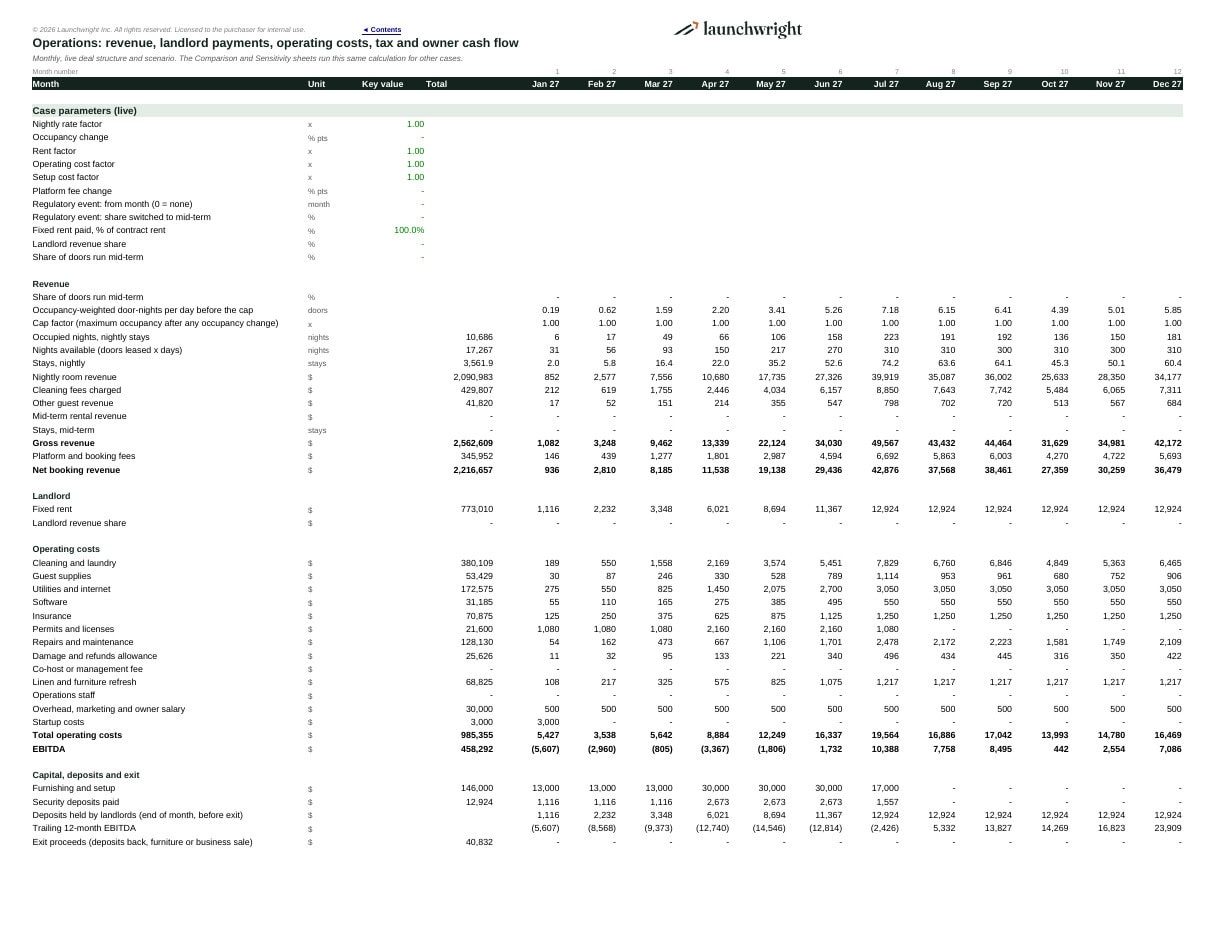
- Stays from the average length of stay: cleaning fees charged, cleaner cost per turnover and guest supplies per stay
- Platform fees by channel: Airbnb’s 15.5% host-only fee, Vrbo’s 8% and direct bookings
- Utilities, software, insurance and STR permits per door; repairs, damage allowance and co-host fees as % of revenue; refresh, staff steps and overhead
- Lodging and occupancy taxes shown as a pass-through memo for cash planning
Markets included
San Antonio (default), Houston and Indianapolis, where a tenant can legally run whole-unit short-term rentals with the owner’s consent, plus Calgary as the Canadian option and a blank column for your own market. Each market carries rents by bedroom, nightly rates and occupancy, cleaning fees, permits, lodging taxes, seasonality, insurance and tax settings. The Sources sheet also lists markets where arbitrage is effectively banned (most of British Columbia, Toronto, Kansas City, Nashville, Orlando, Tampa, Chicago, Dallas and New York City).
Tax
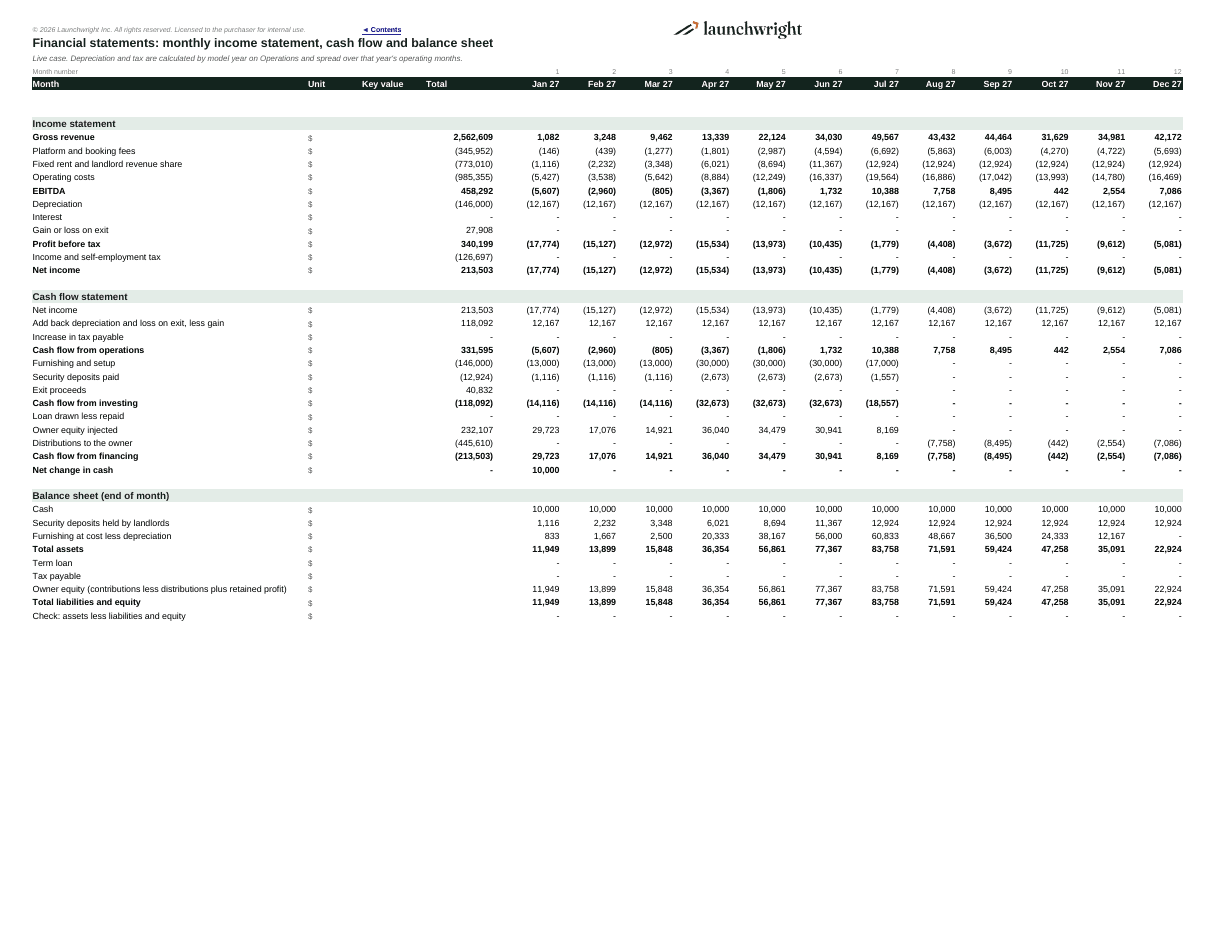
- US pass-through owner by default: income tax after the QBI deduction (no state income tax in Texas) plus self-employment tax, with 100% bonus depreciation on furnishing
- Canada: corporate small business rate and Class 8 capital cost allowance with the accelerated first-year rate
- Losses carried forward; recapture or terminal loss on wind-down; tax on a gain from selling the business
Two editions
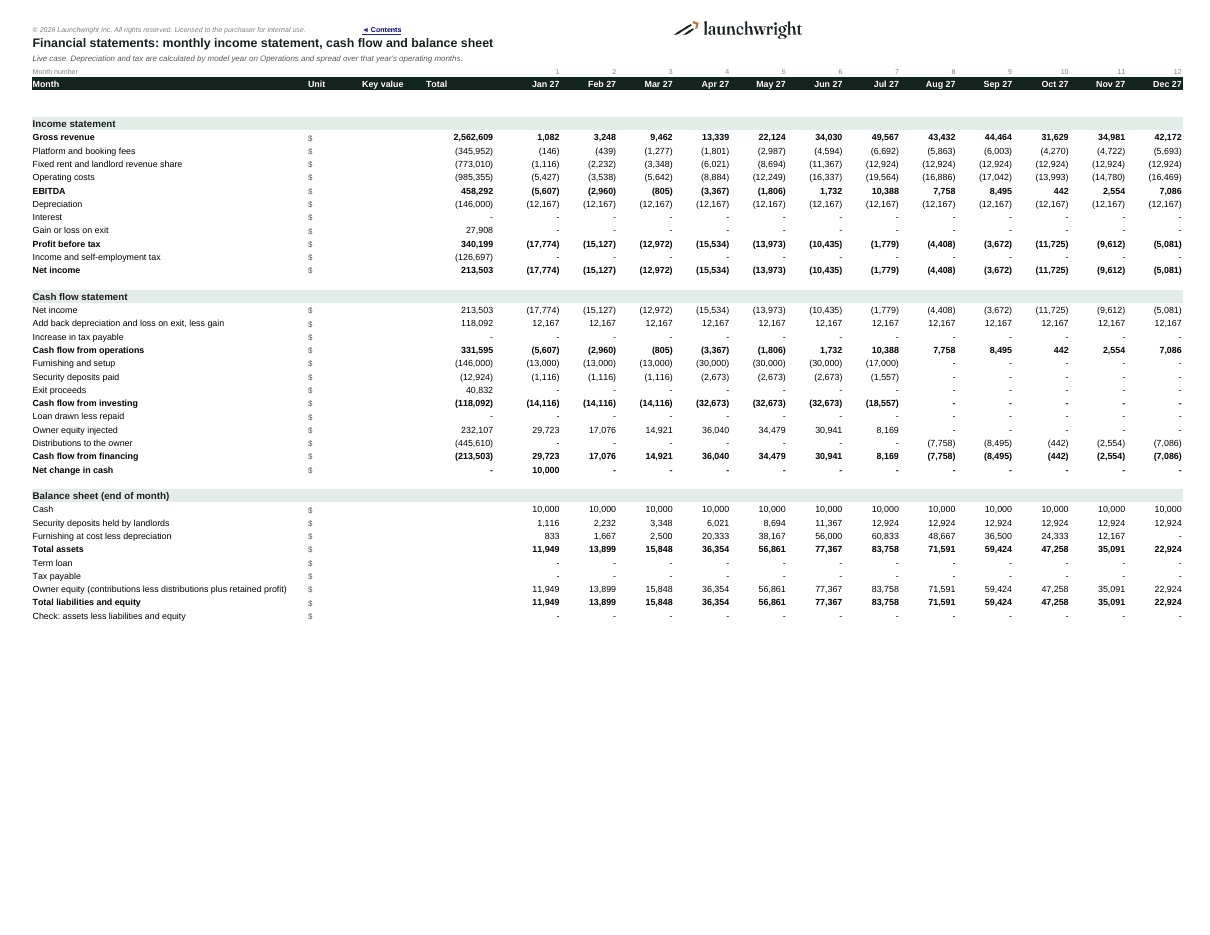
- Feasibility Edition: 60 monthly periods, up to six unit types and five markets, the full lease, ramp, revenue, cost, tax and cash logic, the five deal structures (one at a time), Unit Economics with break-evens and maximum rent, monthly income statement, cash flow and balance sheet, an annual summary, owner IRR, NPV, cash multiple and payback, a dashboard and integrity checks.
- Due Diligence Edition: everything in the Feasibility Edition, plus:
- all five deal structures run side by side on the same portfolio and ranked by owner NPV
- four editable market scenarios (Downside, Base, Upside, Custom), including a city rule change that forces doors to 30+ night stays
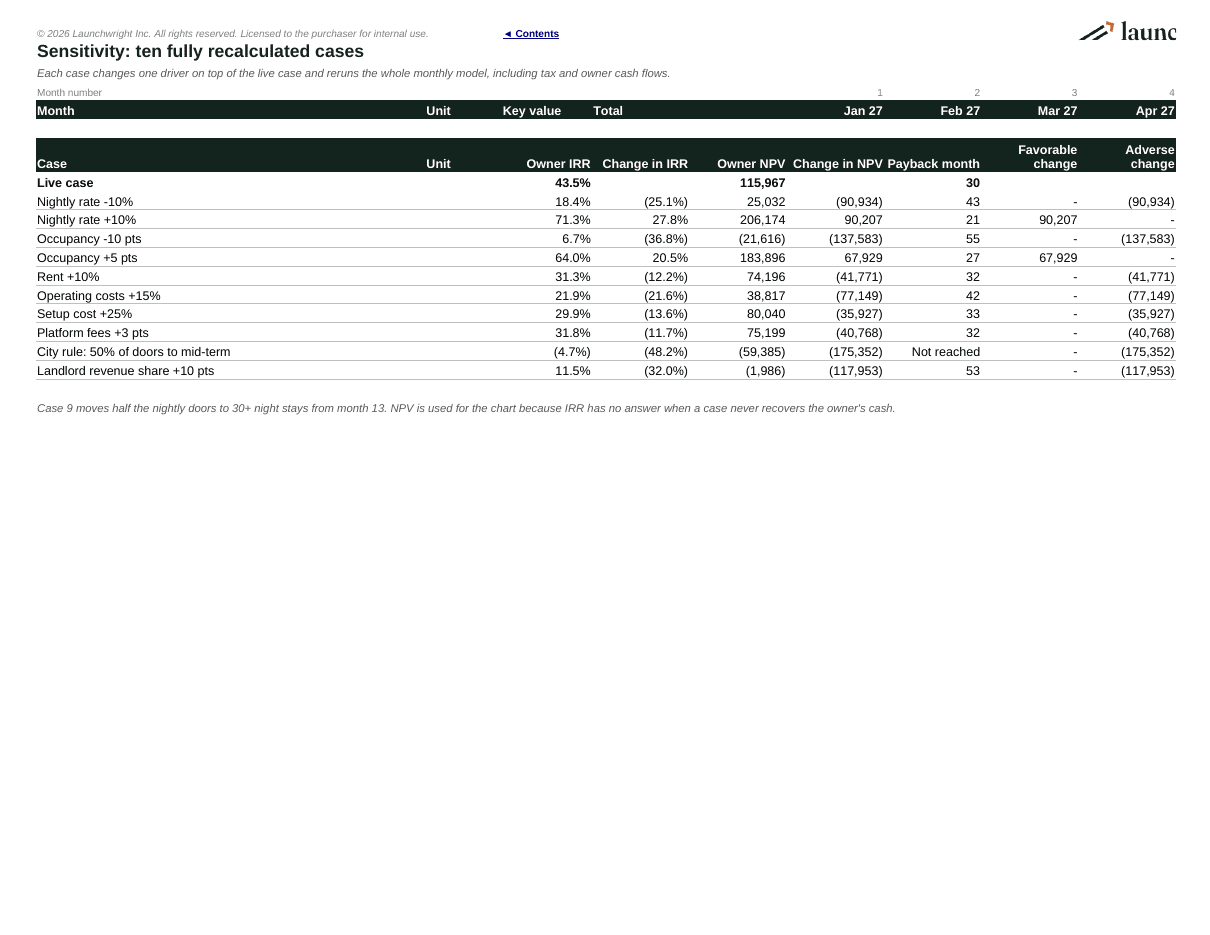
- ten live sensitivity cases, each a full monthly rerun after tax, with a tornado chart
- an investor split: an outside investor’s share of the equity, a compounding preferred return and a profit split, with investor and operator IRR
Key outputs
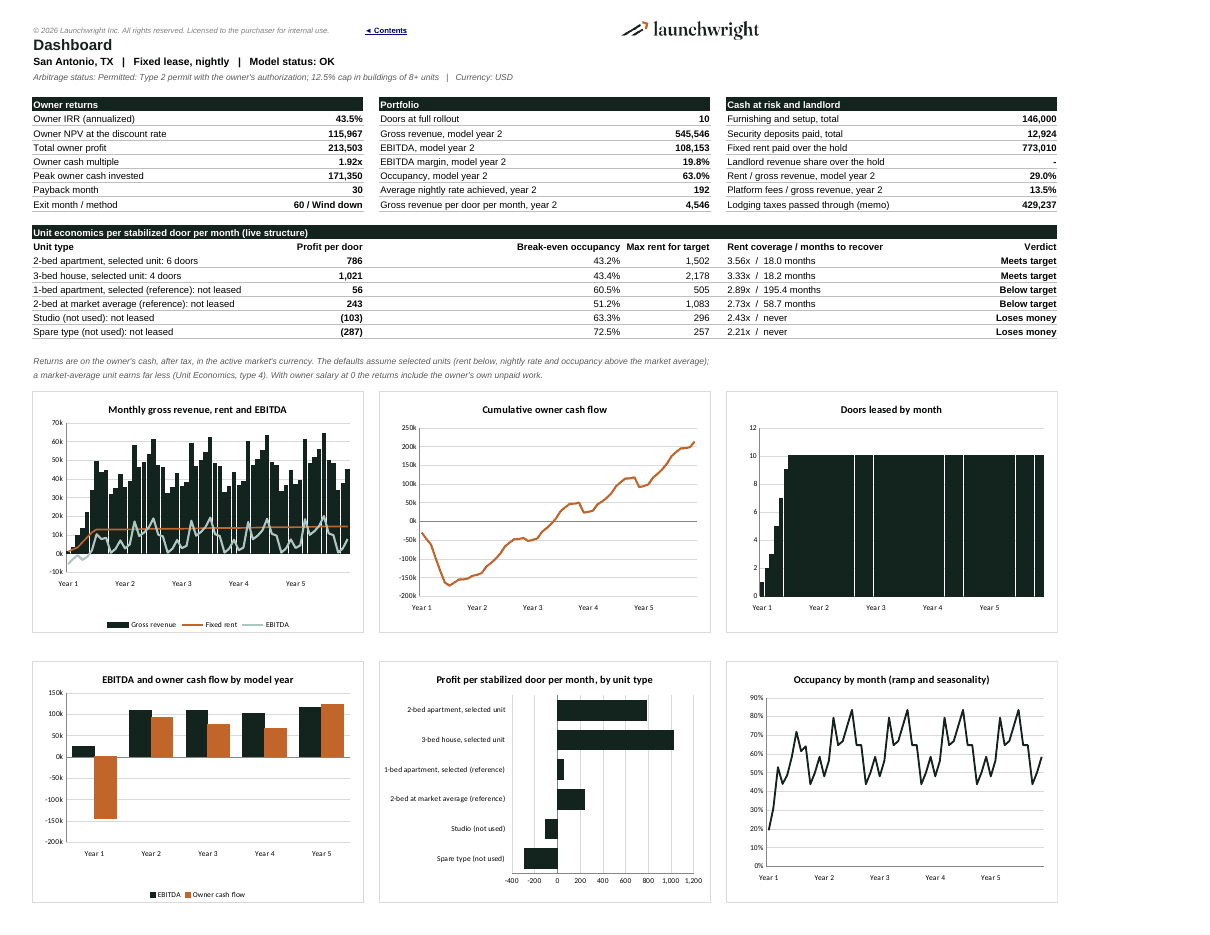
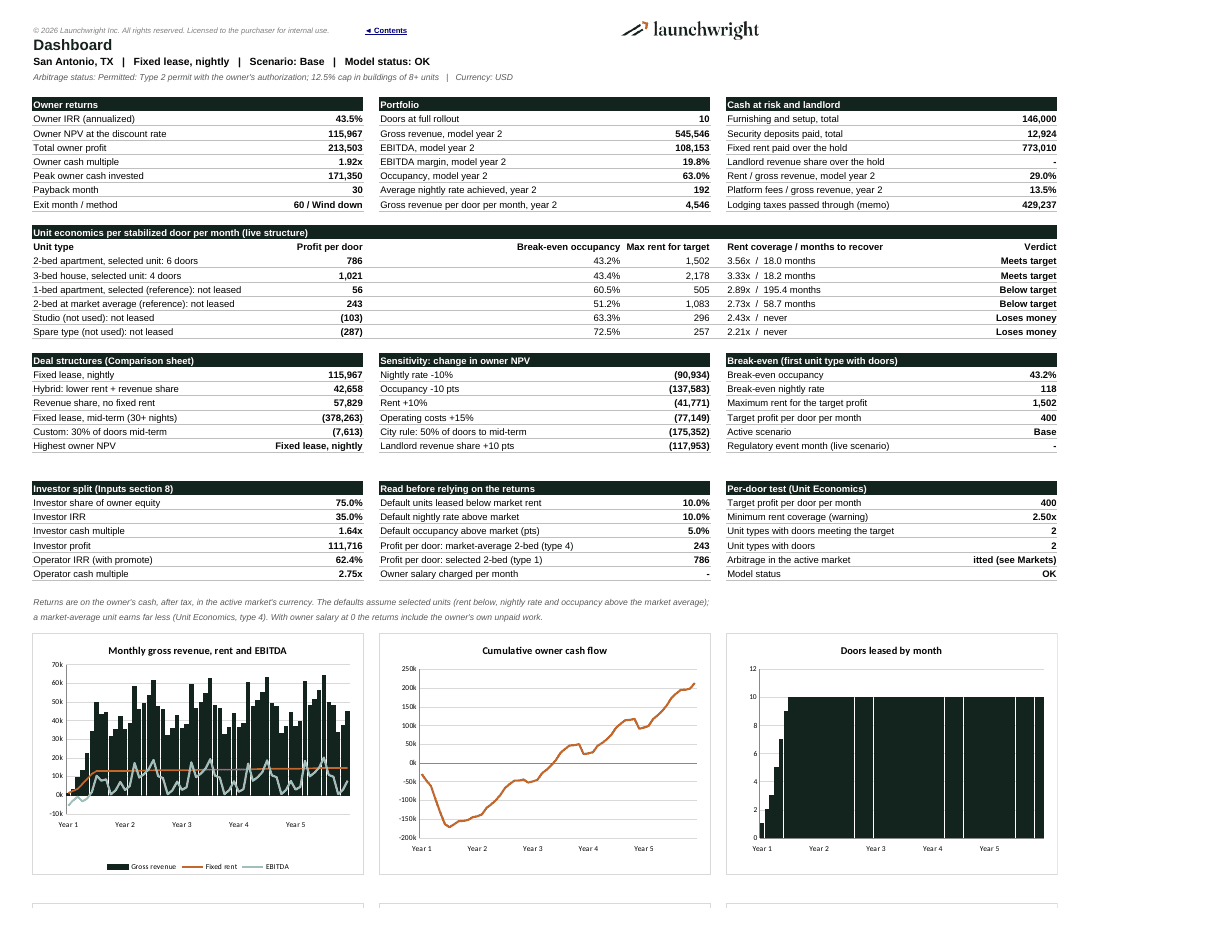
- Owner IRR, NPV, total profit, cash multiple, peak cash invested and payback month, after tax; in Due Diligence, investor and operator IRR
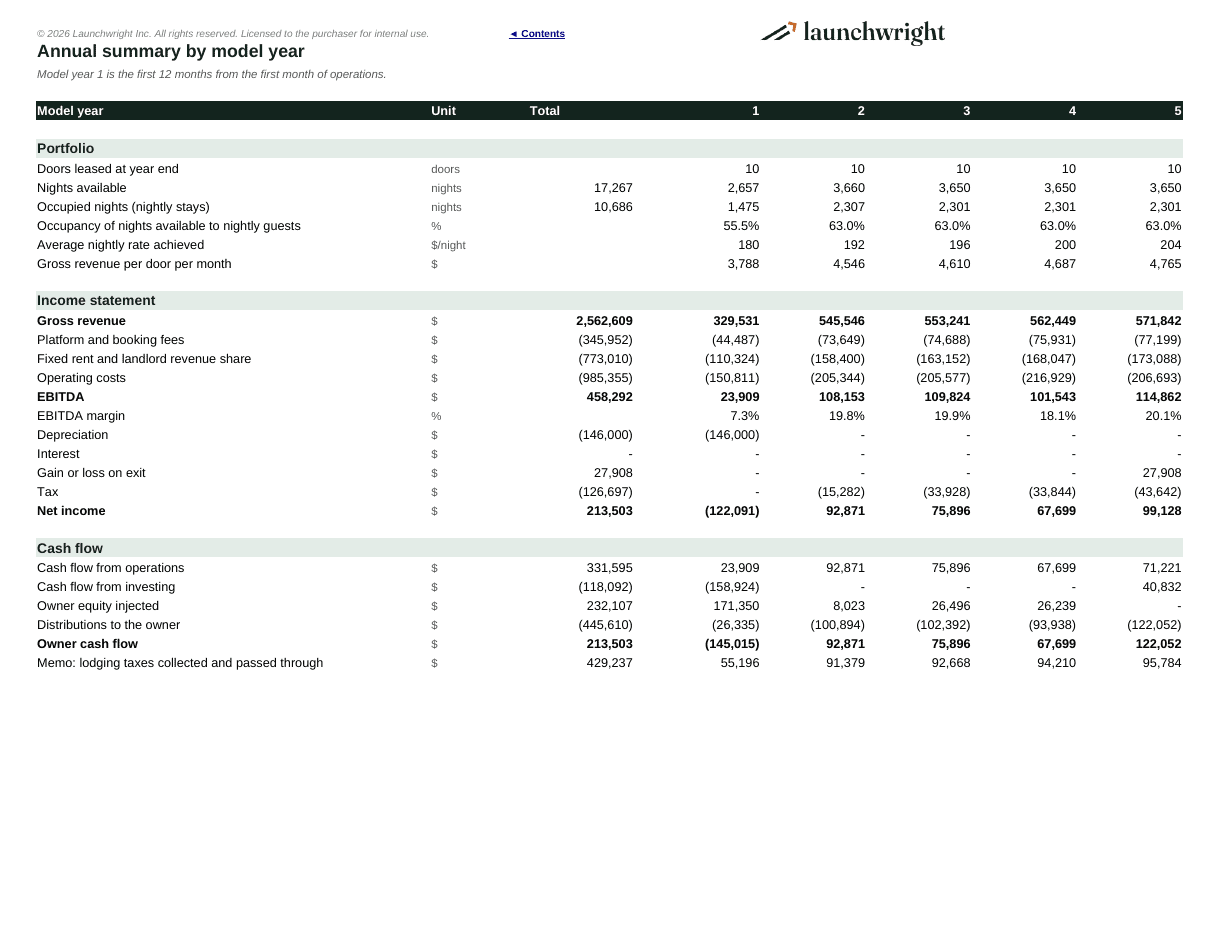
- Gross revenue, EBITDA and margin by year; occupancy, average nightly rate and revenue per door
- Per-door profit, rent coverage, cash at risk, months to recover, break-even occupancy and nightly rate, and the maximum rent for your target profit
- Dashboard charts: monthly revenue, rent and EBITDA; cumulative owner cash; doors leased; profit per door by type; and, in Due Diligence, NPV by deal structure and the sensitivity tornado
Built to modeling best practice
- Inputs, calculations and outputs on separate sheets; color-coded inputs (blue on yellow), formulas (black) and links from Markets, Deal Structures and Scenarios (green)
- One formula per row across 60 monthly columns; one calculation engine reused by the Comparison and Sensitivity sheets, so every case is consistent
- No macros, no circular references, no hidden or protected sheets, no external links; built with functions available since Excel 2010
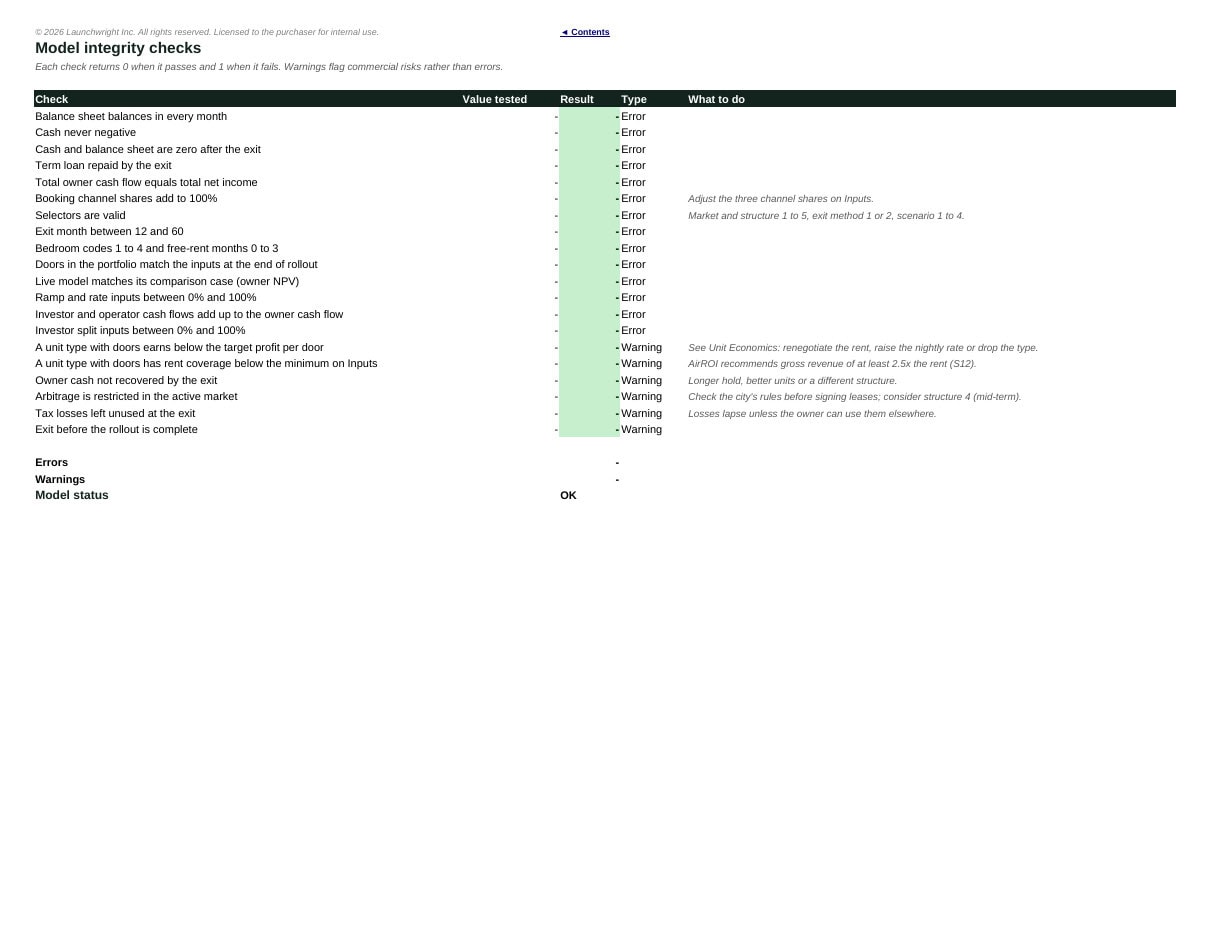
- Checks sheet confirms the balance sheet balances every month, cash never goes negative, the loan is repaid, owner cash equals net income over the hold and the live model matches its comparison case, and warns on doors below your target profit or the minimum rent coverage (2.5x by default), unrecovered cash and restricted markets
Default assumptions
Defaults describe a 10-door San Antonio portfolio: six 2-bedroom apartments and four 3-bedroom houses signed one a month from January 2027, leased 10% and 5% below Zumper’s November 2026 average rents and run 10% above the typical listing’s nightly rate and 5 points above its 58% occupancy (Chalet, 12 months to September 2026). The market-average 2-bedroom is included at zero doors for comparison. A selected 2-bedroom earns $786 a month before overhead against $243 for a market-average one; it breaks even at 43.2% occupancy and can carry rent of up to $1,502 for a $400 monthly profit. Run with market-average units instead, the same portfolio returns -3.0% and never pays back: unit selection is the business, and the model shows it door by door. On the fixed-lease structure, year-2 gross revenue is $545,546, EBITDA $108,153 (19.8% margin), and the owner invests up to $171,350 for an after-tax IRR of 43.5% and payback in month 30 over five years. The returns are sensitive: occupancy 10 points lower cuts the owner’s NPV by $137,583, and a city rule moving half the doors to 30+ night stays from month 13 cuts it by $175,352. Replace the defaults with your own comparable listings, lease quotes and cleaner and insurance quotes.
Compare the editions
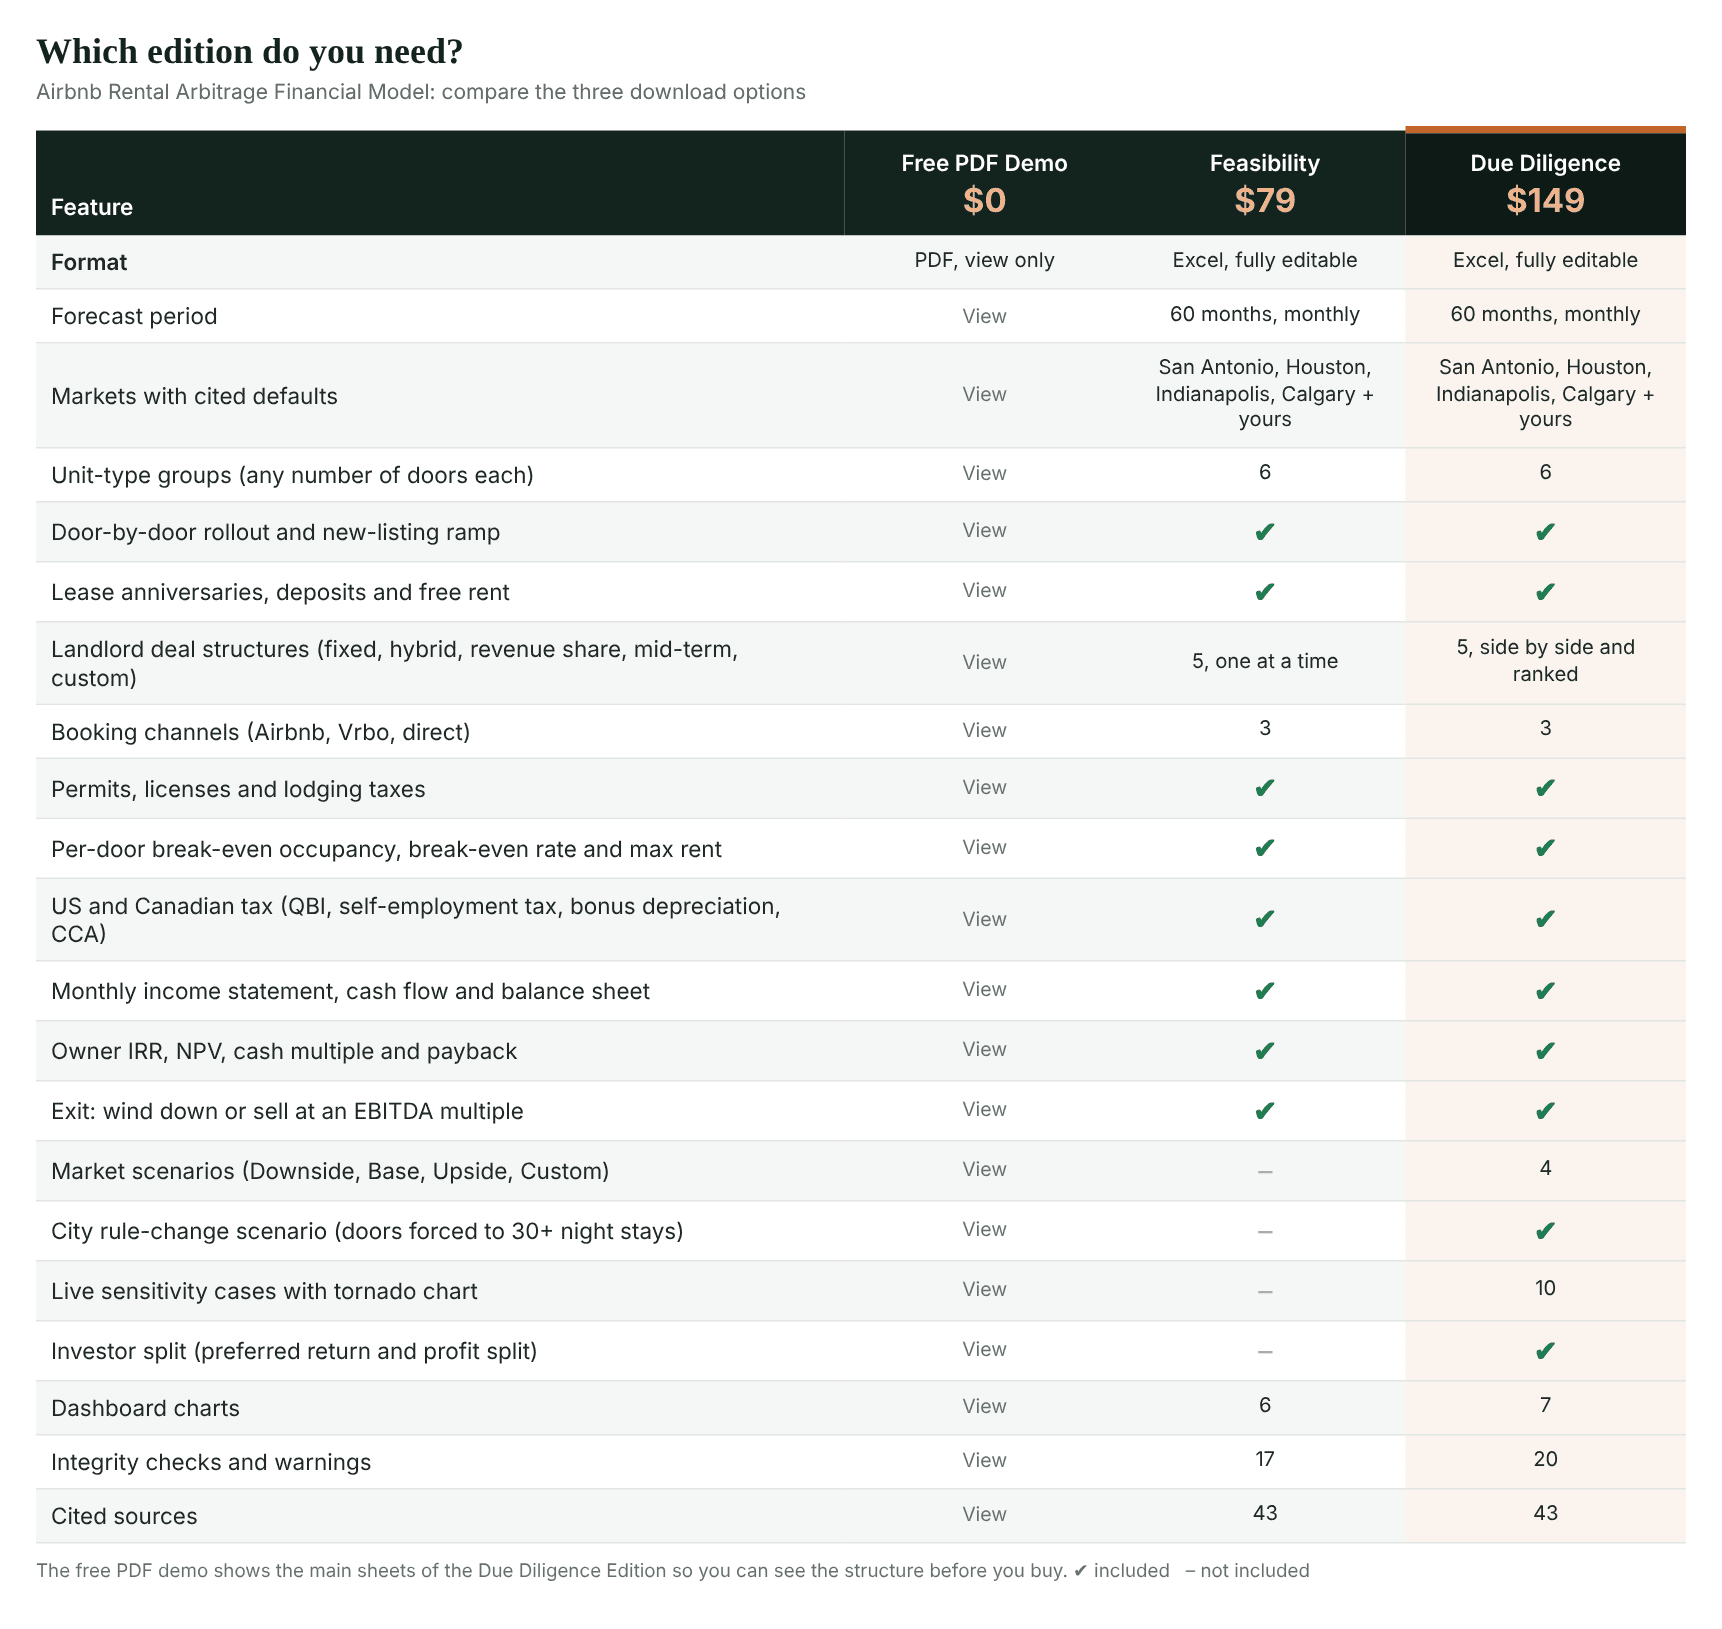
The free PDF demo, the Feasibility Edition ($79) and the Due Diligence Edition ($149) side by side:
What you get
- One Excel workbook (.xlsx) for the edition purchased, built only with functions available since Excel 2010 (no dynamic arrays, no macros)
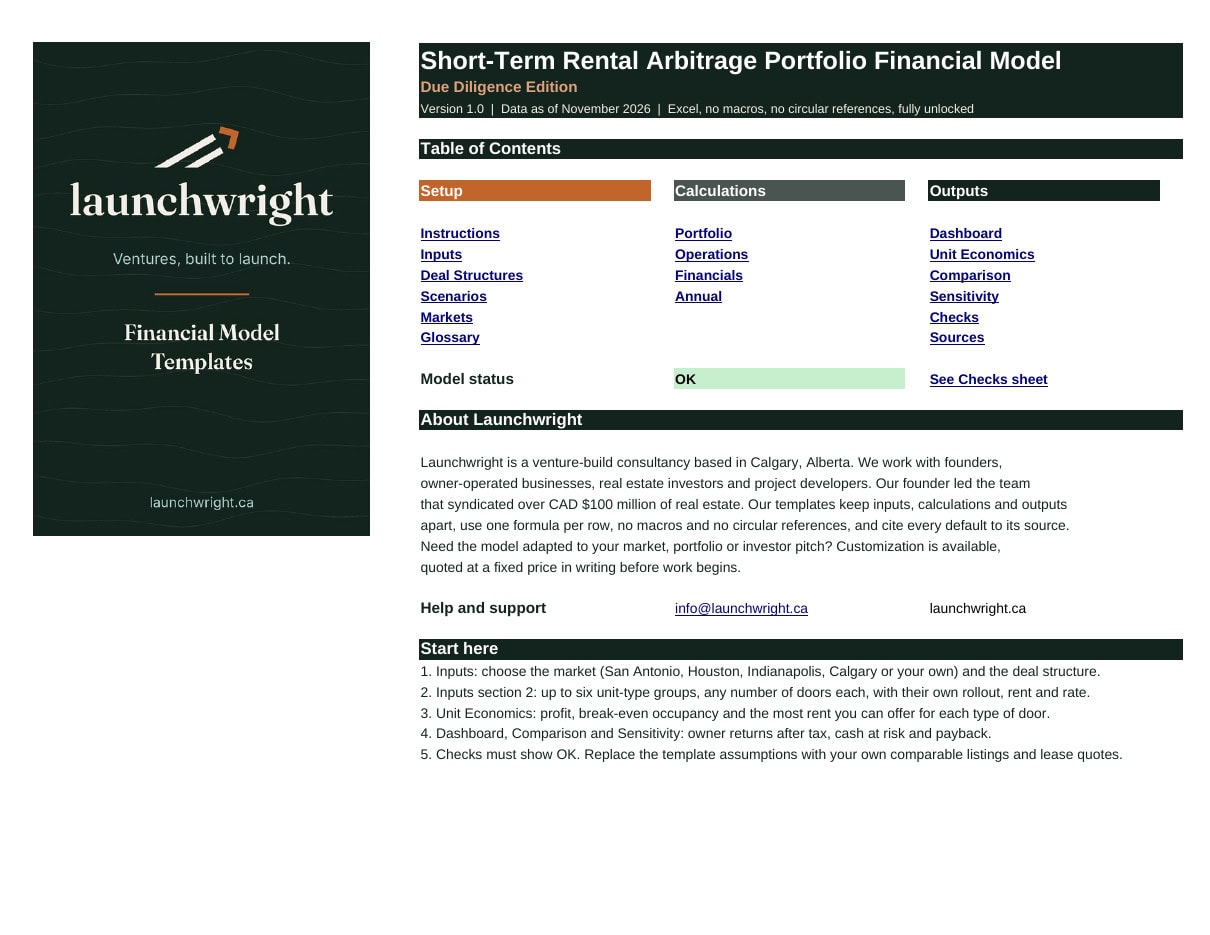
- A free PDF demo showing the main sheets of the Due Diligence Edition
Support and customization
Questions about how the template works are answered by email. Launchwright can also adapt the model to your market, portfolio or investor pitch, quoted at a fixed price in writing before work begins. Contact details are inside the model.
Important
This template is for planning and illustration. Short-term rental rules change often and differ by city, building and lease; the market data and rules in this version are mostly as published in 2025 and 2026. It is not investment, tax, legal or real estate advice. Confirm the rules with the city, your landlord’s written consent and your accountant before signing any lease.
Similar ProductsOther customers were also interested in...



 eFinancialModels
Electric Vehicle (EV) Charging Station Financial M...
With this comprehensive 5- or 10-year monthly tool, investors can assess the viability of setting up... Read more

Financial Model for Mobile App | Mobile App Busine...
The Mobile App Financial Plan Template in Excel allows you to develop financial projections when lau... Read more

 HenrySheykin
Food Truck Financial Model Excel Template
The Food Truck Financial Model helps entrepreneurs, founders, business owners, consultants, and anal... Read more

Green Hydrogen Production from Wind Energy Financi...
The Green Hydrogen from Wind Financial Model aims to comprehensively forecast a horizon of 40 years ... Read more

Simple Mutual Non-Disclosure Agreement Template
Protect your business secrets with ease using our Simple Mutual Non-Disclosure Agreement Template. S... Read more

Solar Energy Financial Model
The Solar Energy Financial Model Spreadsheet Template in Excel assists you in preparing a sophistica... Read more

 Peter Graf
The Customer-Centric Financial Model for Restauran...
Starting a restaurant without a financial plan is like driving a car blindfolded. You wouldn´t do i... Read more
You must log in to submit a review.