0 ITEMS

How to Check if a Franchise’s Numbers Are Realistic

A franchise’s numbers are realistic when the Item 19 earnings claim rests on disclosed outlet counts, still holds after the average is swapped for the median, and repays the investment within an acceptable payback period in a downside case. The sections below audit the disclosure, rebuild the unit economics from published benchmarks, and run a worked franchise payback example.
Key Takeaways
- Under the FTC Franchise Rule, earnings claims belong in Item 19, so earnings promises made elsewhere are a warning sign.
- Compare the average with the median and read how many outlets reached the stated result before trusting any headline figure.
- Rebuild the unit profit and loss from benchmarks for royalties, food, labor and occupancy, then question every gap the franchisor cannot explain.
- In the illustrative, pre-tax, unlevered restaurant example, payback runs 2.9 years on the Item 19 claim against 4.9 years on the base case.
- Run claim, base and downside cases, because the illustrative downside payback of 8.8 years was about three times the claim-case 2.9 years.
What Item 19 Discloses and What It Leaves Out
Item 19 is the section of the Franchise Disclosure Document (FDD), the legal document every prospect must receive, that holds financial performance representations: statements of actual or potential sales, income or profit. This regime is a United States rule, so buyers elsewhere should ask a local franchise lawyer which disclosure rules apply. Under the Franchise Rule of the Federal Trade Commission (FTC), a franchisor that makes a financial performance claim must state it in Item 19 of the FDD.
In the 2026 Annual Franchise Development Report, a survey of franchise development professionals by Franchise Update Media, 84 percent of all respondents said franchises provide financial performance representations in their FDD.
The rule behind the disclosure sits in the Code of Federal Regulations (CFR) at 16 CFR Part 436 and requires a reasonable basis and written substantiation for any representation. It also requires the franchisor to state the number and percent of outlets that attained or surpassed the stated results.
How to Audit an Item 19 Disclosure
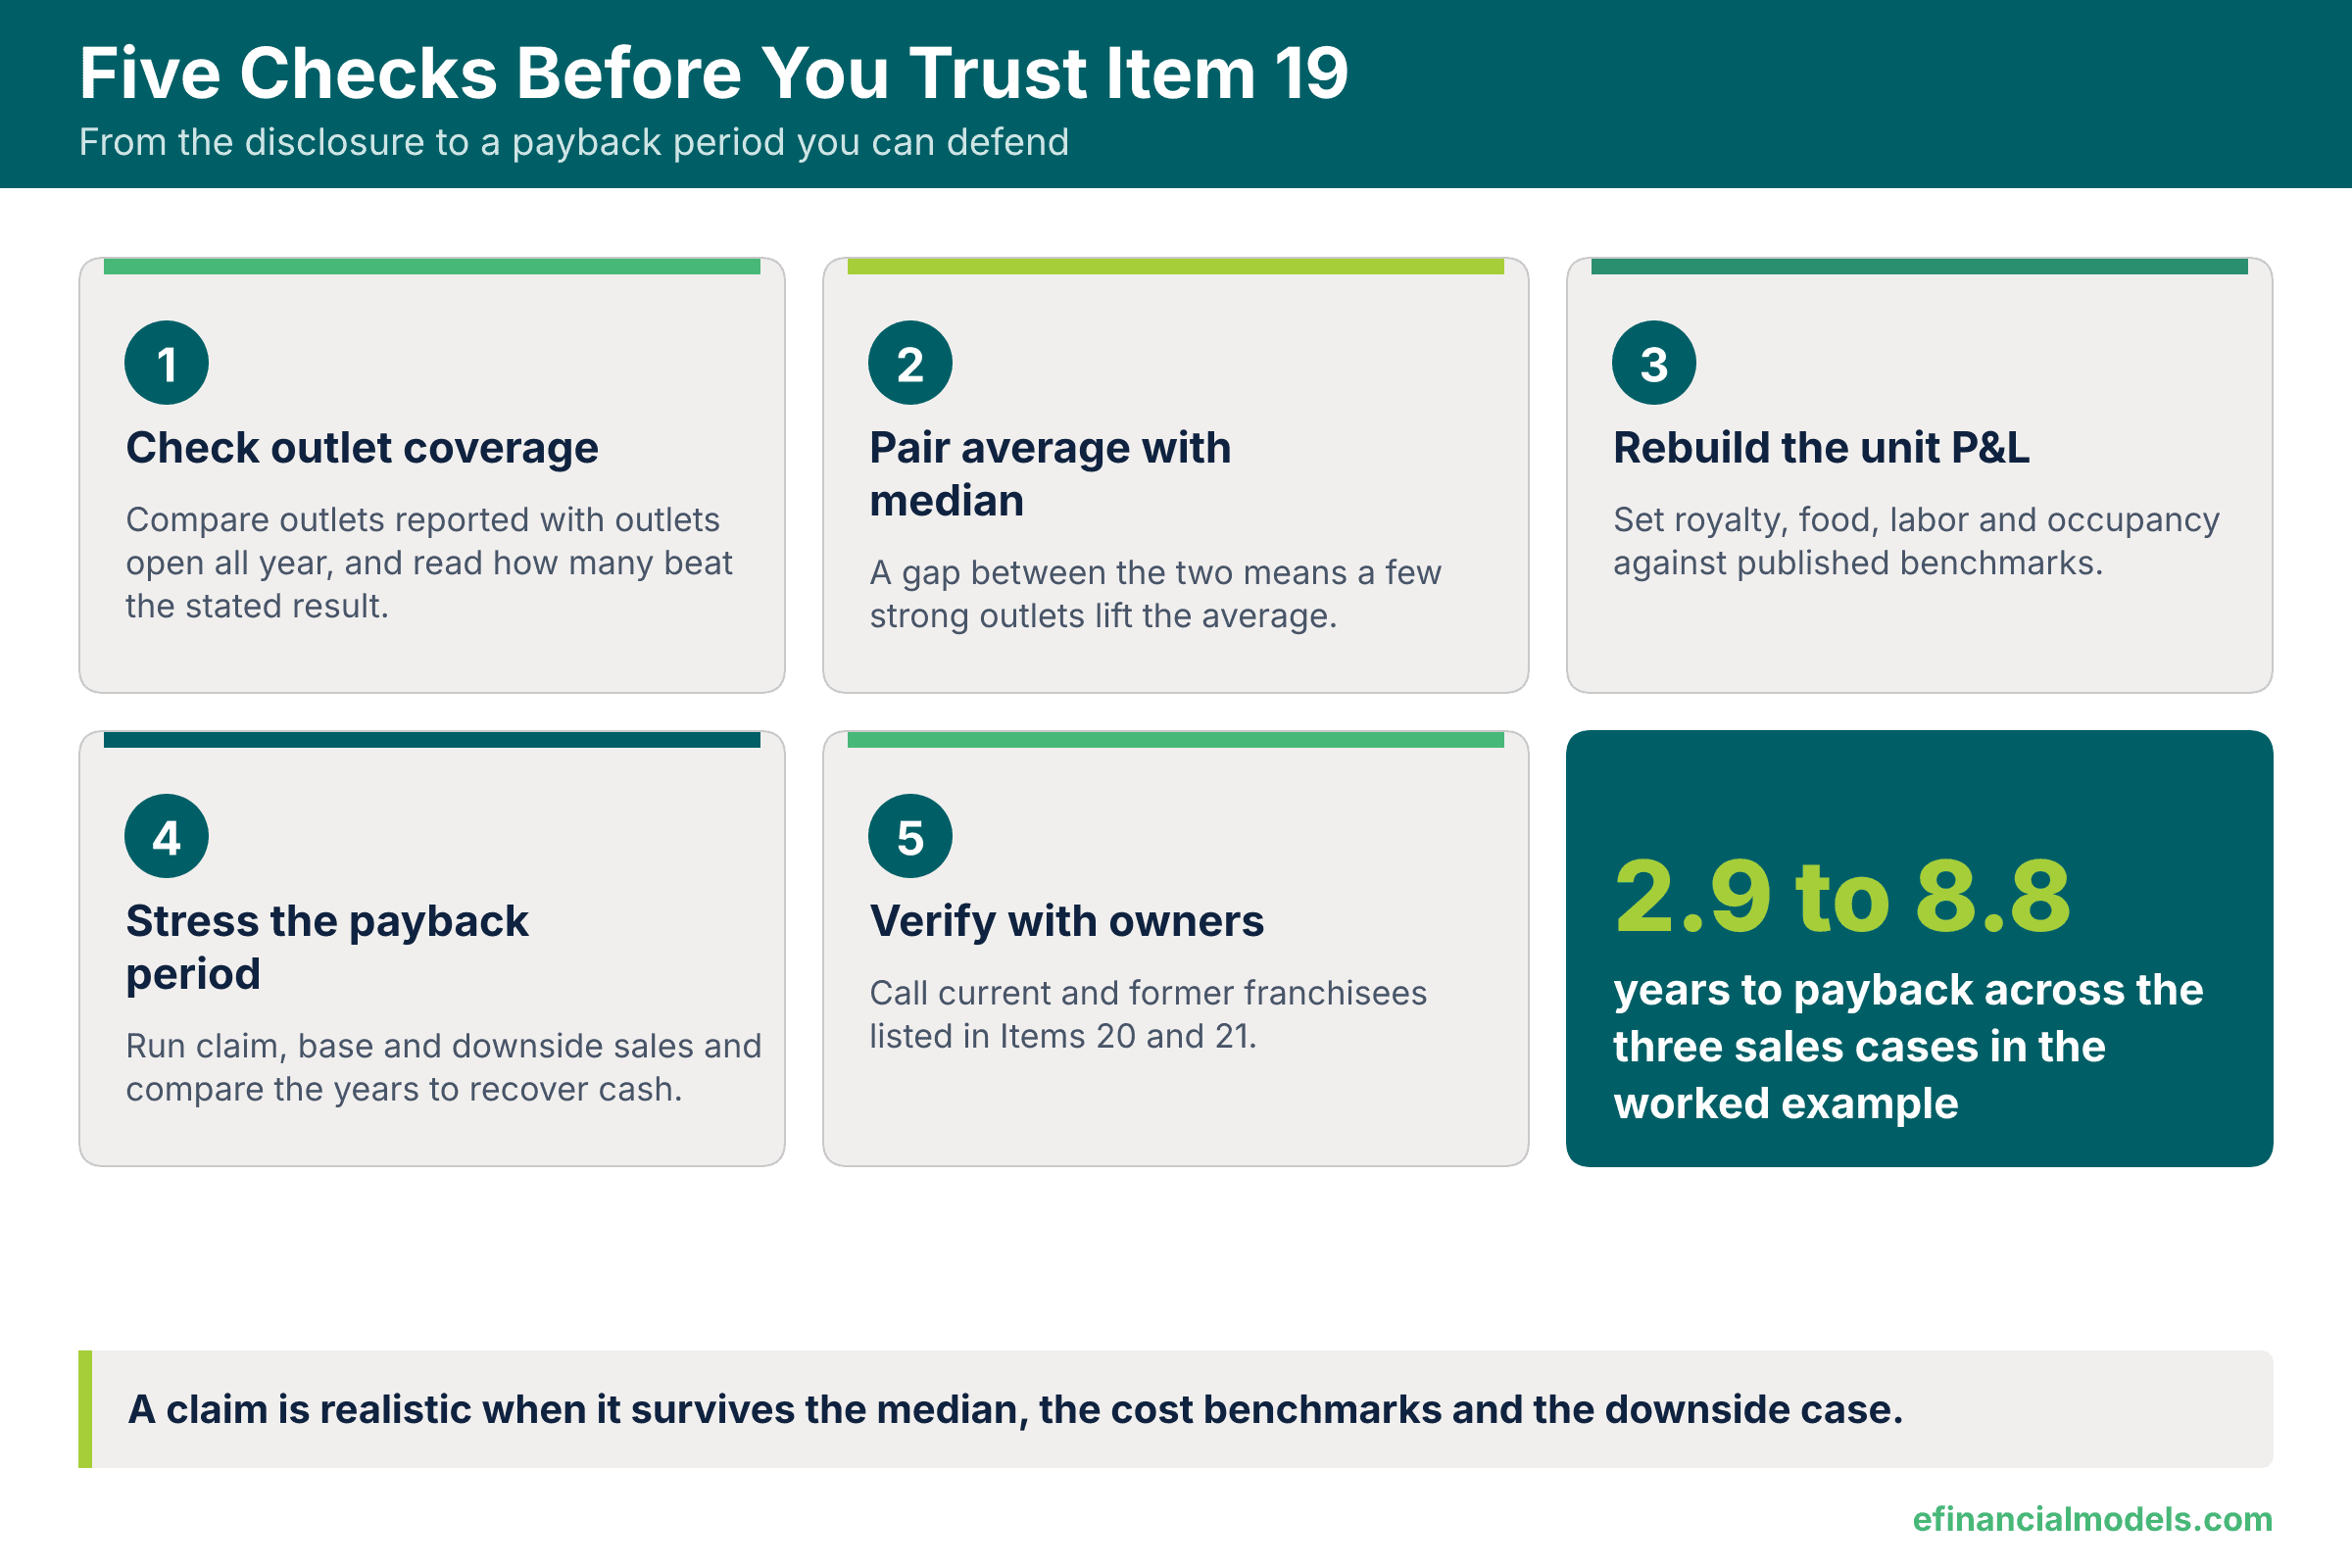
An audit asks five questions, all answerable from the FDD before any money moves.
- Coverage. Divide the outlets in the table by the outlets open for the whole period. Any missing group needs an explanation.
- Average against median. An average should be accompanied by the median, because a wide gap between the two means a few strong outlets lift the average.
- Subsets. The same commentary says that results for the best performers, such as the top 10% of outlets, should come with a corresponding disclosure of the worst performers.
- Turnover. Item 20 shows charts of growth and owner turnover, so closures and transfers can be compared with the earnings story.
- Corroboration. The FTC guide says talking to current and former franchisees may be the most reliable way to verify the franchisor’s claims.
Unit Economics Benchmarks That Test the Claim
Item 19 sales turn into a profit claim only after royalties, food, labor and occupancy are subtracted, and published medians give the yardstick for each line. These benchmarks cover limited-service restaurants, so buyers in other sectors should replace them with figures from franchisee interviews or sector associations. A franchise financial model can then apply the yardstick.
According to the National Restaurant Association (NRA), among all limited-service survey respondents in 2024, food and non-alcohol beverage costs were a median 32.4% of sales, salaries and wages including benefits were a median 31.7% and occupancy costs were a median 5.2%.
On the franchisor side, MMCG is a franchise investment research firm, and its 2026 market report states that across 239 percentage-royalty FDDs issued in 2025 and 2026 and registered in Minnesota, the median royalty is 6% of gross sales, with a middle half of 5% to 7%.
Worked Example: Franchise Payback with Item 19 Variance
The payback period is the time a cumulative cash flow needs to repay the initial investment. With uneven cash flows, payback equals the number of full years before recovery plus the amount still unrecovered at the end of that year divided by the cash flow of the following year, which is the recovery year. The example below is an illustrative limited-service restaurant franchise, in United States dollars, before financing, tax, maintenance spending and owner pay. The food, labor, occupancy and royalty rates come from the benchmarks above, and every other input, including the 2% ad fund and 8% other costs (insurance, utilities, repairs and technology), is an assumption.
Investment and Item 19 inputs. The investment totals 520,000: franchise fee 35,000, build-out and equipment 380,000, pre-opening costs 45,000 and a working capital reserve of 60,000. Working capital is the cash held to run daily operations. The Item 19 table shows average sales of 900,000, median sales of 840,000, and 96 of 120 open outlets reporting, of which 40 (41.7%) reached or beat the average.
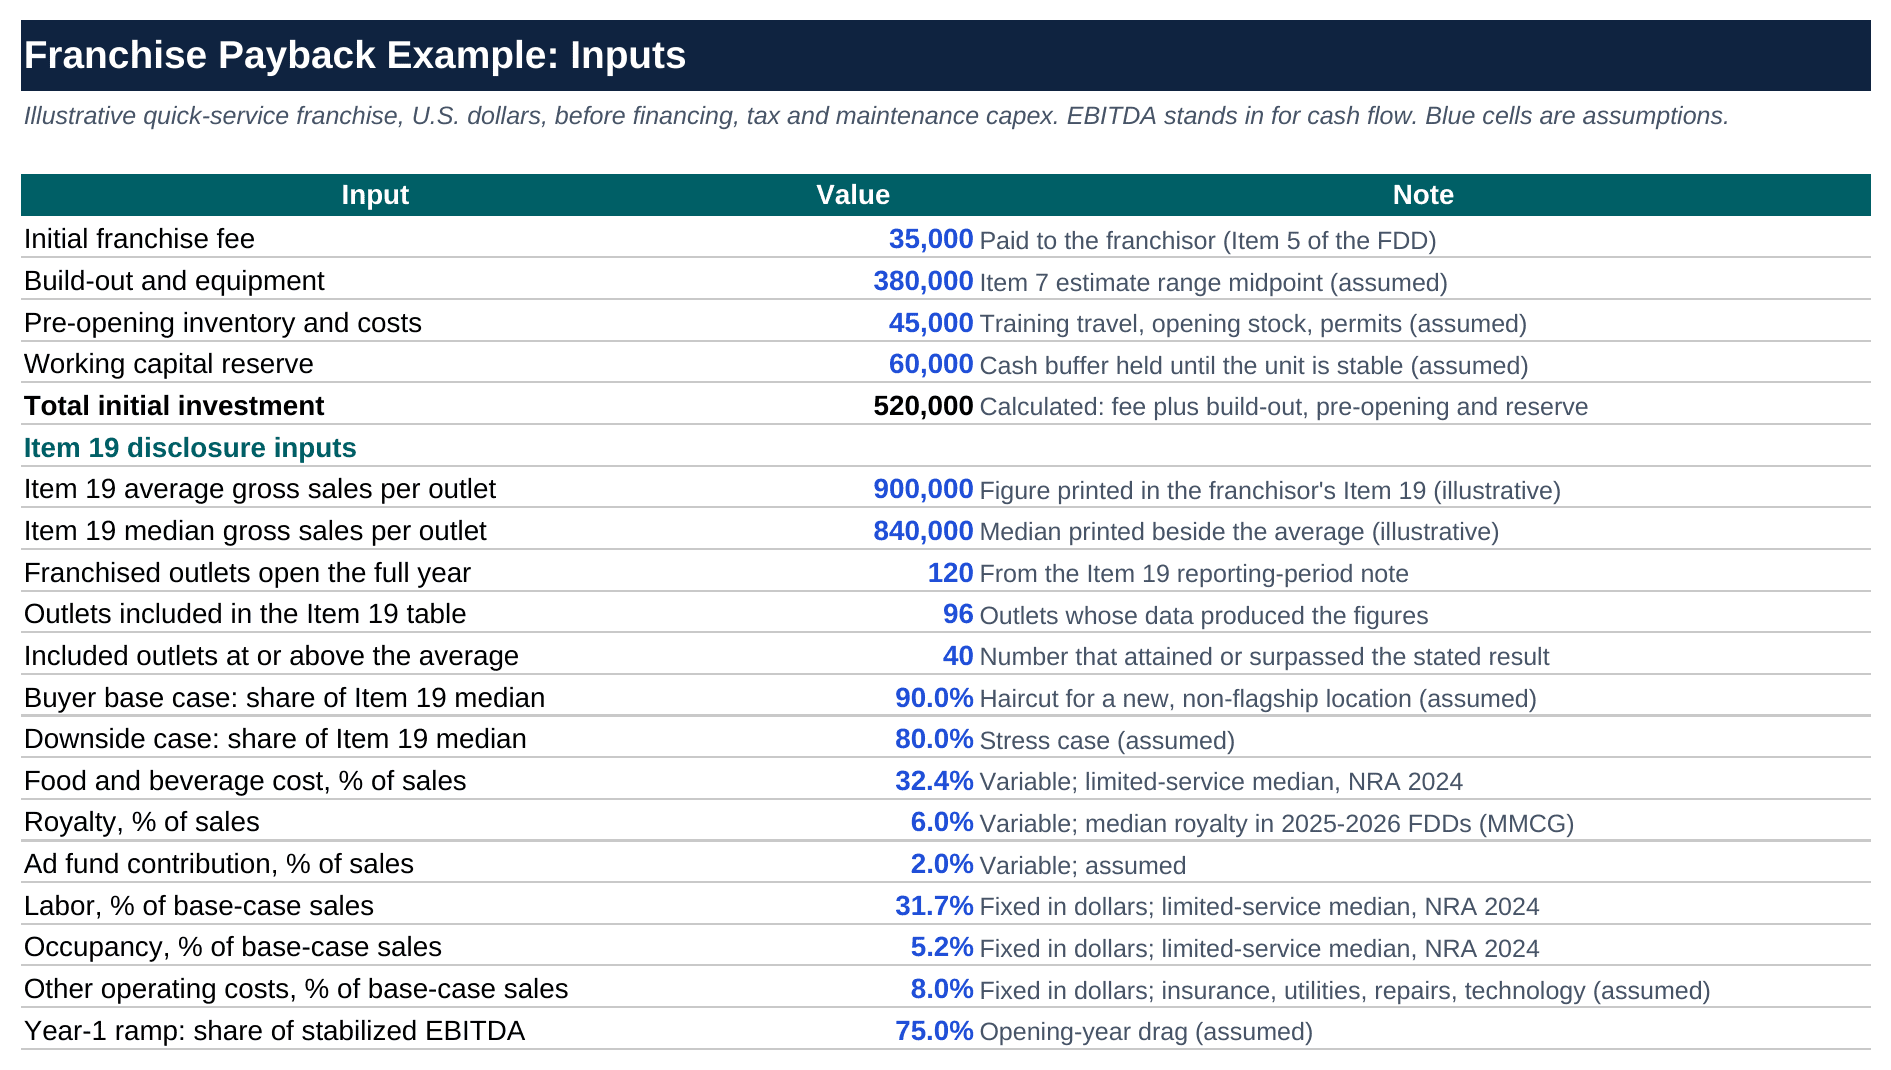
Step 1: audit and variance analysis. Coverage is 80% (96 of 120 outlets), so 24 outlets lack an explanation and deserve a question. The average exceeds the median by 60,000, which is 7.14% of the 840,000 median (60,000 / 840,000 = 0.0714). The buyer base case takes 90% of the median, or 756,000, because a new site rarely matches the best outlets. Against that base, the Item 19 average is 19.05% higher (144,000 divided by 756,000).
Step 2: cash proxy by case. Food cost (32.4%), royalty (6%) and a 2% ad fund move with sales. Labor (31.7%), occupancy (5.2%) and other costs (8%) are fixed in dollars at 339,444, the base-case amounts. This creates operating leverage, the way fixed costs magnify the effect of sales changes on profit. Four-wall earnings before interest, taxes, depreciation and amortization (EBITDA), measured at the unit level, is an earnings measure and not true cash flow. The example treats it as a proxy for annual cash flow by assuming that working capital changes, maintenance capital spending, tax, interest and owner pay are nil. Any of them would lengthen the payback periods below.
| Case | Sales | Stabilized EBITDA (cash proxy) | Margin |
|---|---|---|---|
| Brand claim (Item 19 average) | 900,000 | 196,956 | 21.9% |
| Buyer base (90% of median) | 756,000 | 111,132 | 14.7% |
| Downside (80% of median) | 672,000 | 61,068 | 9.1% |
Because costs stay fixed in dollars, the brand-claim margin of 21.9% is flattered by sales above the base case, which is the operating leverage effect at work.
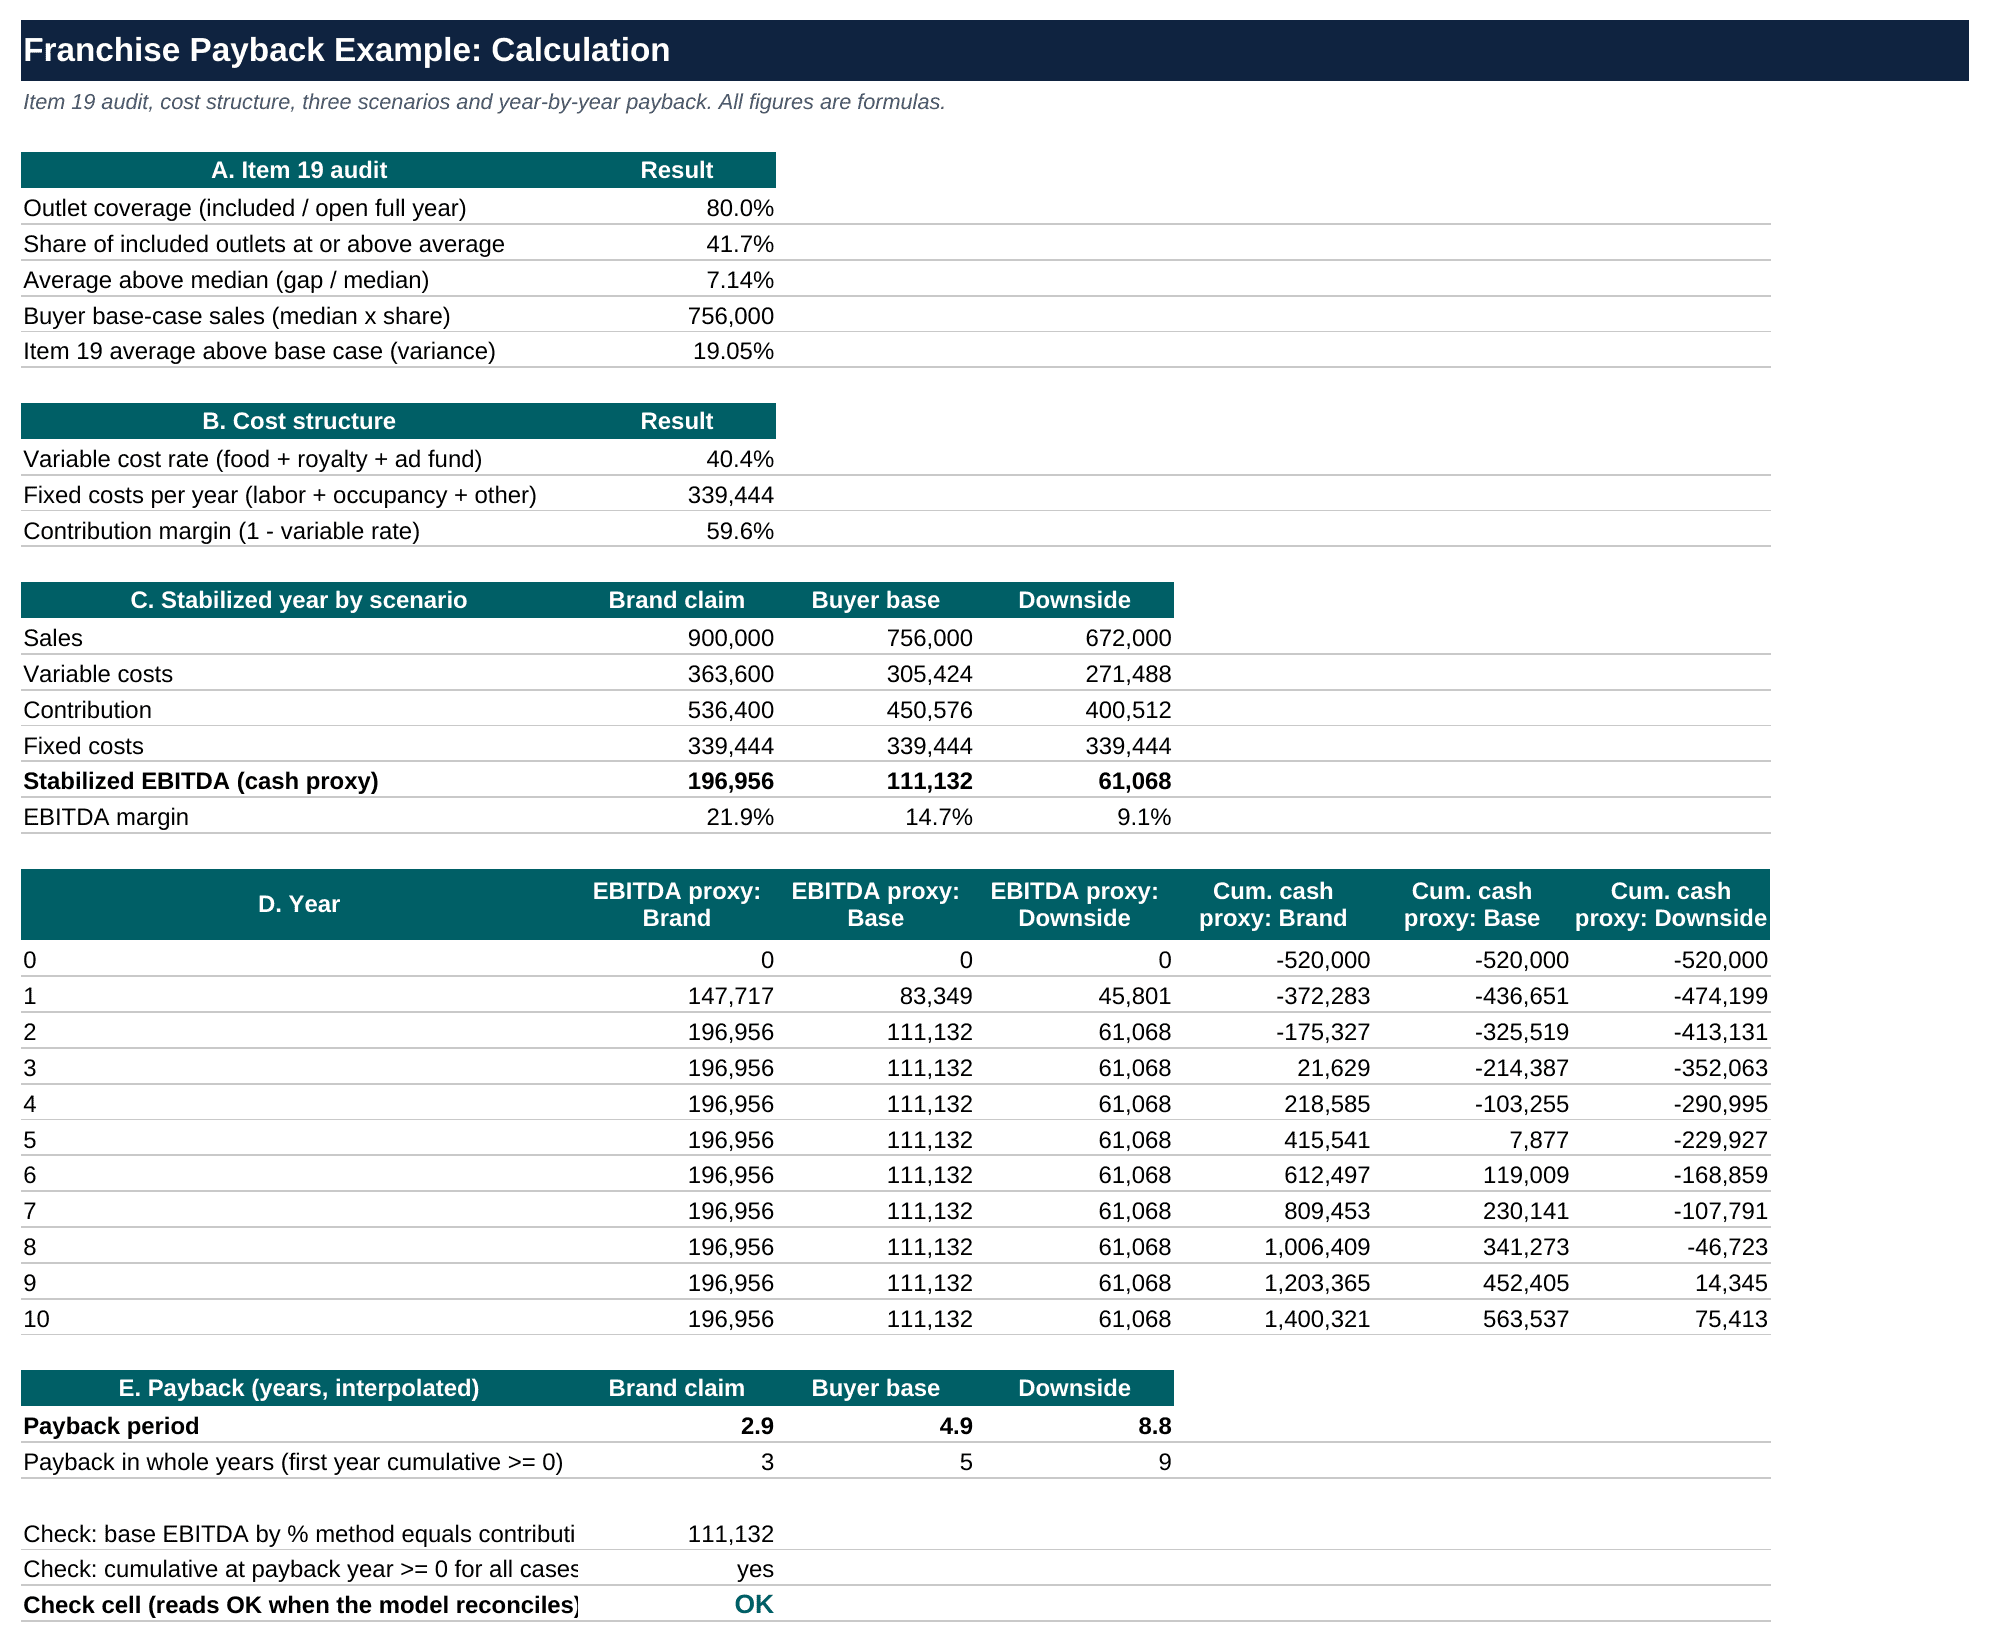
Step 3: payback. Year 1 delivers 75% of the stabilized EBITDA, as the unit ramps up. In the base case, the cumulative cash proxy is minus 103,255 after Year 4, and Year 5 adds the full stabilized 111,132, so payback is 4 + 103,255 / 111,132 = 4.93, or 4.9 years. In every case here the recovery year falls after the ramp-up year, so its EBITDA equals the stabilized amount. The brand claim gives 2 + 175,327 / 196,956 = 2.9 years, and the downside case gives 8 + 46,723 / 61,068 = 8.8 years.
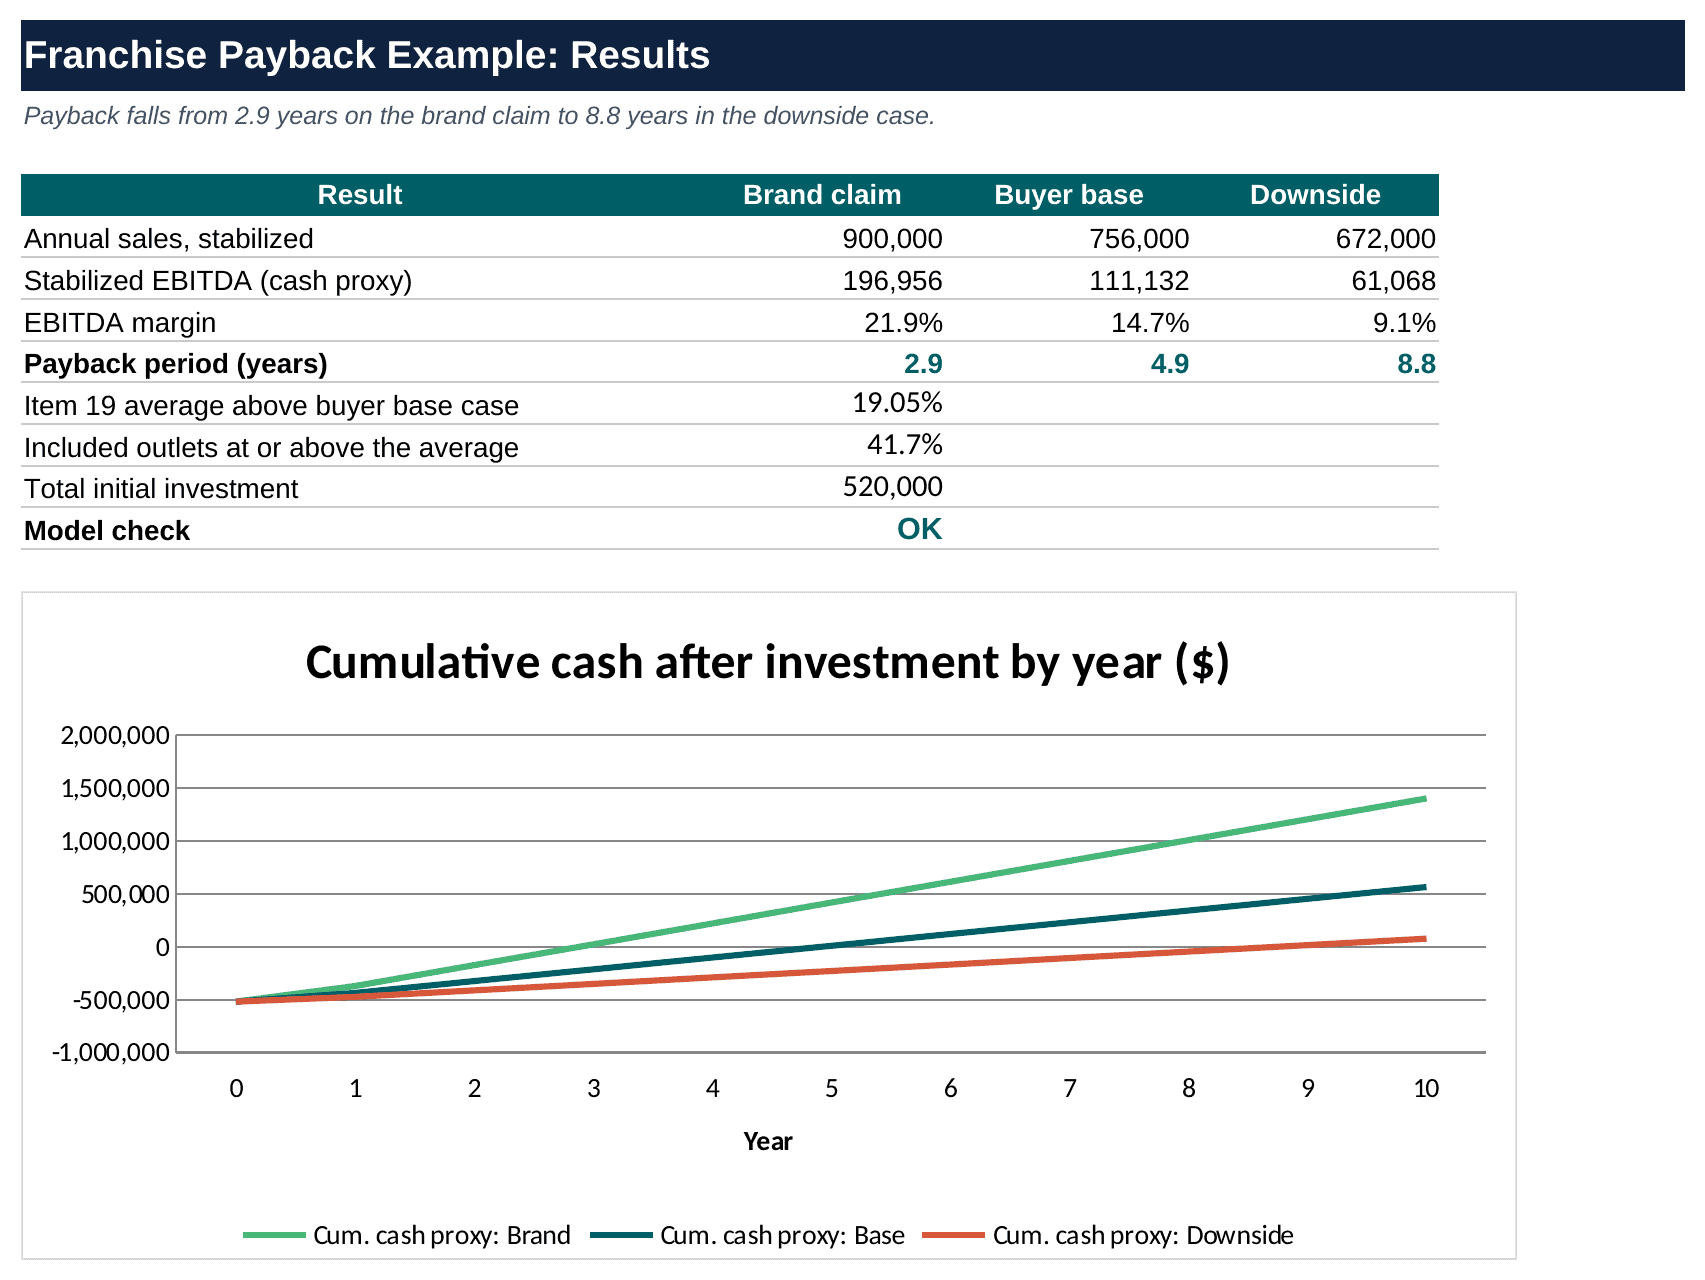
The spread from 2.9 to 8.8 years matters more than any single payback figure. The same Item 19 claim looks safe or marginal depending on the sales case, so a buyer should compare each payback with the loan terms and the time they plan to hold the franchise.
Red Flags That Should Pause the Purchase
A claim made outside Item 19, an outlet table that omits much of the system, an average far above the median, heavy owner turnover in Item 20 and cost lines far from the benchmarks all justify a pause. These are judgement calls without fixed thresholds.
Conclusion
A franchise’s numbers are realistic when the Item 19 claim is backed by outlet counts, survives the move from average to median, and still repays the investment in the downside case. Prospects who want to test their own cases can start from the Payback Period Calculator from eFinancialModels.
Frequently Asked Questions
What should a buyer do if a salesperson quotes earnings that are not in the FDD?
Ask for the figure in writing and compare it with the disclosure document line by line. A verbal number that cannot be matched to a table is unsupported, so the buyer should note the date, the speaker and the figure, request an explanation, and consider asking a franchise attorney to review the situation before signing anything. This article is general information and not legal advice.
How can a buyer evaluate a franchise that publishes no Item 19?
Without a published claim, the buyer must build the model from other evidence. The estimated initial investment table, the outlet turnover charts and the franchisor’s audited Item 21 statements still exist, and franchisee interviews supply real sales and cost figures. Each interview figure becomes an input, and a low, middle and high case then tests how heavily the result depends on any single owner’s recollection or best year.
Does the payback period include loan payments and the owner’s salary?
Only if the model says so. The worked example is an unlevered view: it uses EBITDA as a cash proxy before financing and before any owner pay. A buyer who borrows should reduce the yearly figure by principal and interest, a buyer who works in the unit should deduct a fair manager salary, and both should allow for working capital and maintenance spending, because each choice lengthens payback and changes the answer a lender will see.
Why is payback not enough to approve a franchise?
Payback ignores the time value of money and everything earned after recovery. A unit that repays slowly but earns for fifteen years can beat one that repays fast and then closes after a short lease. Net present value (NPV), the value today of future cash flows minus the investment, covers that gap and works best alongside payback, because the two measures answer different questions about the same cash.