
0 ITEMS

Biotech Financial Model Case Study
Table of Content

Key Takeaways
- Situation: the founder who runs a development-stage company with several products in development had to plan the next fundraising and show investors that cash is managed responsibly.
- What mattered: one integrated model answering investors’ questions before the first meeting: how much to raise and when, how long cash lasts, what a slipping stage does to runway, the return after dilution and the upside.
- Turning point: realistic chances of success, per programme and stage, became the base of the forecast; the risk this showed in the cash plan called for scenario thinking.
- Outcome: a monthly forecast, a mid- to long-term plan, raise size and date read against cash, returns after dilution, and upside and downside readings.
PDF3.0 MB
Free download · No email required
Download the Biotech Financial Model Case Study
✓ Model structure✓ Key assumptions✓ Results and takeaways
A development-stage biotech spends heavily long before any product earns revenue, so investors do not buy current earnings. For the next raise they ask what return to expect after dilution, how long the cash lasts, what happens if a lead programme slips, what the upside is and how the money is used. The founder who runs the company has to answer them before the first meeting, and a financial model that answers them together is the preparation.
The Client and the Decision
The founder who runs a development-stage company had several products in development, called programmes here, and had to plan the next fundraising. Cash was scarce, so it had to be planned carefully: where to spend it, in what order, how much to raise and when. Investors would judge whether the company manages funds responsibly and would want upside and downside, not one forecast. The company needed a monthly forecast and a mid- to long-term financial plan that join without breaks.
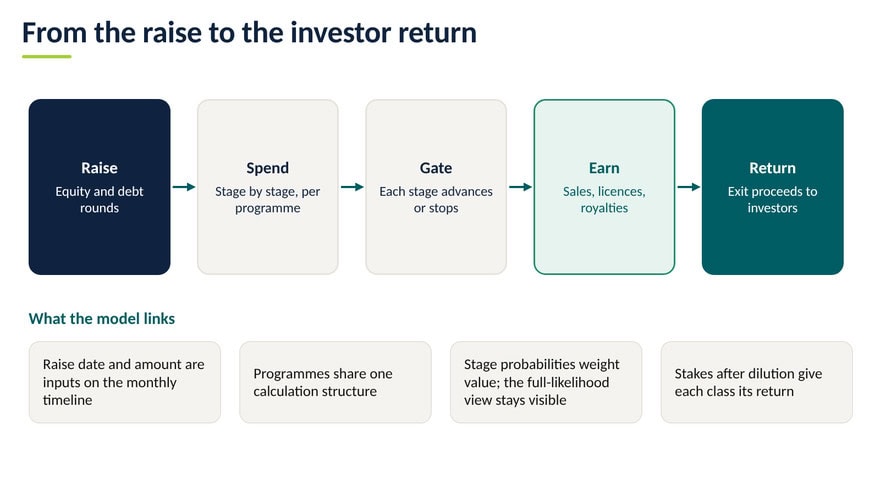
How a development-stage biotech works. Money enters in equity or debt rounds and is spent stage by stage on each programme, plus shared costs such as manufacturing and overheads. Each stage ends at a gate: the programme advances or stops.
Why This Was Hard to Model
- Realistic chances of success per stage. A programme can stop at any stage, and cash is spent before the result is known. Cash need and value cannot be trusted without realistic chances per stage. How we solved it: Each programme carries its own stage chances as visible inputs; revenue, cost and capex are weighted by them, next to the full-likelihood view.
- Sizing and dating the raise from the cash plan. The founder had to decide how much to raise and when. Cash must stay above a minimum buffer until closing, so the date matters as much as the amount. How we solved it: Closing date and amount are inputs of the monthly forecast, which joins the long-term plan on one timeline; moving a date shows its effect on cash and buffer.
- Spending scarce cash across several programmes. Programmes compete for the same cash. Moving budget between them changes each programme’s cash need and value, and investors want to see why. How we solved it: Every programme runs on an identical sheet and allocation factors redirect spend, so a change flows through to cash and value.
- Returns for investors after dilution. Each round dilutes earlier investors, so returns depend on entry price, later rounds and exit, and ownership must reconcile at every step. How we solved it: A share register rolls stakes forward from pre-money valuation and injection and derives proceeds and IRR per investor class.
The Turning Point: A Realistic Estimate of the Chances of Success
The cash plan started with programme costs. What mattered more was how realistic the chance is that each programme clears each stage, because money is spent before the result is known. These chances became the base of the forecast: revenue, cost and capex are weighted by them. Building the cash plan on them also showed how much risk it carries, so the founder had to think in scenarios: upside, base and downside readings.
What Sets the Size and Timing of the Next Raise
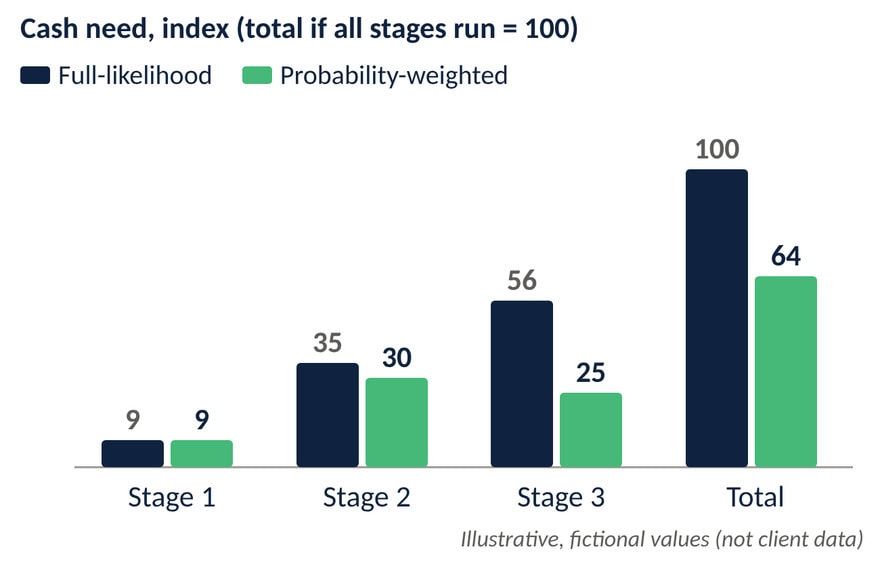
Spend, programme outlook, funding terms and investor return together set how much the company has to raise and when; the drivers are shown without ranking. A worked example with fictional numbers shows how the chances change the cash need. One programme has three stages still to clear, with chances of clearing each of 0.86, 0.52 and 0.88. A stage starts only if the earlier ones are cleared, so the chance of reaching stage 2 is 0.86 and of reaching stage 3 is 0.86 x 0.52 = 0.45. The full-likelihood view funds every stage; the weighted view funds each stage by the chance of reaching it. The weighted need is 64 against 100, so the estimated chances alone lower the cash need by 36 percent in this example.
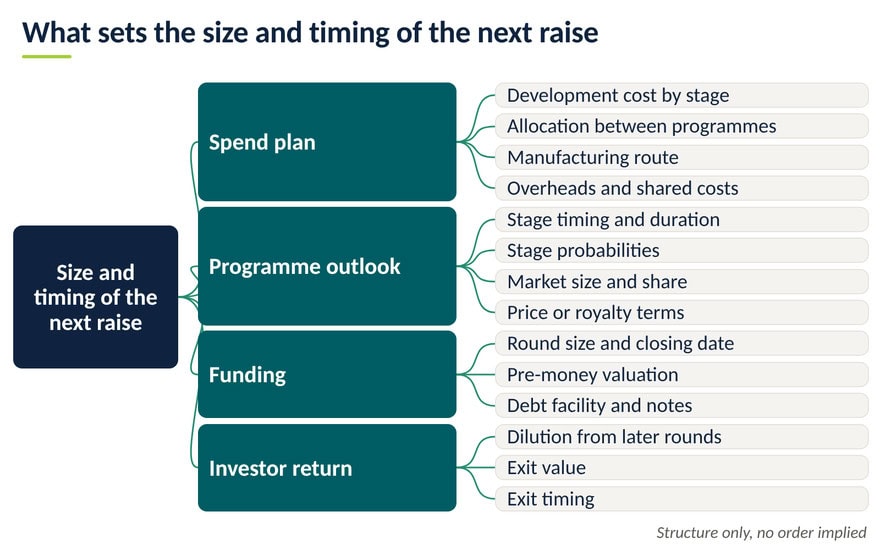
Worked example with fictional numbers: cash need of one programme in two views
| Item | Stage 1 | Stage 2 | Stage 3 | Total |
| Chance of reaching the stage | 1 | 0.86 | 0.45 | – |
| Spend if every stage runs (index, all stages = 100) | 9 | 35 | 56 | 100 |
| Probability-weighted spend (index) | 9 | 30 | 25 | 64 |
Value after risk is not the cash you need. A responsible cash plan keeps three things apart: committed spend, spend that can still be redirected between programmes, and the buffer held back. Risk-adjusted value is what the pipeline is worth after failure risk, but a committed stage is paid before its result is known, so the cash plan funds it in full. A second fictional example shows two views of value: risk-adjusted value is the full-likelihood value times the cumulative chance, the product of the stage chances.
Worked example with fictional numbers: one pipeline, two views
| Item | Programme A | Programme B | Programme C |
| Stages still to clear | 2 | 3 | 4 |
| Chance of clearing each stage | 0.88, 0.41 | 0.86, 0.52, 0.88 | 0.93, 0.54, 0.83, 0.59 |
| Cumulative chance | 0.36 | 0.39 | 0.25 |
| Value if all stages succeed (index, largest = 100) | 23 | 72 | 100 |
| Risk-adjusted value (index) | 8 | 28 | 25 |
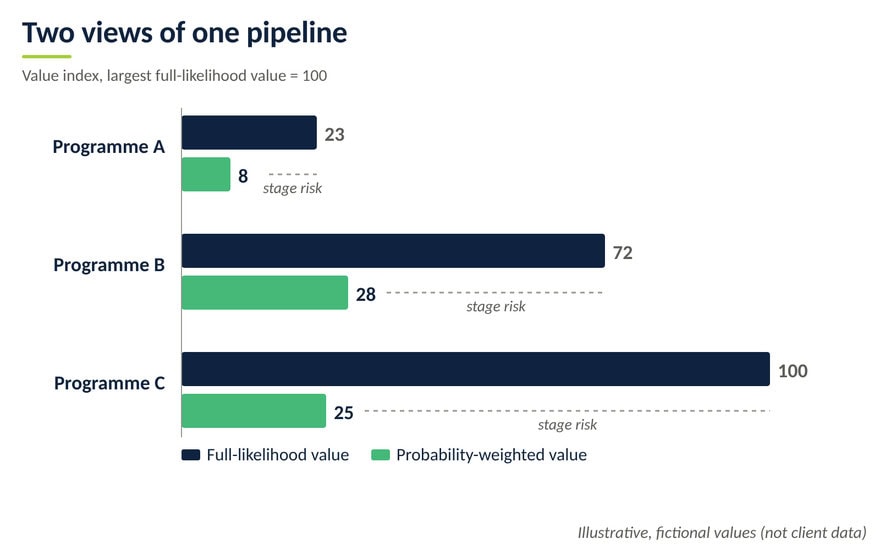
Programme C has the largest upside, yet after four stages of risk its weighted value is below B’s. Planning the cash on these chances also showed how much risk the plan carries, so the founder read it in scenarios. The model stores no named cases: each reading is a view setting plus lever changes.
Illustrative scenario readings (no client values)
| Reading | What changes | What it means for the founder |
| Downside reading | A stage slips or stops; spend runs on; a round closes later | Runway shortens; the raise starts earlier and can grow |
| Base reading | Probability-weighted view; rounds close on planned dates; committed spend at 100% | Tests whether the buffer holds before each closing |
| Upside reading | Full-likelihood view: every programme clears each stage on schedule | Shows what success is worth and the spend it requires |
How We Worked Together and the Result
We started with a discussion with the founder about the next raise and investors’ questions, prepared by analysing the company’s plan, past spend and programme pipeline. With the management team we then planned the structure, the drivers and how upside and downside would be read. We built the model, reviewed results, discussed scenarios and funding options, and prepared investor summaries. The founder received a financial model that delivers:
- A monthly forecast joined to a mid- to long-term plan on one timeline.
- Raise size and closing date read against cash and the buffer.
- Budget redirected between programmes, with its effect on cash and value.
- Investor returns per class after dilution, with a venture-capital-method cross-check.
Lessons and Questions for Founders of Development-Stage Biotech Companies
Three lessons.
- Estimate the chance of success per programme and stage realistically before sizing the raise. Cash need, value and runway rest on it.
- Because the plan carries risk, think in scenarios. Show the full-likelihood and weighted views side by side and fund committed spend in full.
- Keep every programme on one calculation structure. A reviewer who understands one can check all, and budget moves become levers.
Questions to ask before you build a biotech fundraising model.
- What return can investors in the next round expect after dilution?
- How realistic are the chances of success per programme and stage behind the forecast?
- How much must be raised, and by which date must the round close?
- How long does the cash last, and what happens to the runway if a stage slips?
- How are the funds used across the programmes, and why in that order?
- What is the upside if the programmes advance as planned, and the downside if they do not?
- How does the pipeline earn: own sales, licensing or royalties?
- When, and through which exit, can investors realise their return?
Planning a similar project? See our Pharma and Biotech Valuation and Financial Model, or ask for a custom financial model. Write to us at [email protected].
FAQ
Short answers to the questions readers ask most often when they plan this type of model.
How do you estimate realistic chances of success in a biotech model?
Give every programme its own chance of success for every stage and keep them as visible inputs, so each can be discussed and changed. Revisit them as results arrive, and show the weighted view beside the full-likelihood view so everyone sees how much the risk adjustment changes the picture.
What is runway, and when should the next raise start?
Burn rate is the net cash spent per month; runway is how many months the cash covers at that rate. The raise must close while the buffer is intact, so the start date is the latest closing date minus the time the process needs.
Why use scenarios when the model is already probability-weighted?
A weighted view gives one expected path, but a committed stage is paid before its result is known. Upside, base and downside readings show how far the plan can move, whether the cash buffer holds in the downside, and when the next raise has to start.
What does a risk-adjusted valuation show?
It weights each programme’s discounted cash flows by the chance of reaching each stage, estimating the pipeline’s worth after development risk. It does not show the cash needed, because a committed stage is paid before its result is known, so a cash view has to sit beside it.
Client details are anonymised to protect confidentiality. Charts, schematics and worked examples are illustrative and contain no client data.


