
0 ITEMS

Green Hydrogen Financial Model Case Study

Key Takeaways
- A multinational client’s technology team needed the economics of its wind-powered green hydrogen projects. One model analyses all of them, not only one.
- What mattered: tax credits, electricity cost, the transfer price from the wind farm, electrolyser size and the HPA. Every project runs through the same method, so projects compare and rank on one basis before any HPA is negotiated.
- Turning point: a blended IRR (annual return on the capital invested) hides which plant creates the return; splitting wind and hydrogen made the wind farm alone the comparison to beat.
- Outcome: an analysis the team can present and explain, and one method for every project, worldwide.
PDF1.9 MB
Free download · No email required
Download the Green Hydrogen Financial Model Case Study
✓ Model structure✓ Key assumptions✓ Results and takeaways
Anyone investing in a green hydrogen project asks what it earns, how much depends on tax credits, and what happens if electricity costs more or the sales contract is shorter. We prepared one financial model that analyses all of the client’s green hydrogen projects, not only one. Every project runs through the same approach and method, so the projects can be compared and ranked on the same basis.
The Client and the Decision
The technology team of a multinational client needed to understand the economics of green hydrogen projects powered by wind. The client had projects in different jurisdictions, so one model had to handle investment tax credits (ITCs) and production tax credits (PTCs) as each required. The decision was how to judge such projects: which plant earns the return, how large the electrolyser should be, and how the sales contract shapes the result.
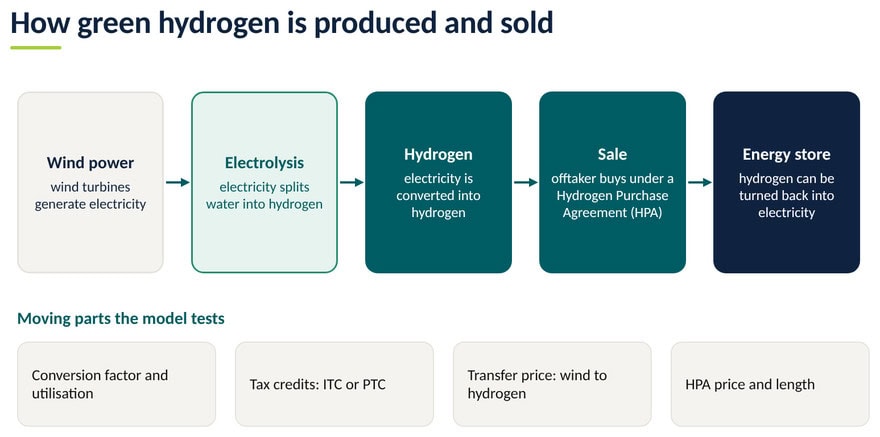
How a green hydrogen project works. Wind turbines generate electricity, and the electrolyser splits water into hydrogen with it. The hydrogen is sold under the Hydrogen Purchase Agreement (HPA): a buyer commits to take it at an agreed price per kilogram for an agreed number of years. It fixes the revenue side; later years have no fixed price.
Why This Was Hard to Model
- Tax incentives in several jurisdictions. The return depends on tax credits, so the model treats them in detail. An ITC is calculated on the cost of the plant; a PTC on what it produces. How we solved it: The model handles both and allocates each incentive to the right plant.
- A blended return of wind and hydrogen. A blended IRR cannot say which plant creates the return. How we solved it: We modeled IRRs separately for the wind farm and the hydrogen plant, and showed how transfer prices move each.
- The length of the HPA. The HPA duration reaches every year of revenue; a shorter agreement leaves volume without a fixed price. How we solved it: We showed how HPA duration affects returns before it is negotiated.
- The developer perspective. A developer takes the development risk and can sell its stake once the plant is secured. How we solved it: We showed the developer’s return and what a finished project could sell for.
- One method for every project. Projects differ in wind pattern, electricity cost, credits and contract length, and another power source could be cheaper than wind. How we solved it: We calculated the levelised cost (lifetime cost per kg or kWh, all costs spread over all output) in one model, so projects rank on one basis.
Sizing the electrolyser against the wind farm. A wind farm produces an hourly output pattern that follows the wind. The electrolyser can only use power up to its own capacity. If it is too small, the energy above that capacity is curtailed, which means wasted. If it is too large, it spends most hours below full load: its load factor, the average output as a share of its capacity, falls, and the fixed cost per kilogram rises. The right size sits between the two. For every size, on the same hourly profile, the model runs five steps:
- Take the hourly output of the wind farm.
- Cap every hour at the electrolyser size. The sum is the energy used; the rest is curtailed.
- Convert the energy used into kilograms, and divide it by size times hours for the load factor.
- Divide wind farm plus electrolyser cost by kilograms. Storage or grid top-up are options.
- Apply the HPA price and tax-credit rules, and pick the size with the lowest cost per kilogram or the best return.
The credit rules can move the answer: a credit paid per kilogram, or a contract that commits a volume, makes each extra kilogram worth more, so the best size can grow. Each project has its own wind profile, so each gets its own best size from the same method.
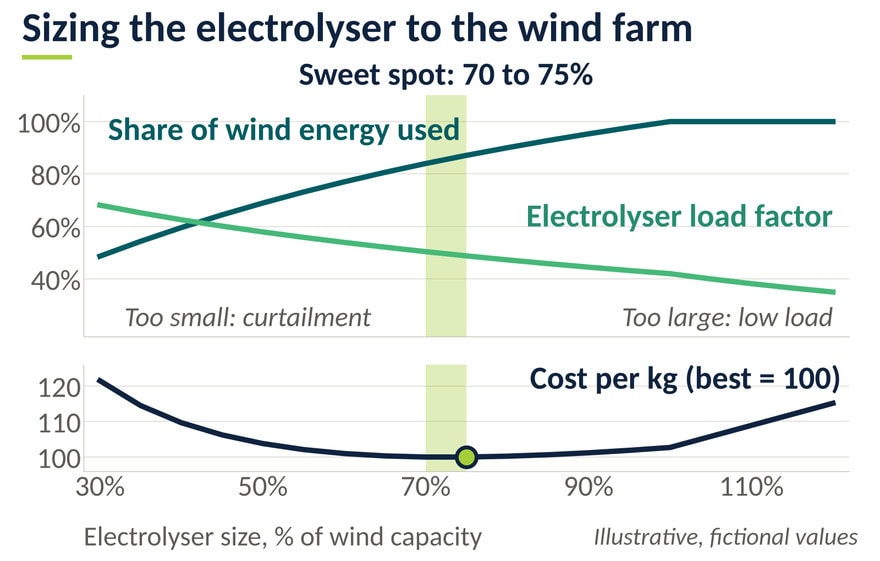
Worked example 1, fictional numbers: a wind farm of 100 MW producing 368 GWh a year, 50 kWh per kg
| Item | 30 MW | 50 MW | 75 MW | 100 MW | 120 MW |
| Electrolyser size, % of wind capacity | 30% | 50% | 75% | 100% | 120% |
| Wind energy used | 179 GWh | 254 GWh | 321 GWh | 368 GWh | 368 GWh |
| Share of wind energy used | 49% | 69% | 87% | 100% | 100% |
| Load factor | 68% | 58% | 49% | 42% | 35% |
| Hydrogen per year | 3.6 kt | 5.1 kt | 6.4 kt | 7.4 kt | 7.4 kt |
| Annual cost (wind farm = 100) | 146 | 177 | 216 | 254 | 285 |
| Cost per kg (best = 100) | 121 | 104 | 100 | 103 | 115 |
At 30 MW the plant uses under half of the wind energy and costs 21% more per kilogram than the best. At 120 MW it uses all of it but runs at a 35% load factor, 15% above the best. At 75 MW it wastes 13% of the wind and still wins, because more capacity adds cost faster than kilograms.
The Turning Point: From One Blended IRR to a Split That Shows Who Earns the Return
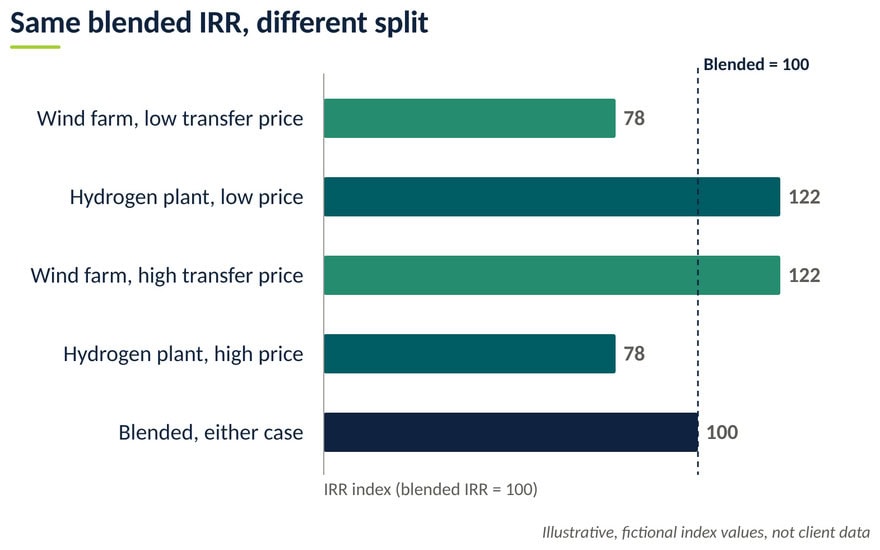
A blended IRR hides which plant creates the return, so the model splits wind and hydrogen with a transfer price. That makes the wind farm alone the comparison the hydrogen plant has to beat, and as every project is split the same way, projects compare on one basis. A transfer price only divides a fixed total: it moves return between the plants and leaves the blended return unchanged.
What Drives the Value
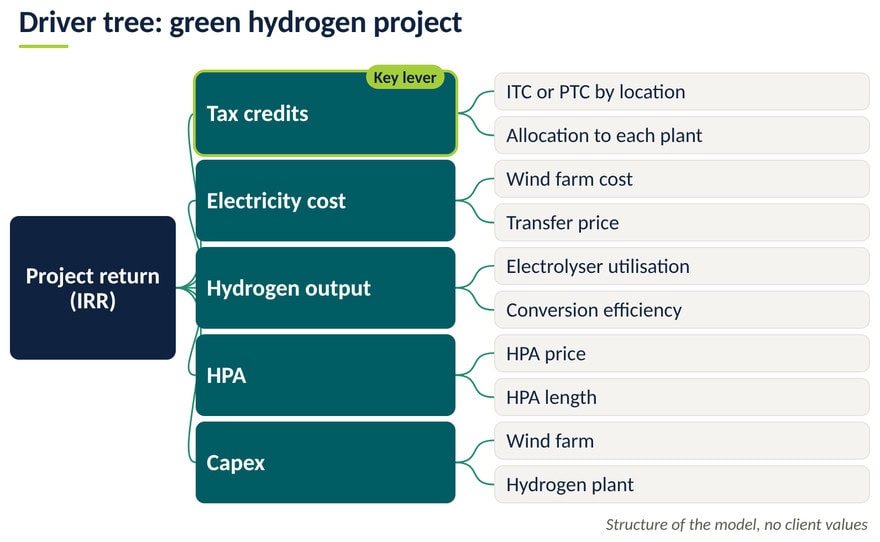
Tax credits come first: they can decide whether a project earns its return. Other drivers are electricity cost, electrolyser size and utilisation, conversion efficiency, HPA price and length, and capex. Each kilogram needs a fixed amount of electricity, so electricity cost sets most of the cost per kilogram (worked example 2).
Worked example 2, fictional numbers: cost of one kilogram of hydrogen
| Item | Case A | Case B (higher electricity price) |
| Electricity needed per kg | 50 kWh | 50 kWh |
| Electricity price | 0.040 per kWh | 0.050 per kWh |
| Electricity cost per kg | 2.00 | 2.50 |
| Plant capex and operating cost per kg | 1.40 | 1.40 |
| Levelised cost of hydrogen before credits | 3.40 | 3.90 |
| Tax credit per kg | 0.60 | 0.60 |
| Net cost per kg | 2.80 | 3.30 |
| HPA price per kg | 3.10 | 3.10 |
| Margin per kg | 0.30 | -0.20 |
Worked example 3 shows the turning point: the wind farm sells electricity at a levelised cost of 0.030 per kWh to the hydrogen plant, and the combined margin stays the same while the plant that carries it changes.
Worked example 3, fictional numbers: one margin, two splits (per kilogram of hydrogen)
| Item | Transfer price 0.035 per kWh | Transfer price 0.045 per kWh |
| Wind farm margin (50 kWh at transfer price less 0.030) | 0.25 | 0.75 |
| Hydrogen plant: electricity cost at transfer price | 1.75 | 2.25 |
| Hydrogen plant: capex and operating cost | 1.40 | 1.40 |
| Hydrogen plant: tax credit | 0.60 | 0.60 |
| Hydrogen plant: net cost per kg | 2.55 | 3.05 |
| Hydrogen plant margin (HPA price 3.10 less net cost) | 0.55 | 0.05 |
| Combined margin per kg | 0.80 | 0.80 |
What to test before the HPA negotiation. Run the project at the HPA length on offer and a shorter one. Switch the tax credits off. Raise the electricity price. Test the electrolyser size. Then read the result as a ranking against the other projects. Sometimes a project proves less attractive than assumed, which is worth knowing before funds are committed.
How We Worked Together and the Result
We analysed the material and led the opening discussion with the technology team, agreed the plan for one model covering all projects, built it, reviewed it together and handed over an analysis the team can present and reuse. The result: the client received one analysis it can present and explain, and a method that covers all of its green hydrogen projects on the same basis:
- IRRs for the wind farm and the hydrogen plant;
- the developer’s return and what a finished project could sell for;
- the levelised cost of energy and of hydrogen, for projects worldwide;
- how HPA length affects returns, ahead of negotiation;
- a sizing test of the electrolyser.
Lessons and Questions for Anyone Modeling Green Hydrogen Projects
Three lessons.
- Run every project through one model. The same method makes projects comparable.
- Split the plants and set the benchmark first: the wind farm alone.
- Size the electrolyser on the hourly wind pattern and test the HPA length before you negotiate it.
Questions to ask before you build a green hydrogen model.
- What does the whole project earn, and what does the wind farm alone earn as the benchmark?
- How much depends on tax credits, and what is left without them?
- Where is the downside: electricity cost, a shorter HPA, or an electrolyser too small or too large?
- How does the project turn into profit: HPA price against the levelised cost per kilogram?
- Which project ranks first when all run through the same method?
Planning a similar project? See our Green Hydrogen Production from Wind Energy financial model. If your project needs something specific, we build custom financial models. Write to us at [email protected].
FAQ
Short answers to the questions readers ask most often when they plan this type of model.
Can one financial model analyse several green hydrogen projects?
Yes. The model in this case runs every project through the same approach and method: wind farm, hydrogen plant, tax credits, sizing test and sales contract. Because the structure is identical, projects can be compared and ranked on the same basis instead of being judged one at a time.
What is a Hydrogen Purchase Agreement (HPA)?
An HPA is the offtake agreement between the plant and the party that buys the hydrogen it produces. Its price and length shape the revenue side, so a financial model should test both before the terms are agreed. Years without a contract are sold without a fixed price.
How do you size an electrolyser against a wind farm?
Test a range of electrolyser sizes on the same hourly wind profile. A small size wastes wind energy; a large one runs at a low load factor, so the fixed cost per kilogram rises. The best size has the lowest cost per kilogram, or the best return once the sales contract and tax-credit rules are applied.
What is the difference between an ITC and a PTC?
In the model, an investment tax credit (ITC) is calculated on the investment made in a plant, and a production tax credit (PTC) on what the plant produces, kilogram by kilogram. Credit types differ by jurisdiction, so the model allocates each credit to the right plant and shows the return with and without it.
Client details are anonymised to protect confidentiality. Charts, schematics and worked examples are illustrative and contain no client data.


