
0 ITEMS

Travel Agency Financial Model Excel Template
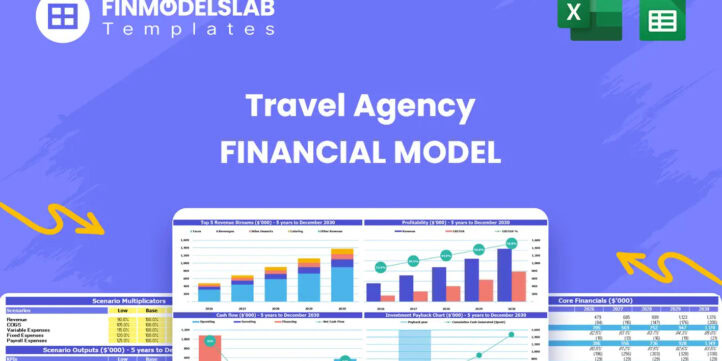
The Travel Agency Financial Model helps entrepreneurs, founders, consultants, analysts, and business owners build a structured financial forecast for a travel agency or travel marketplace without starting from a blank spreadsheet. It is designed to support planning for commission-based bookings, subscription income, seller extras, customer acquisition, staffing, operating expenses, startup costs, and long-term profitability. Instead of relying on rough estimates, users can organize their assumptions in one editable model and see how changes in pricing, booking volume, marketing spend, and cost structure affect the business over time. This financial model template is useful for anyone preparing a business plan, investor presentation, loan application, internal budget, or expansion strategy for a travel business. It gives users a practical way to estimate how much capital may be needed before launch, how revenue may scale, when the business could become profitable, and whether the expected margins are strong enough to support growth. The model connects revenue assumptions with payroll, operating expenses, cash flow, profitability, and break-even analysis, helping users evaluate the financial logic behind the business before making major commitments. The template is built to be editable and decision-focused. Users can adjust assumptions for buyer and seller acquisition, commission rates, fixed booking fees, subscription pricing, average order values, repeat purchases, staffing levels, technology investment, marketing costs, and other key drivers. As assumptions are updated, the model helps generate financial outputs that can be reviewed monthly and annually, including projected revenue, expenses, profit, funding requirements, and cash balances. This makes it easier to compare strategic options, test growth plans, and understand the financial impact of different decisions. For travel agency founders and planning teams, the main value is clarity. The Travel Agency Financial Model turns a complex business model into a more manageable forecast that can be shared with investors, lenders, partners, or internal stakeholders. It supports professional financial planning by showing how the business may perform under realistic assumptions, where cash pressure may appear, what drives profitability, and which metrics deserve close attention. Whether used for a new launch or a scaling travel platform, it provides a ready-to-use framework for making better financial decisions.


Financial Model Overview
The Travel Agency Financial Model is a ready-to-use financial model template built for planning, funding, and managing a travel agency or travel marketplace. It helps users forecast how the business may perform over a multi-year period by connecting revenue assumptions, startup investment, operating expenses, payroll, cash flow, profitability, and investor-oriented reporting in one structured model. For a travel agency, the financial picture can involve several moving parts, including commission revenue, fixed booking fees, buyer and seller subscriptions, promoted listings, customer acquisition costs, staffing needs, technology costs, and cash requirements before revenue fully ramps up. This template gives entrepreneurs, founders, consultants, analysts, and business owners a practical framework for organizing those assumptions and turning them into a clear financial plan. The model is editable, compatible with Excel and Google Sheets, and designed to support business plans, lender discussions, investor presentations, internal budgets, and strategic decision-making.
All-in-One Dashboard
The all-in-one dashboard brings the most important inputs and outputs into one central view so users can understand the financial position of the travel agency without searching through every worksheet. This component is especially useful for a travel business because the model may depend on several connected assumptions, such as buyer acquisition, seller onboarding, commission rates, average booking value, subscription pricing, marketing spend, payroll, and platform development costs. The dashboard helps users review these assumptions alongside the resulting outputs, including revenue, gross margin, EBITDA, profit, cash position, funding needs, and return metrics. By combining core drivers and core results in one place, the dashboard makes the model easier to use for both financial and non-financial users. A founder can quickly see whether the forecast supports the current strategy, a consultant can review whether the assumptions are aligned, and an investor or lender can understand the overall business case more efficiently. This section is valuable for planning because it reduces complexity and helps users focus on the levers that matter most. When a change is made to pricing, customer acquisition, staffing, or operating costs, the dashboard helps reveal the financial impact across the business, supporting faster and more confident decision-making.
Low, Base, and High Scenario Analysis
The low, base, and high scenario analysis component helps users evaluate how the travel agency may perform under different business conditions instead of relying on a single forecast. A base case can represent the expected plan, while a low case can show the impact of slower customer acquisition, lower booking volume, higher marketing costs, or delayed seller onboarding. A high case can show the potential upside from stronger demand, higher average order values, better repeat booking rates, improved commission economics, or more efficient customer acquisition. This structure is highly useful for travel businesses because demand can be affected by seasonality, market trends, advertising performance, supplier relationships, and customer behavior. The scenario section may use inputs such as buyer acquisition cost, seller acquisition cost, order frequency, average order value, commission percentage, fixed booking fee, subscription pricing, conversion rates, and operating expense assumptions. The output helps users compare revenue, profit, cash flow, funding needs, and return potential across multiple cases. This makes the template more useful for investor discussions, board meetings, and internal planning because stakeholders can see not only what the business hopes to achieve, but also how resilient it may be if results are weaker than expected. Scenario analysis supports better risk management by helping users prepare for cash shortfalls, adjust budgets, and choose a growth plan that fits the company’s financial capacity.
Professional Charts
The professional charts component converts key financial outputs into presentation-ready visuals that help communicate the financial plan clearly. For a travel agency financial model, charts can make it easier to explain revenue growth, expense trends, cash flow movement, profitability improvement, customer acquisition performance, and margin development over time. Instead of presenting only rows of numbers, users can show stakeholders how revenue scales as buyer and seller activity increases, how operating expenses evolve as the team grows, and how profitability improves when fixed costs are spread across a larger booking base. This component may draw from the model’s revenue forecast, cost assumptions, payroll plan, cash flow forecast, and key performance indicators to create visual summaries that are easier to interpret. Charts are useful for business plans and funding documents because investors and lenders often need to understand the story behind the numbers quickly. A clear visual trend can show whether the business is moving toward break-even, whether cash reserves are sufficient, or whether revenue growth is supported by reasonable assumptions. This section also supports internal decision-making by helping founders compare actual or projected performance against strategic goals. When used in presentations, the charts can make the financial forecast more polished, professional, and accessible to non-financial audiences while still being supported by the underlying model calculations.
ROE Components and DuPont Analysis
The ROE components and DuPont analysis section helps users understand the drivers behind return on equity rather than looking at profitability in isolation. In a travel agency financial model, return on equity can be influenced by net profit margin, asset efficiency, capital structure, funding strategy, and the level of investment required to support growth. This component breaks the return profile into more meaningful parts so users can see whether investor returns are being driven by strong operating profitability, efficient use of capital, or financial leverage. Inputs may include net income, revenue, assets, equity, debt, retained earnings, and other balance sheet or profitability assumptions. Outputs may include return on equity, margin components, asset turnover, leverage effects, and related ratios that help explain how the business converts invested capital into financial returns. This is useful for investors, founders, and financial analysts because a travel agency or platform may appear attractive based on revenue growth alone, but the quality of that growth depends on how much capital is required and how efficiently the company uses it. DuPont-style analysis supports better strategic decisions by showing where performance improvements may come from. If returns are weak, users can evaluate whether the issue is pricing, cost control, asset intensity, funding structure, or operational efficiency. If returns are strong, the analysis helps explain why and can support a more credible investment case.
Revenue Inputs
The revenue inputs component is where users define the core commercial assumptions that drive the travel agency forecast. This section is central to the model because revenue for a travel agency or marketplace may come from several streams, including variable commissions on bookings, fixed booking fees, buyer subscriptions, seller subscriptions, promoted listings, advertising options, payment-related fees, and other seller extras. Inputs may include the number of buyers acquired, the number of sellers onboarded, marketing budget, customer acquisition cost, average order value, booking frequency, repeat order rates, commission percentage, fixed fee per order, seller category mix, monthly subscription fees, and adoption rates for premium services. The model then uses these assumptions to estimate gross merchandise value, commission revenue, subscription revenue, ancillary revenue, and total sales. This is useful because it connects the travel agency’s growth strategy directly to the financial forecast. If the business plans to spend more on marketing, target higher-value business travelers, onboard more hotels, or increase seller subscription pricing, users can adjust the relevant inputs and see how revenue changes. The section also helps users document the logic behind the forecast, which is important for business plans, investor reviews, and lending discussions. Instead of presenting revenue as a single top-down estimate, the model allows users to build the forecast from specific revenue drivers that can be tested, refined, and explained.
Bank-Ready Reports
The bank-ready reports component organizes the financial outputs into a format that is easier to share with lenders, banks, and other financing stakeholders. Travel agency founders may need external funding for platform development, initial marketing, office setup, staffing, working capital, and operating losses before cash flow stabilizes. Lenders typically want to see clear projections, assumptions, profitability potential, debt repayment capacity, and cash flow visibility. This section helps present the model’s outputs in a structured way, including projected income statement results, cash flow forecasts, balance sheet summaries, funding needs, profitability metrics, and other lender-friendly financial information. Inputs from the revenue forecast, cost structure, payroll plan, startup costs, financing assumptions, and cash flow schedule feed into these reports so users can demonstrate how the business expects to generate revenue and manage obligations over time. The reports are useful because they support credibility. A bank or lender is more likely to engage with a plan that shows not only the growth opportunity, but also the expected cash position, timing of capital needs, cost base, and ability to sustain operations. This component also helps business owners prepare for financing conversations by giving them a clearer understanding of their own numbers. Before applying for funding, users can evaluate whether the requested amount is sufficient, whether the repayment assumptions are realistic, and whether the business has enough liquidity to withstand slower-than-expected growth.
Revenue Breakdown
The revenue breakdown component gives users a more detailed view of how total revenue is created across different streams, customer types, and business activities. For a travel agency or travel marketplace, this is important because top-line revenue may come from several sources that behave differently. Commission revenue may depend on booking value and transaction volume, subscription revenue may depend on the number of active buyers or sellers, and seller extras may depend on optional adoption of promotional tools, advertising, or enhanced payment services. This section helps separate these streams so users can see which revenue sources contribute the most, which are recurring, which scale with transaction volume, and which may be improved through pricing or product strategy. Inputs may include buyer segments such as leisure travelers, business travelers, or groups, seller types such as hotels, flights, and tour operators, average order values by segment, monthly booking frequency, take rate, fixed order fees, subscription prices, and add-on service adoption. Outputs may include revenue by stream, revenue by segment, share of total revenue, year-over-year growth, and changes in revenue mix. This is useful for planning because not all revenue is equally predictable or profitable. A business that depends heavily on commission revenue may need strong booking volume, while a business with meaningful subscription revenue may have more recurring income. By reviewing the breakdown, users can identify growth opportunities, evaluate strategic priorities, and communicate the revenue model more clearly to investors, lenders, and operating teams.
KPI Dashboard
The KPI dashboard focuses on the operating and financial metrics that matter most for managing a travel agency or travel marketplace. While financial statements show the overall results, key performance indicators explain what is happening underneath those results. This section may track buyer acquisition cost, seller acquisition cost, average order value, booking frequency, repeat order rate, commission rate, take rate, gross merchandise value, subscription conversion, seller mix, customer growth, revenue per buyer, revenue per seller, EBITDA margin, cash runway, and other performance benchmarks. These metrics are especially important in a two-sided travel marketplace because the health of the business depends on acquiring and retaining both demand and supply. If buyer acquisition cost rises too quickly, marketing efficiency may weaken. If average order value increases, revenue may scale faster even without the same increase in order volume. If seller subscription adoption improves, recurring revenue may become a stronger part of the business model. The KPI dashboard helps users monitor these drivers and compare them against goals, assumptions, or industry benchmarks. This component is valuable for decision-making because it highlights whether the business is growing efficiently or simply spending more to generate revenue. It also supports investor communication because stakeholders often want to understand unit economics, marketplace efficiency, and scalability. By tracking KPIs consistently, users can identify problems earlier, adjust assumptions, and build a more disciplined operating plan.
Startup Cost Breakdown
The startup cost breakdown component helps users estimate the initial investment required to launch the travel agency before it begins generating meaningful revenue. This is a critical addition for a travel business because early costs can be significant, especially if the agency operates as a technology-enabled marketplace with platform development, booking functionality, supplier onboarding, marketing infrastructure, and operational setup. Inputs may include platform initial development, website or app buildout, software tools, booking systems, office setup, computer hardware, licenses, legal and accounting fees, branding, initial marketing, supplier onboarding costs, deposits, insurance, pre-launch payroll, and working capital reserves. The model organizes these costs so users can understand the total funding requirement and distinguish one-time launch expenses from ongoing operating costs. Outputs may include total startup investment, timing of cash outflows, funding gap, initial capital requirement, and the portion of startup costs allocated to technology, administration, marketing, and operations. This section is useful for founders preparing a business plan because it helps prevent underestimating the cash needed to reach launch.
File types:
Excel – Single-User: .xlsx
Excel – Multi-User: .xlsx
Similar ProductsOther customers were also interested in...


 HenrySheykin
Bookkeeping Agency Financial Model Excel Template
The Accounting Firm Financial Model Template helps founders, practice owners, consultants, analysts,... Read more
Architecture Firm Financial Model Excel Template
The Architectural Firm Financial Model Template helps founders, architecture practice owners, consul... Read more
Financial Advisors Agency Financial Model Excel Te...
The Financial Advisor Financial Model is a ready-to-use financial model template built for planning,... Read more

Life Coaching Financial Model Excel Template
The Life Coaching Financial Model helps coaches, entrepreneurs, consultants, founders, and business ... Read more
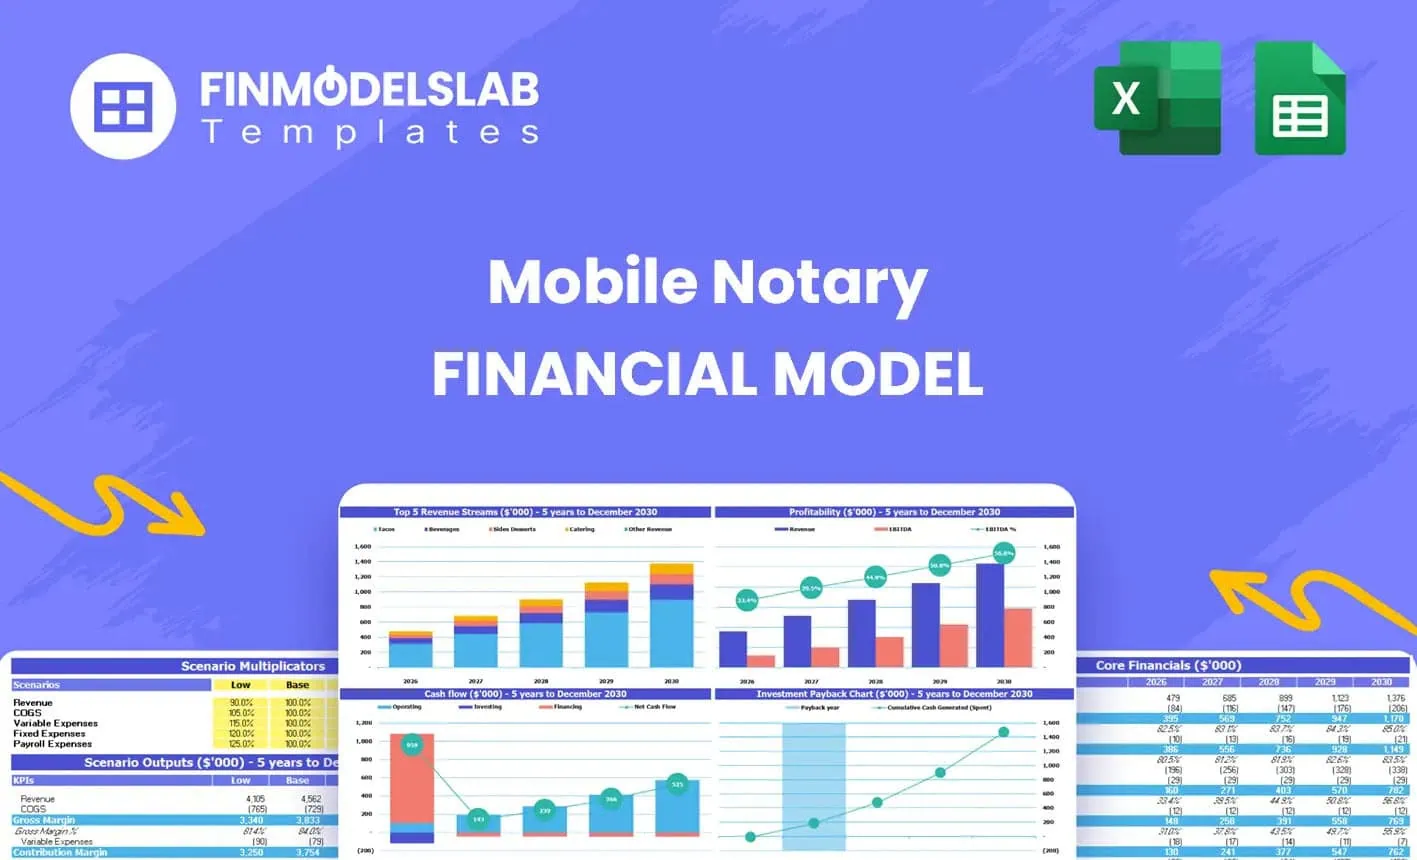
Notary Financial Model Excel Template
The Notary Service Financial Model helps entrepreneurs, business owners, consultants, analysts, and ... Read more

 Giorgos
Accounting Firm – 10 Year Financial Model
10-year financial model for an accounting firm providing forecasts, profitability analysis, and insi... Read more

Online Travel Agency Business Plan – 5Yr Fin...
Highly-sophisticated and user-friendly financial model providing 5-Year Financial Plan for a Online ... Read more

Cruise Line Company – Dynamic 10 Year Financial ...
The essential productive activity of the tourism industry, particularly as the consumption of experi... Read more

Bike Rental Company – 5 Year Financial Model
Financial Model providing an advanced 5-year financial plan for a startup or operating Bike Rental C... Read more

Tour Operator Financial Model – 5 Year Finan...
Financial Model providing an advanced 5-year financial plan for a startup or operating Tour Operator... Read more
You must log in to submit a review.