
0 ITEMS

Financial Advisors Agency Financial Model Excel Template
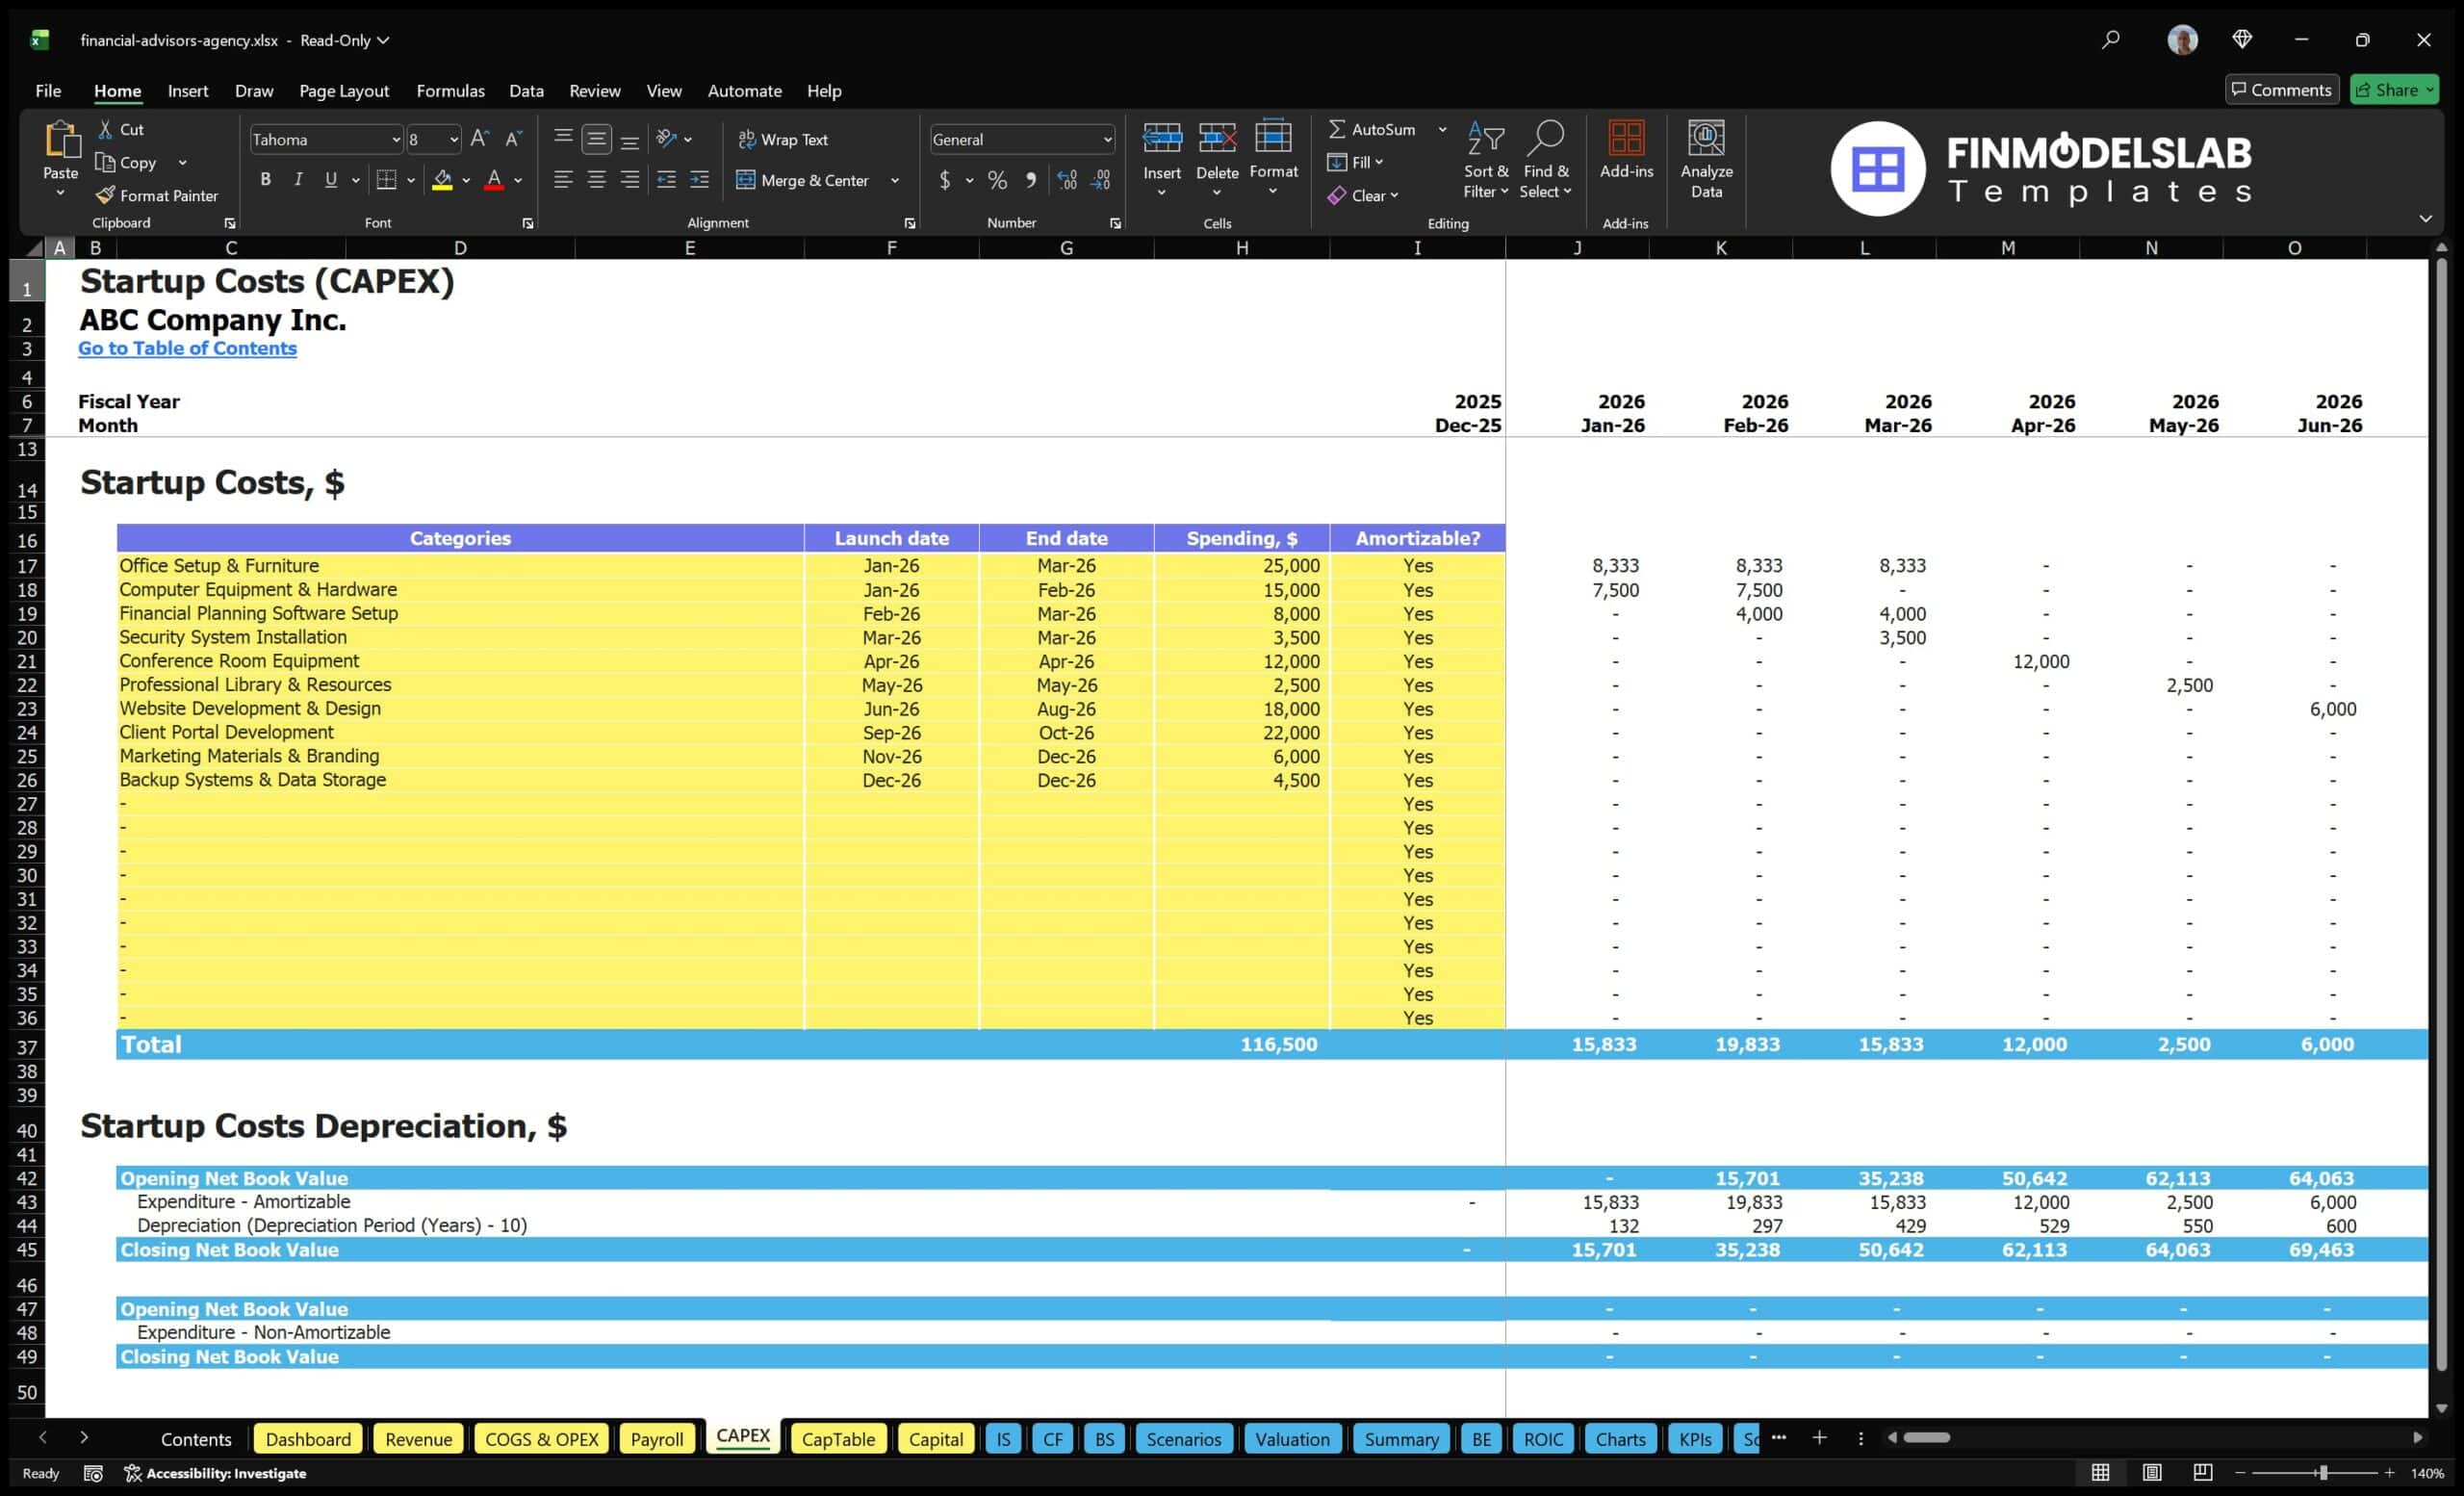
The Financial Advisor Financial Model is a ready-to-use financial model template built for planning, launching, managing, or expanding a financial advisory practice. It helps users translate advisory services, client acquisition goals, hourly rates, investment management fees, staffing plans, startup costs, and operating expenses into a structured five-year forecast. Instead of starting with a blank spreadsheet, entrepreneurs, business owners, consultants, analysts, founders, and finance professionals can work from an editable model designed around the revenue and cost drivers of a wealth management or financial advisory firm. This template supports practical financial planning by connecting revenue assumptions with the expenses required to operate the business. Users can estimate client growth, pricing, billable hours, customer acquisition costs, payroll, marketing spend, technology costs, office expenses, and other recurring costs to understand how the practice may perform over time. It also helps clarify the startup investment needed before launch, including setup costs, digital tools, professional services, and working capital requirements. With these assumptions organized in one model, users can test whether their plan is realistic, scalable, and financially sustainable. The Financial Advisor Financial Model is especially useful for business plans, funding documents, investor discussions, lender reviews, internal budgeting, and strategic decision-making. It includes forecast logic for revenue, profitability, cash flow, break-even analysis, scenario planning, dashboards, charts, and key performance metrics, giving users a more complete view of the advisory firm’s financial outlook. The model can help answer important questions such as how many clients are needed to cover costs, how pricing affects margins, how quickly the business may become profitable, and how much capital may be required to support growth. Because the template is fully editable, users can customize assumptions to match a fee-only advisor, wealth management firm, independent financial planner, investment advisory practice, or consulting-led advisory model. It works in Excel and Google Sheets, making it easy to update, share, and present. Whether preparing a new financial advisory business plan, reviewing expansion opportunities, or building investor-ready financial projections, this financial model template provides a structured, time-saving way to evaluate the numbers behind the business and make more confident decisions.
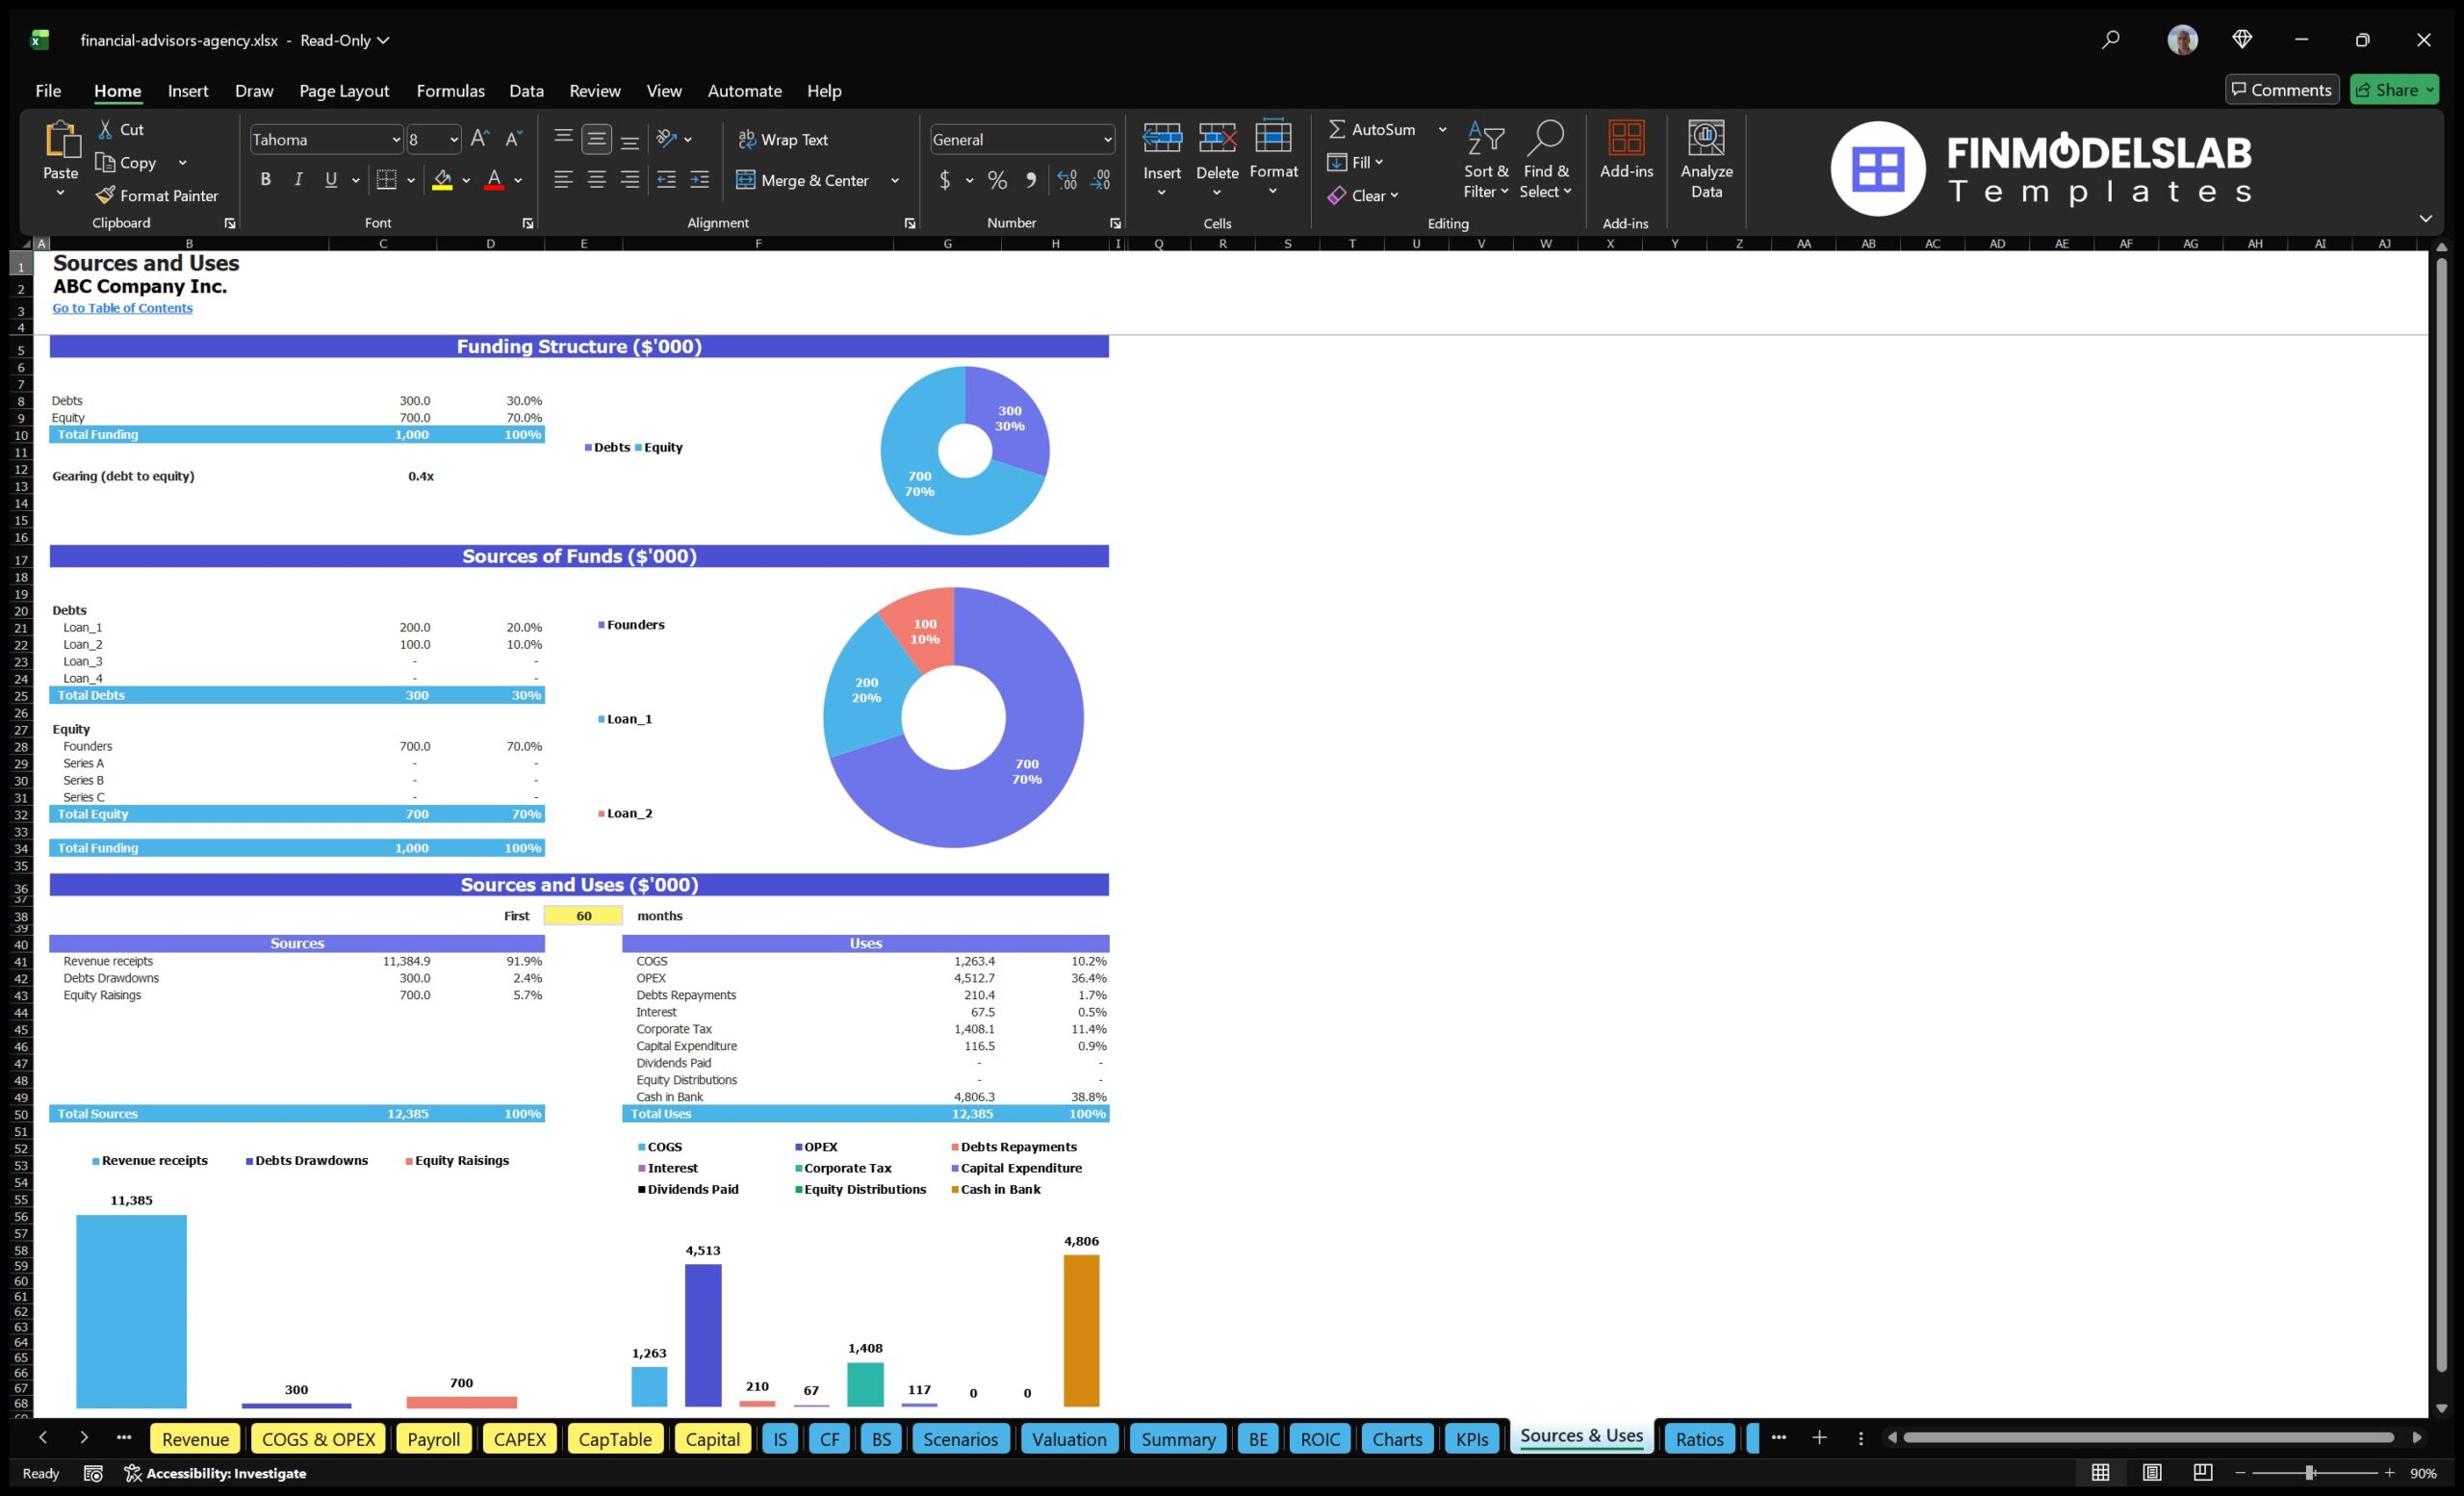
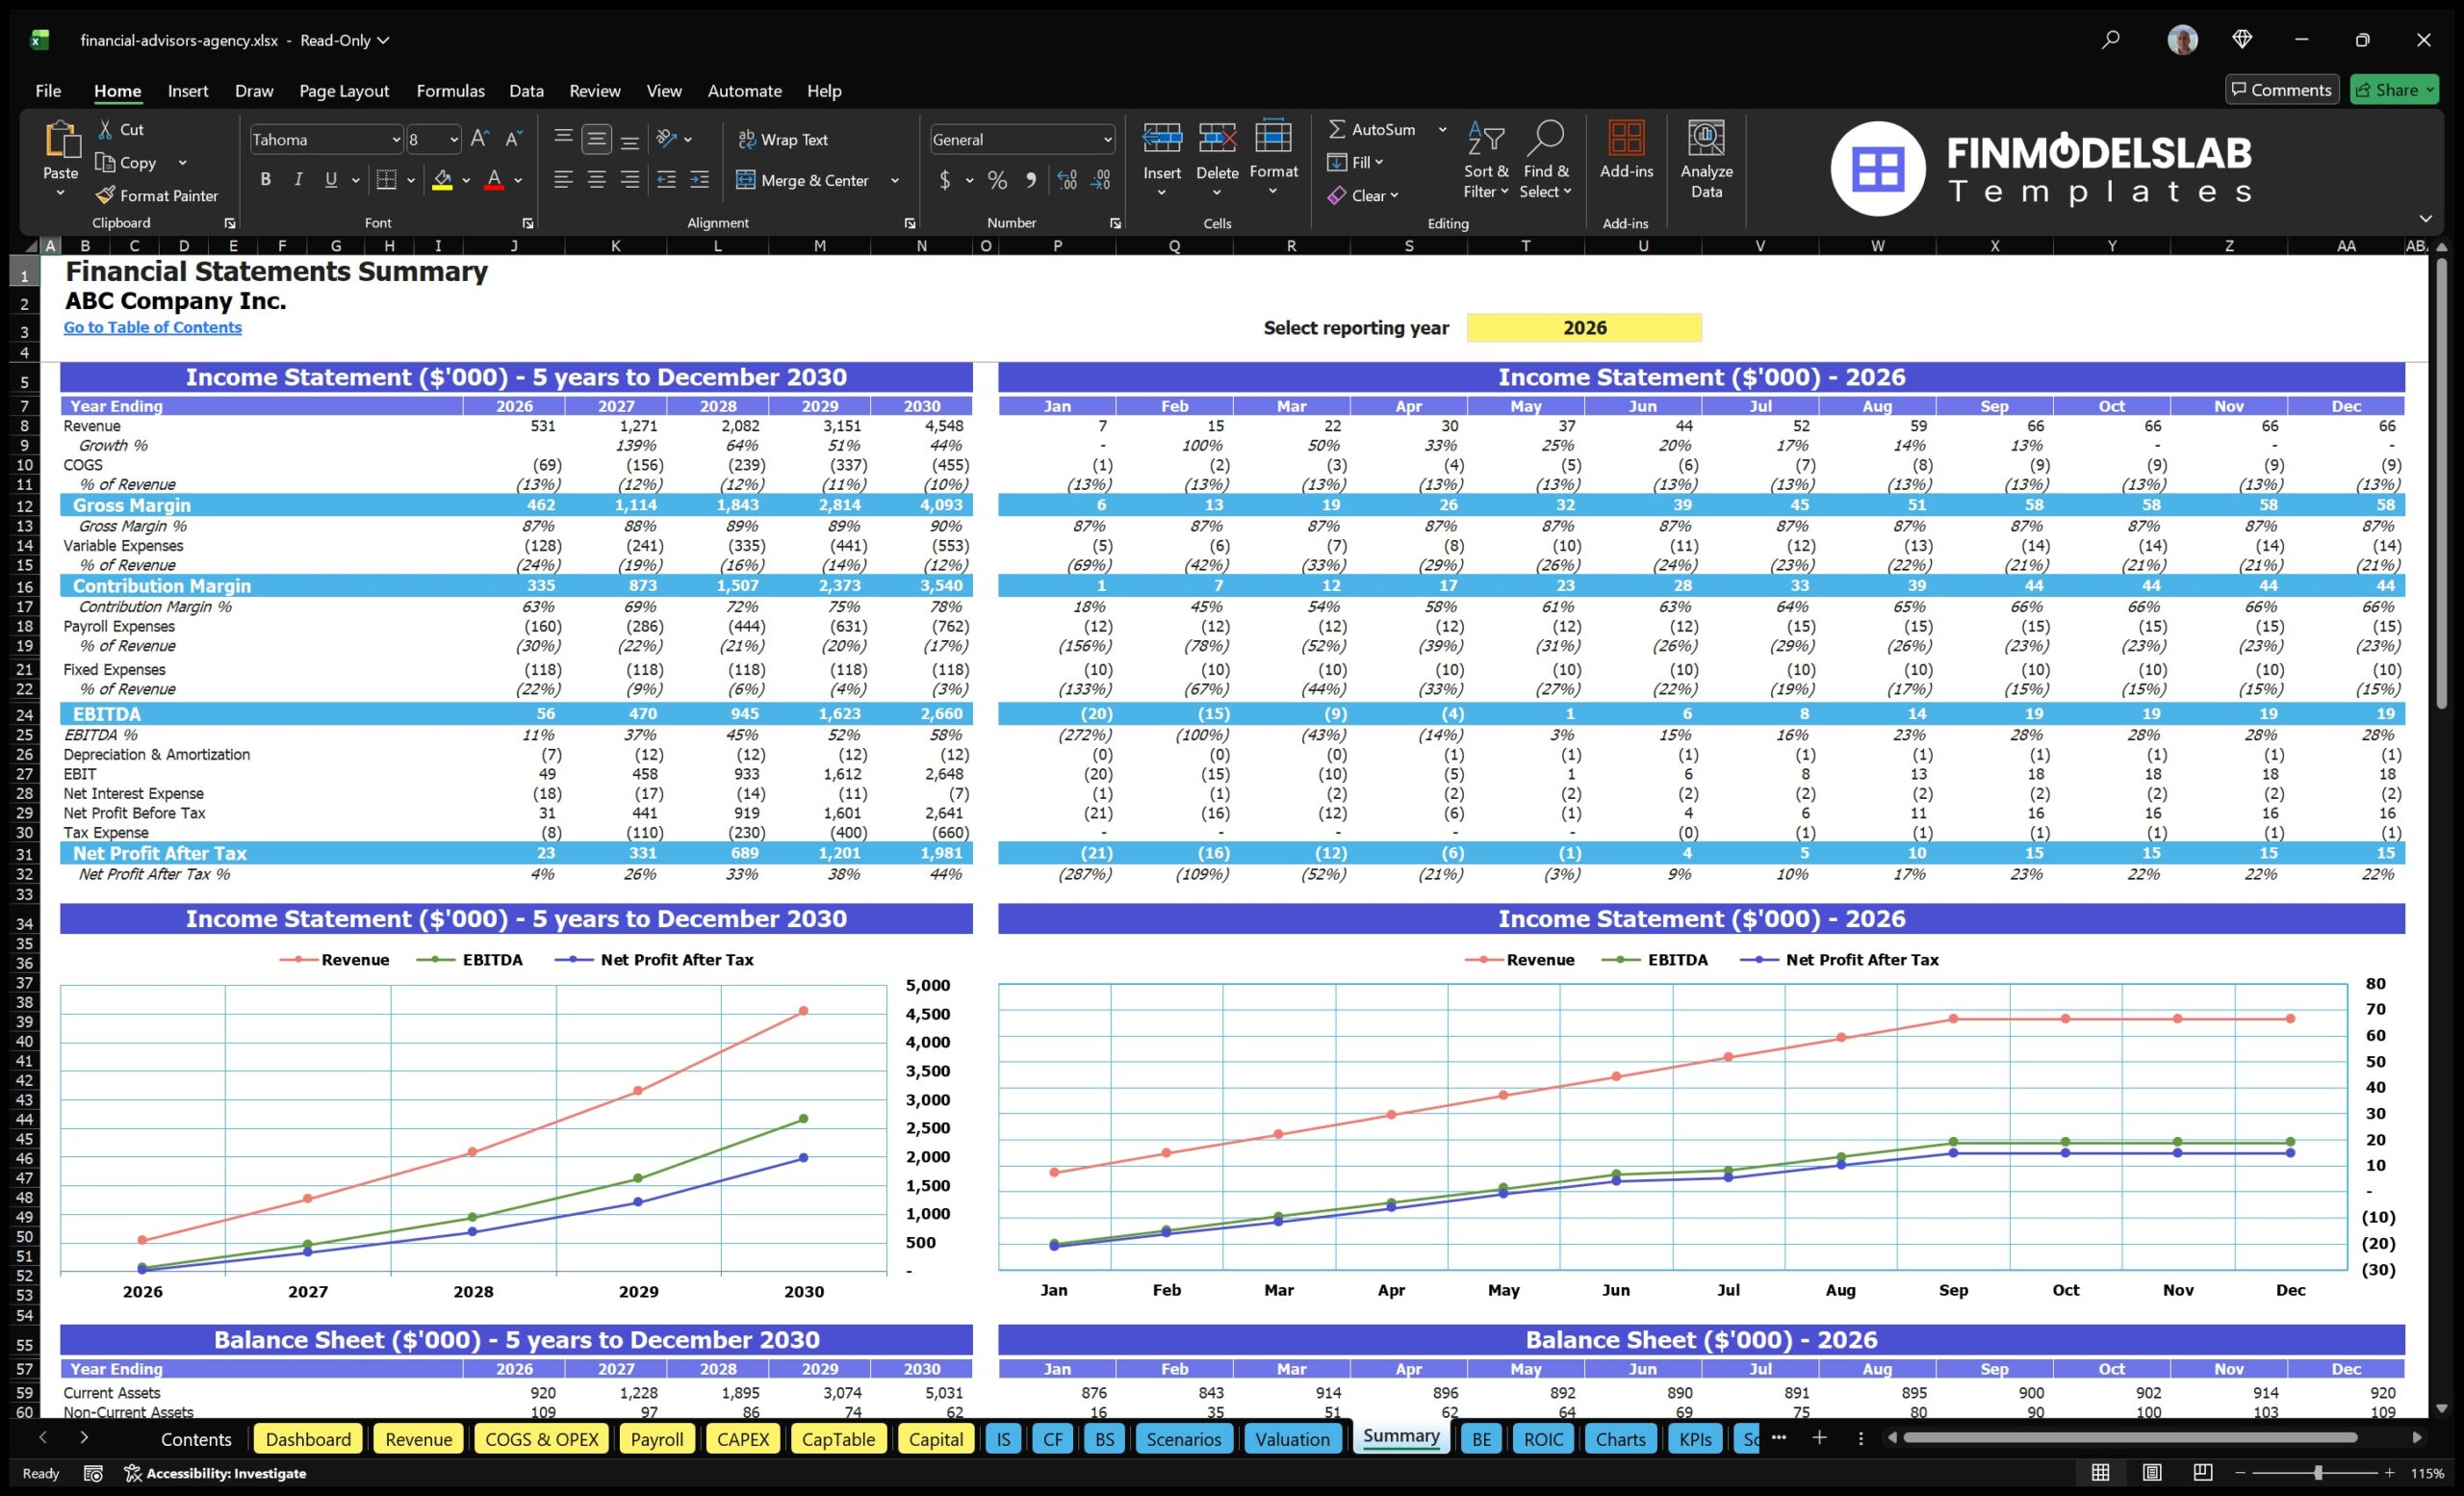
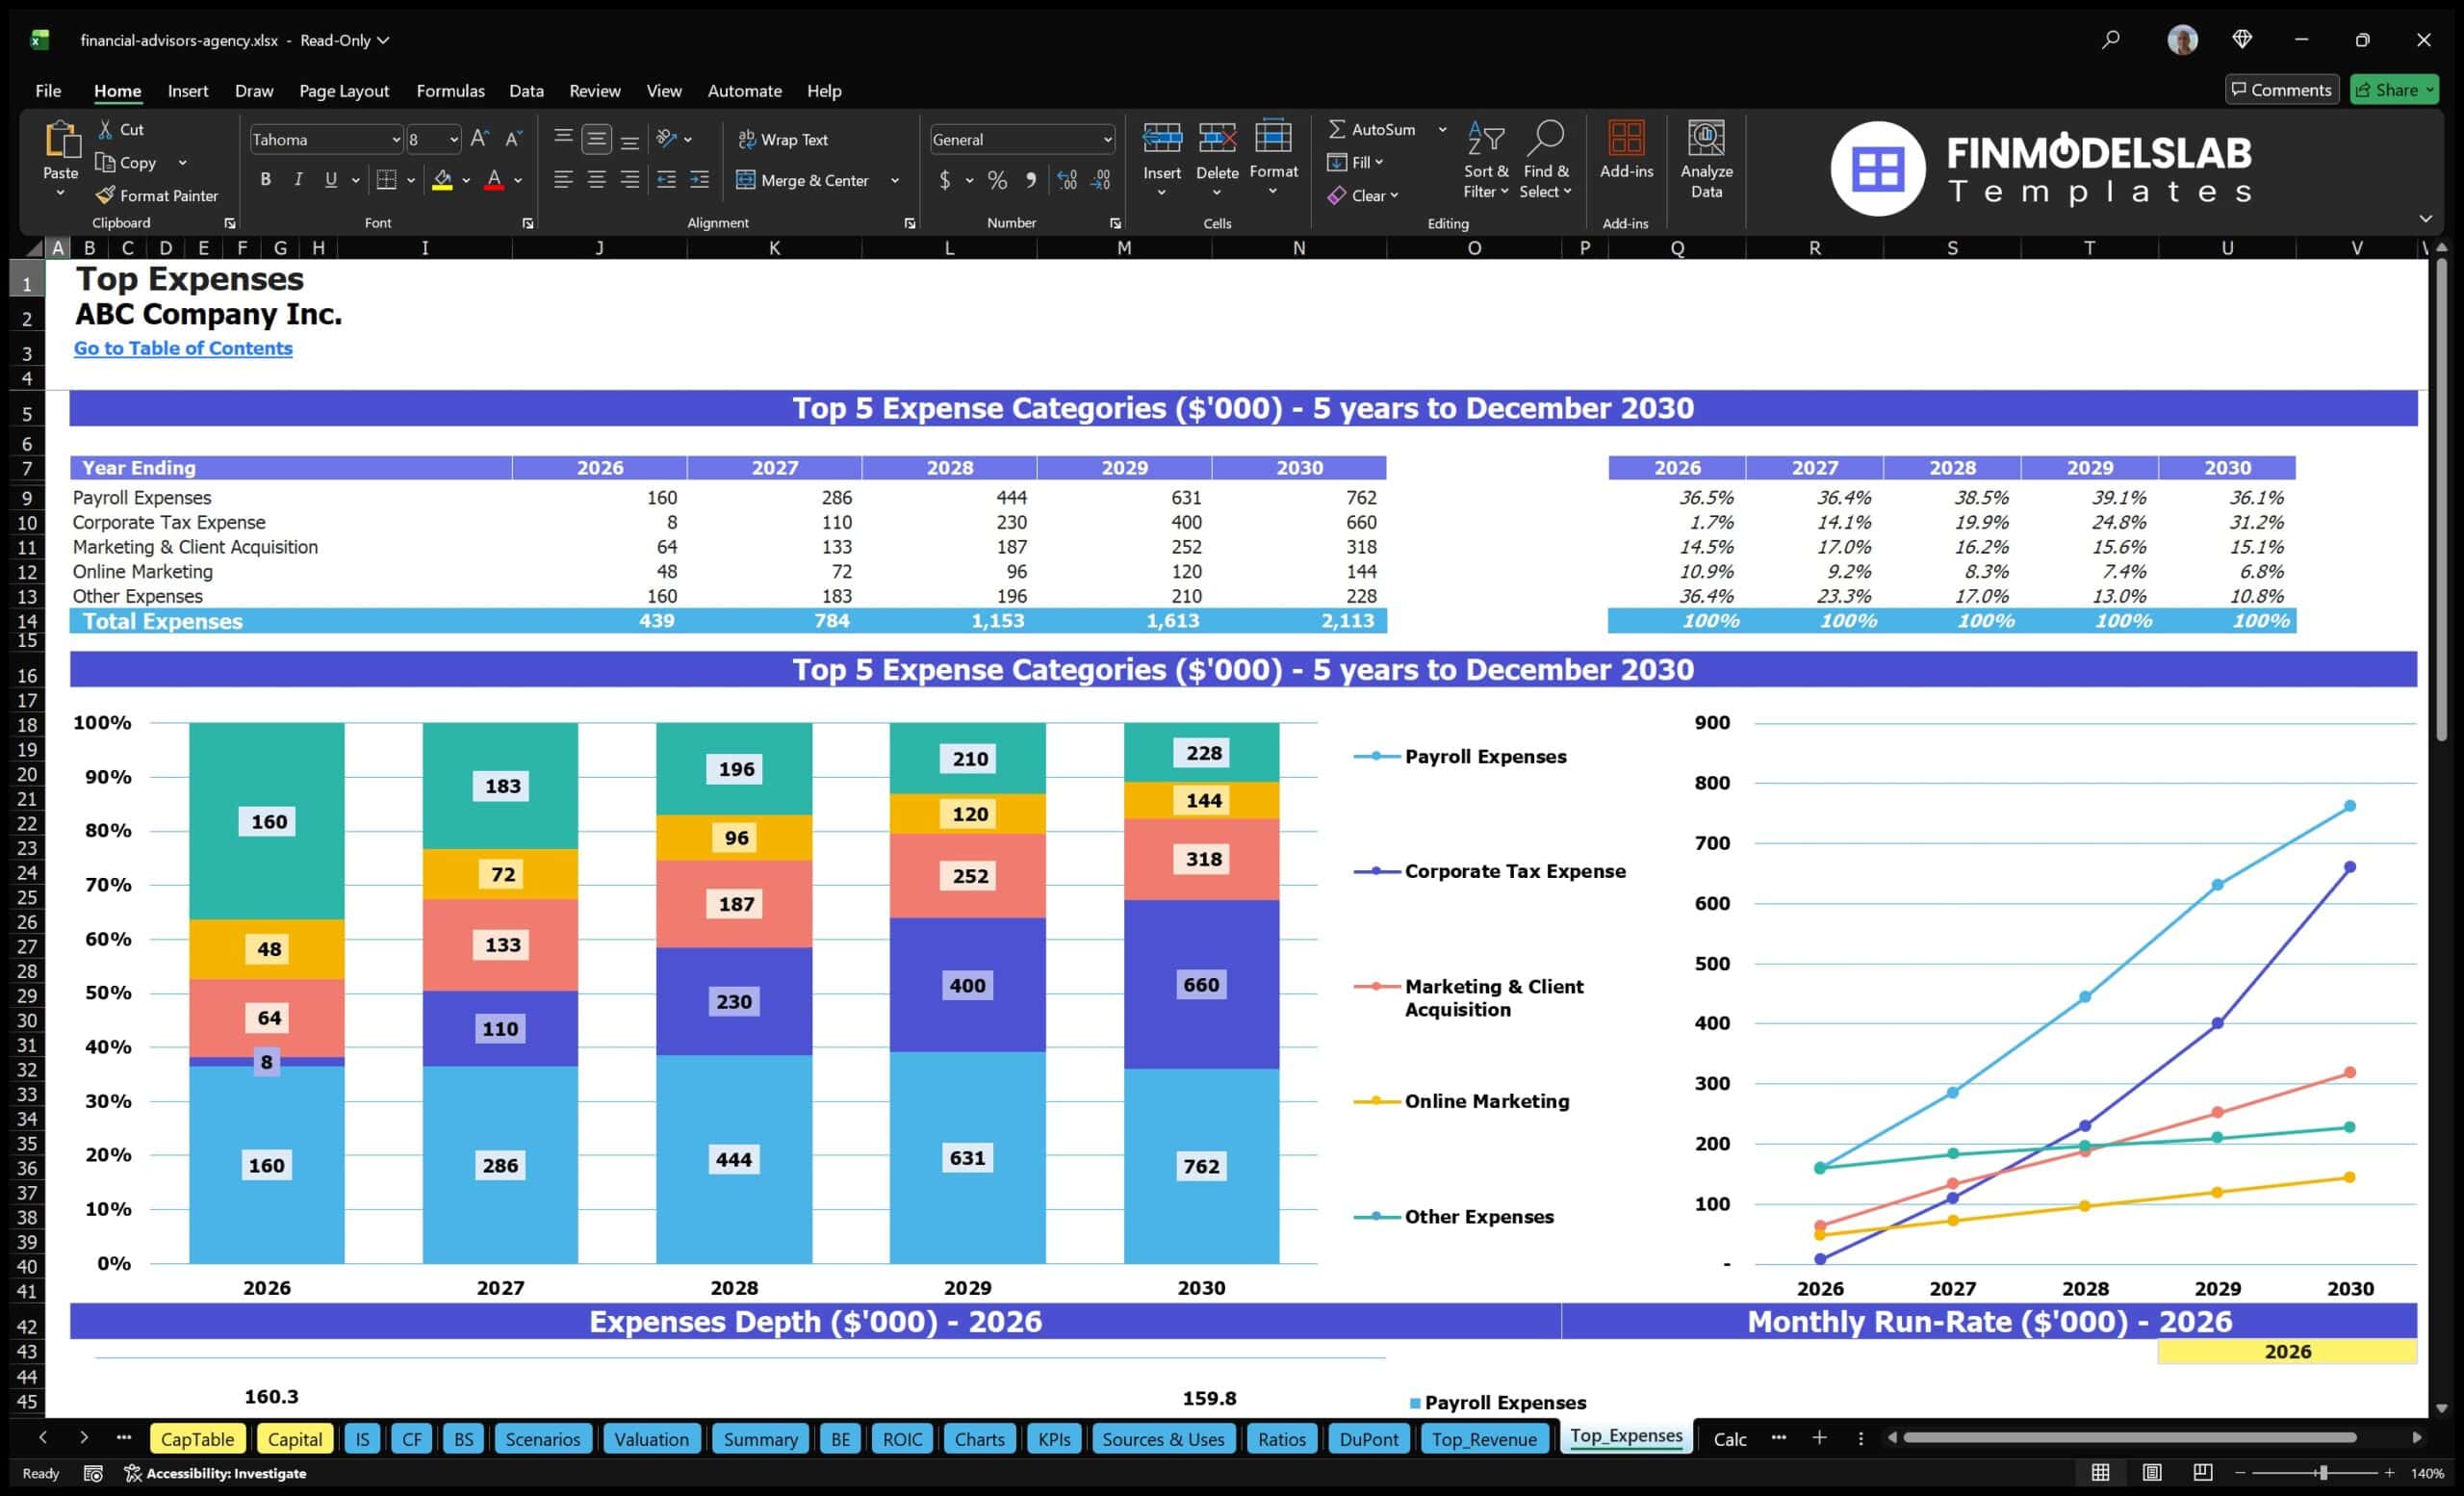
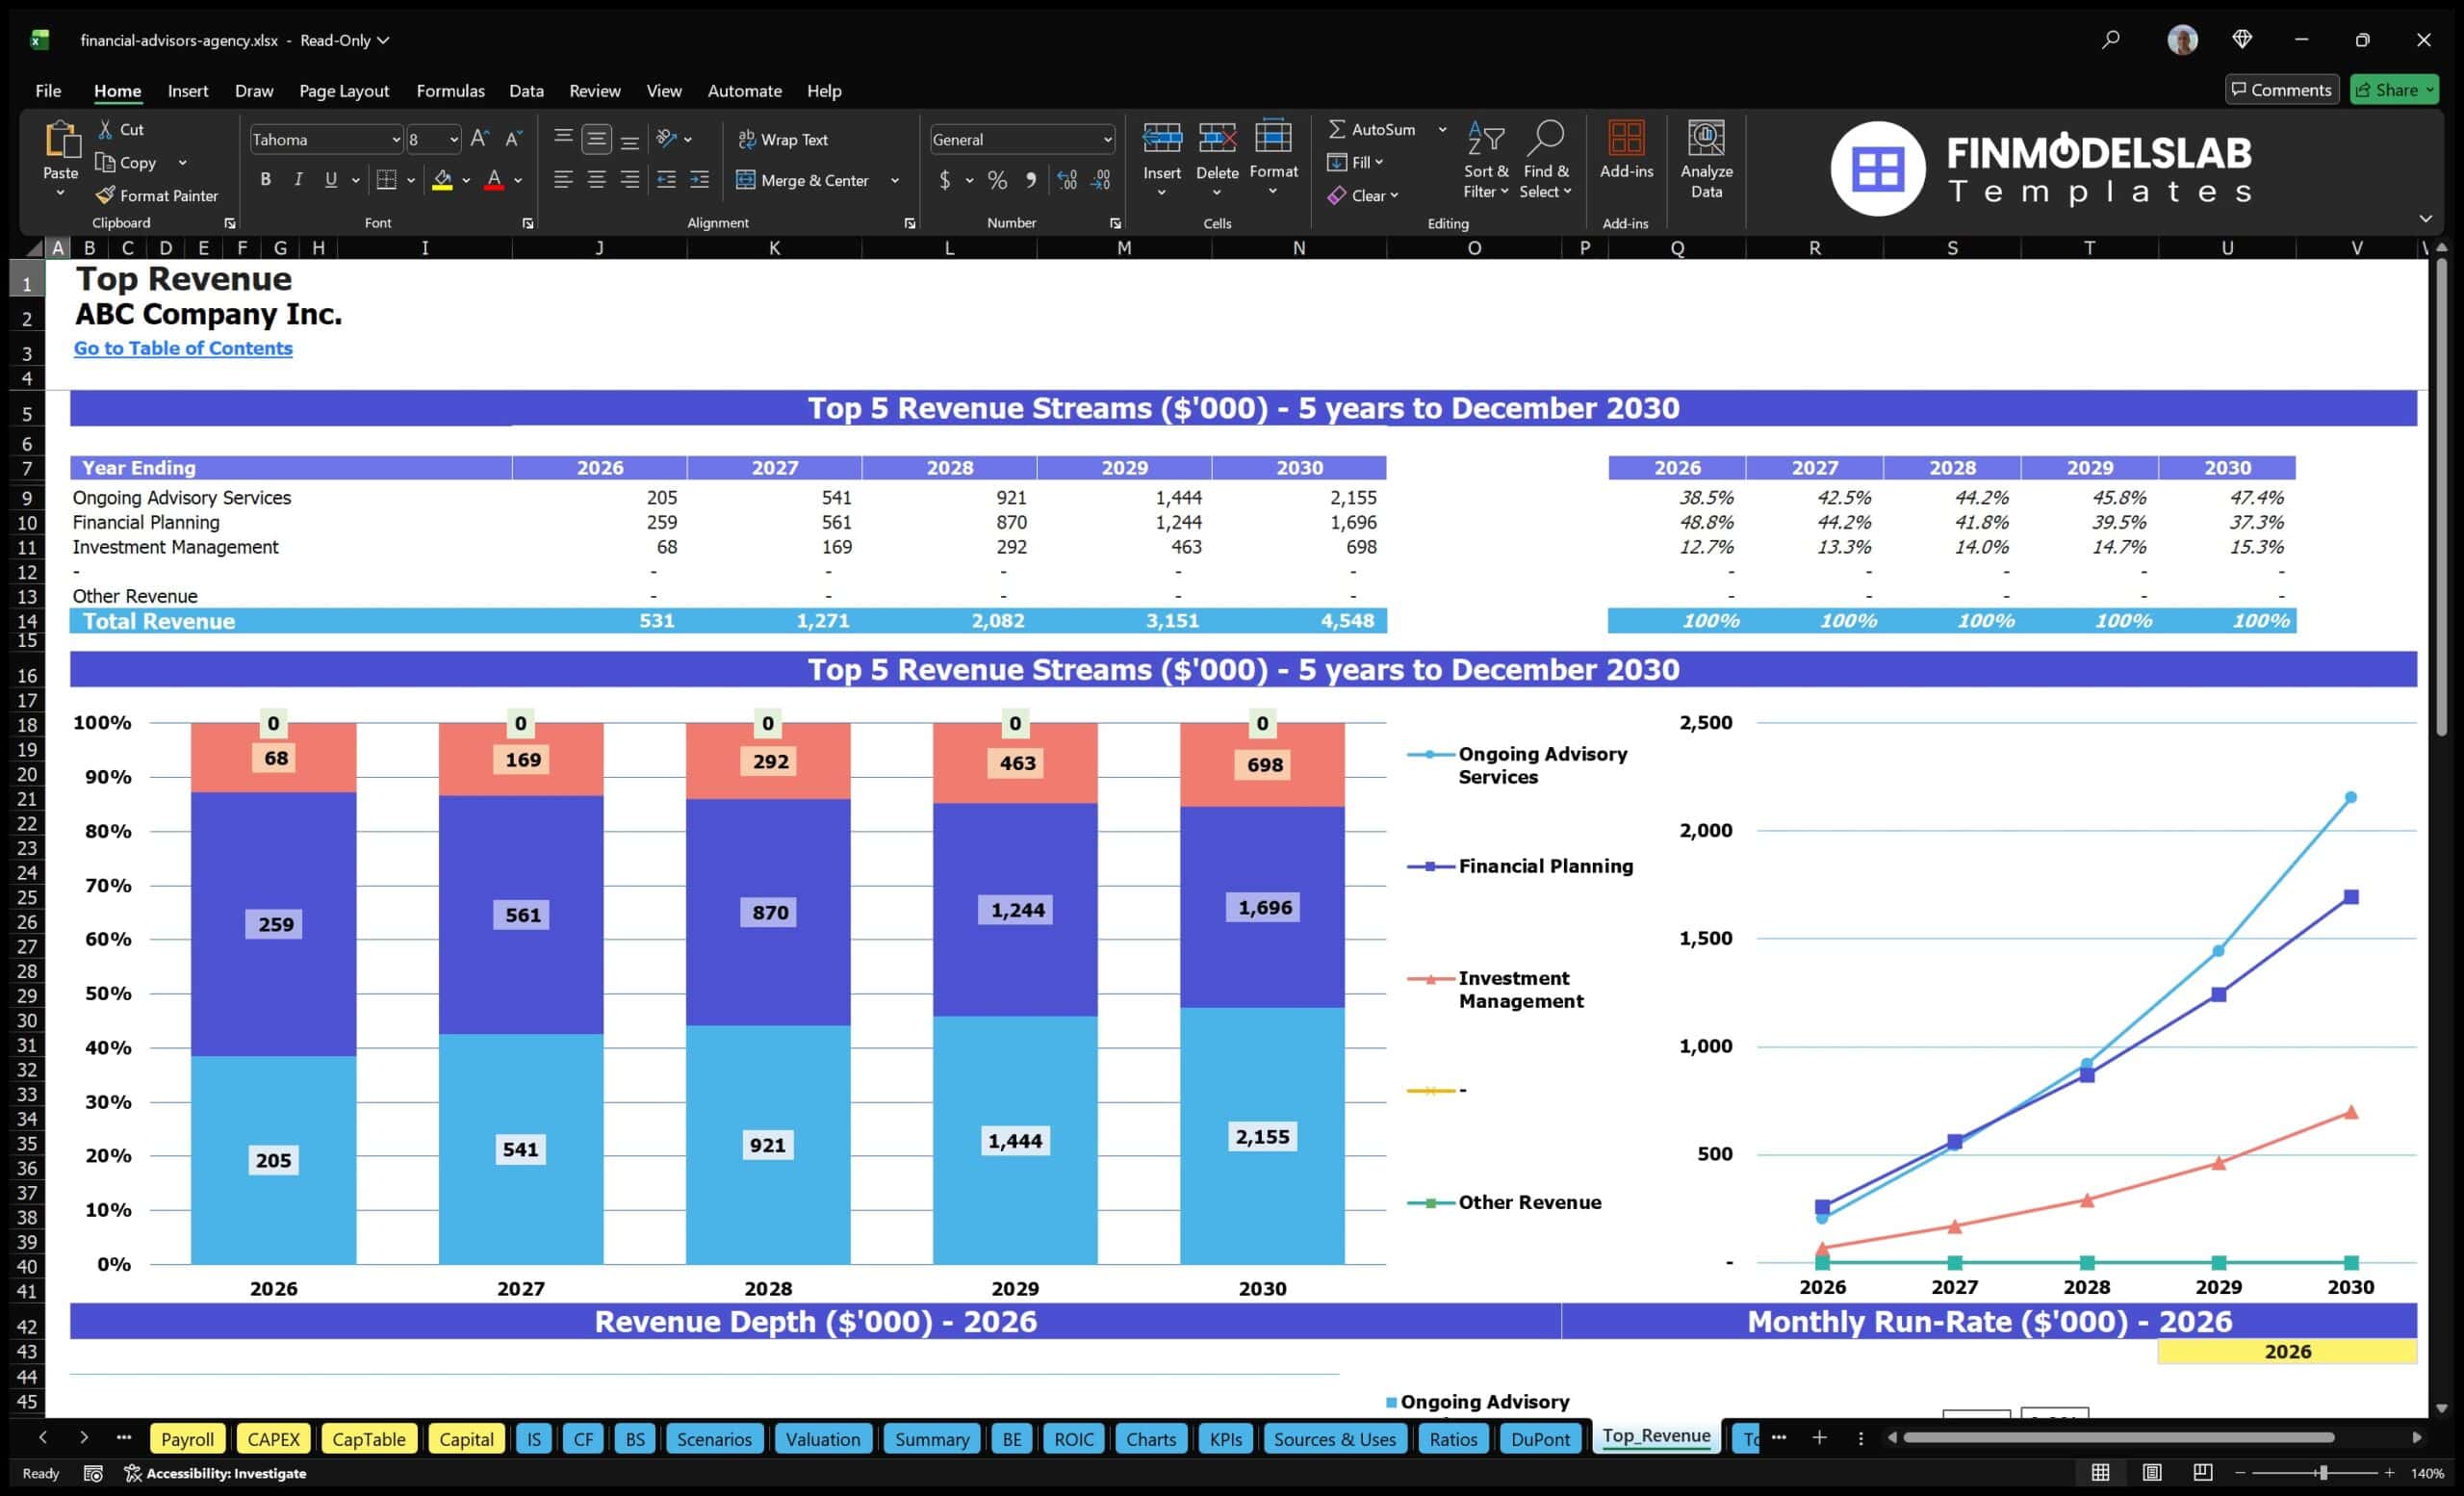
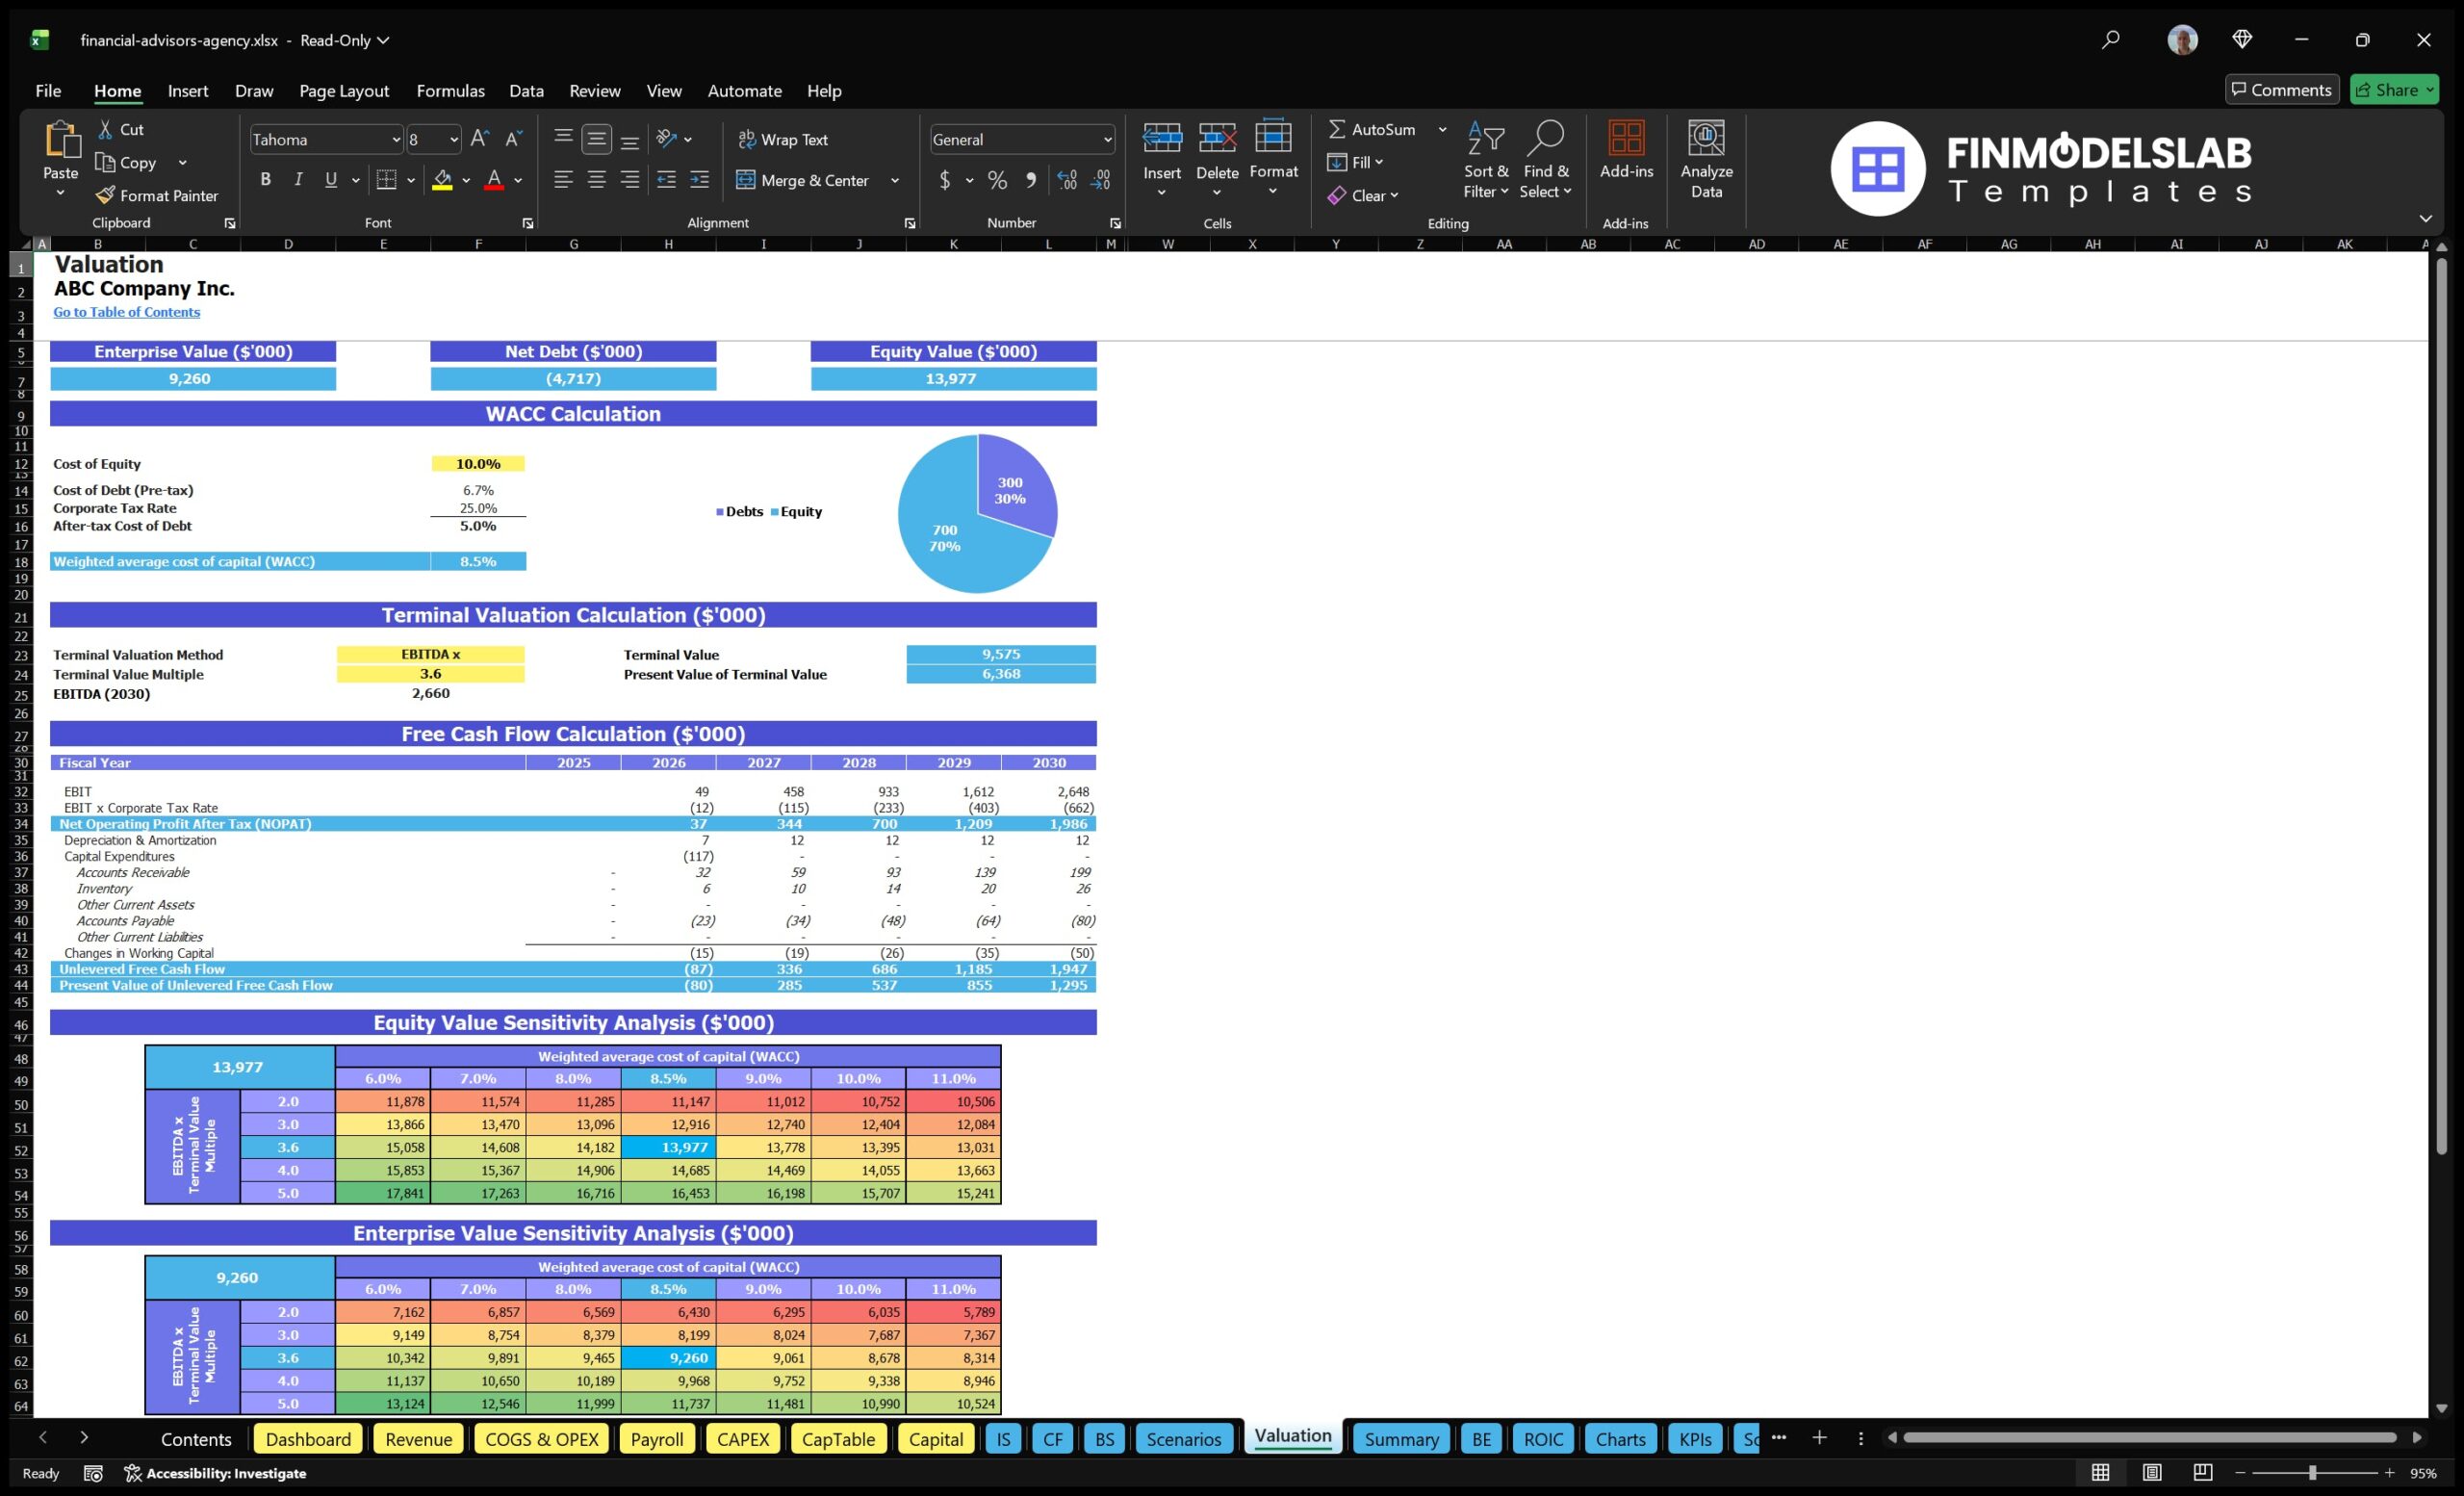
Financial Model Overview
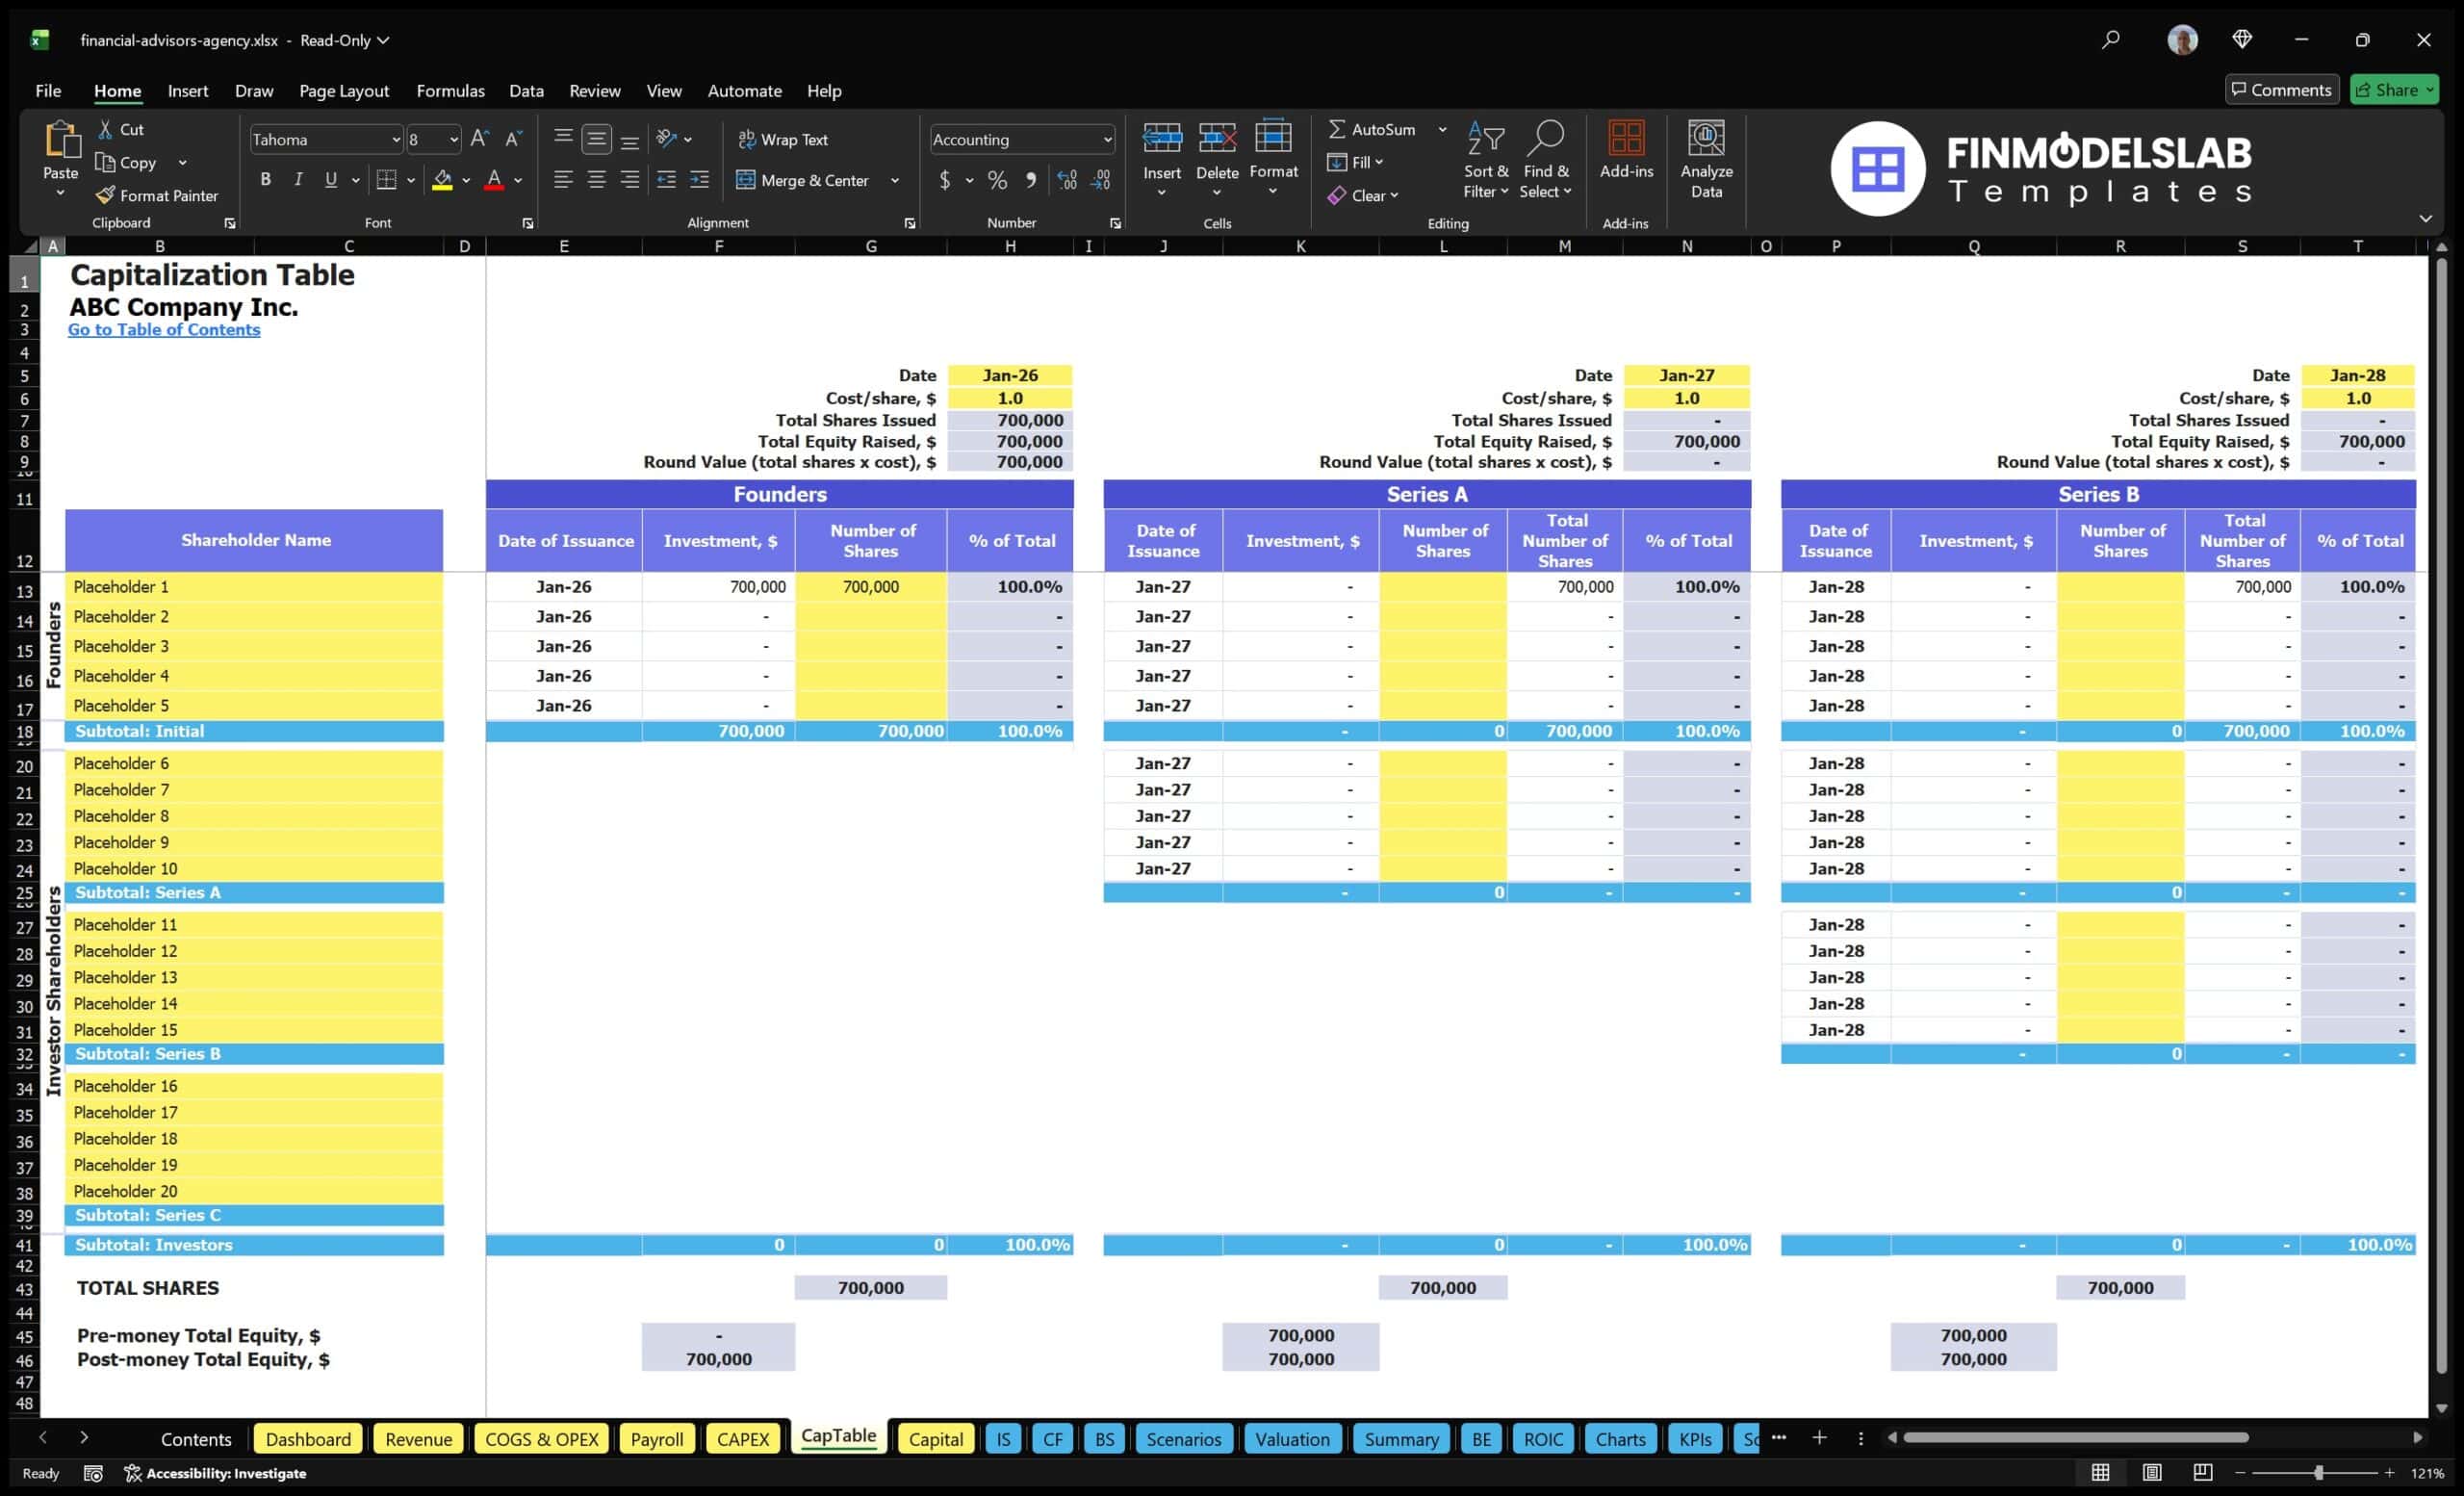
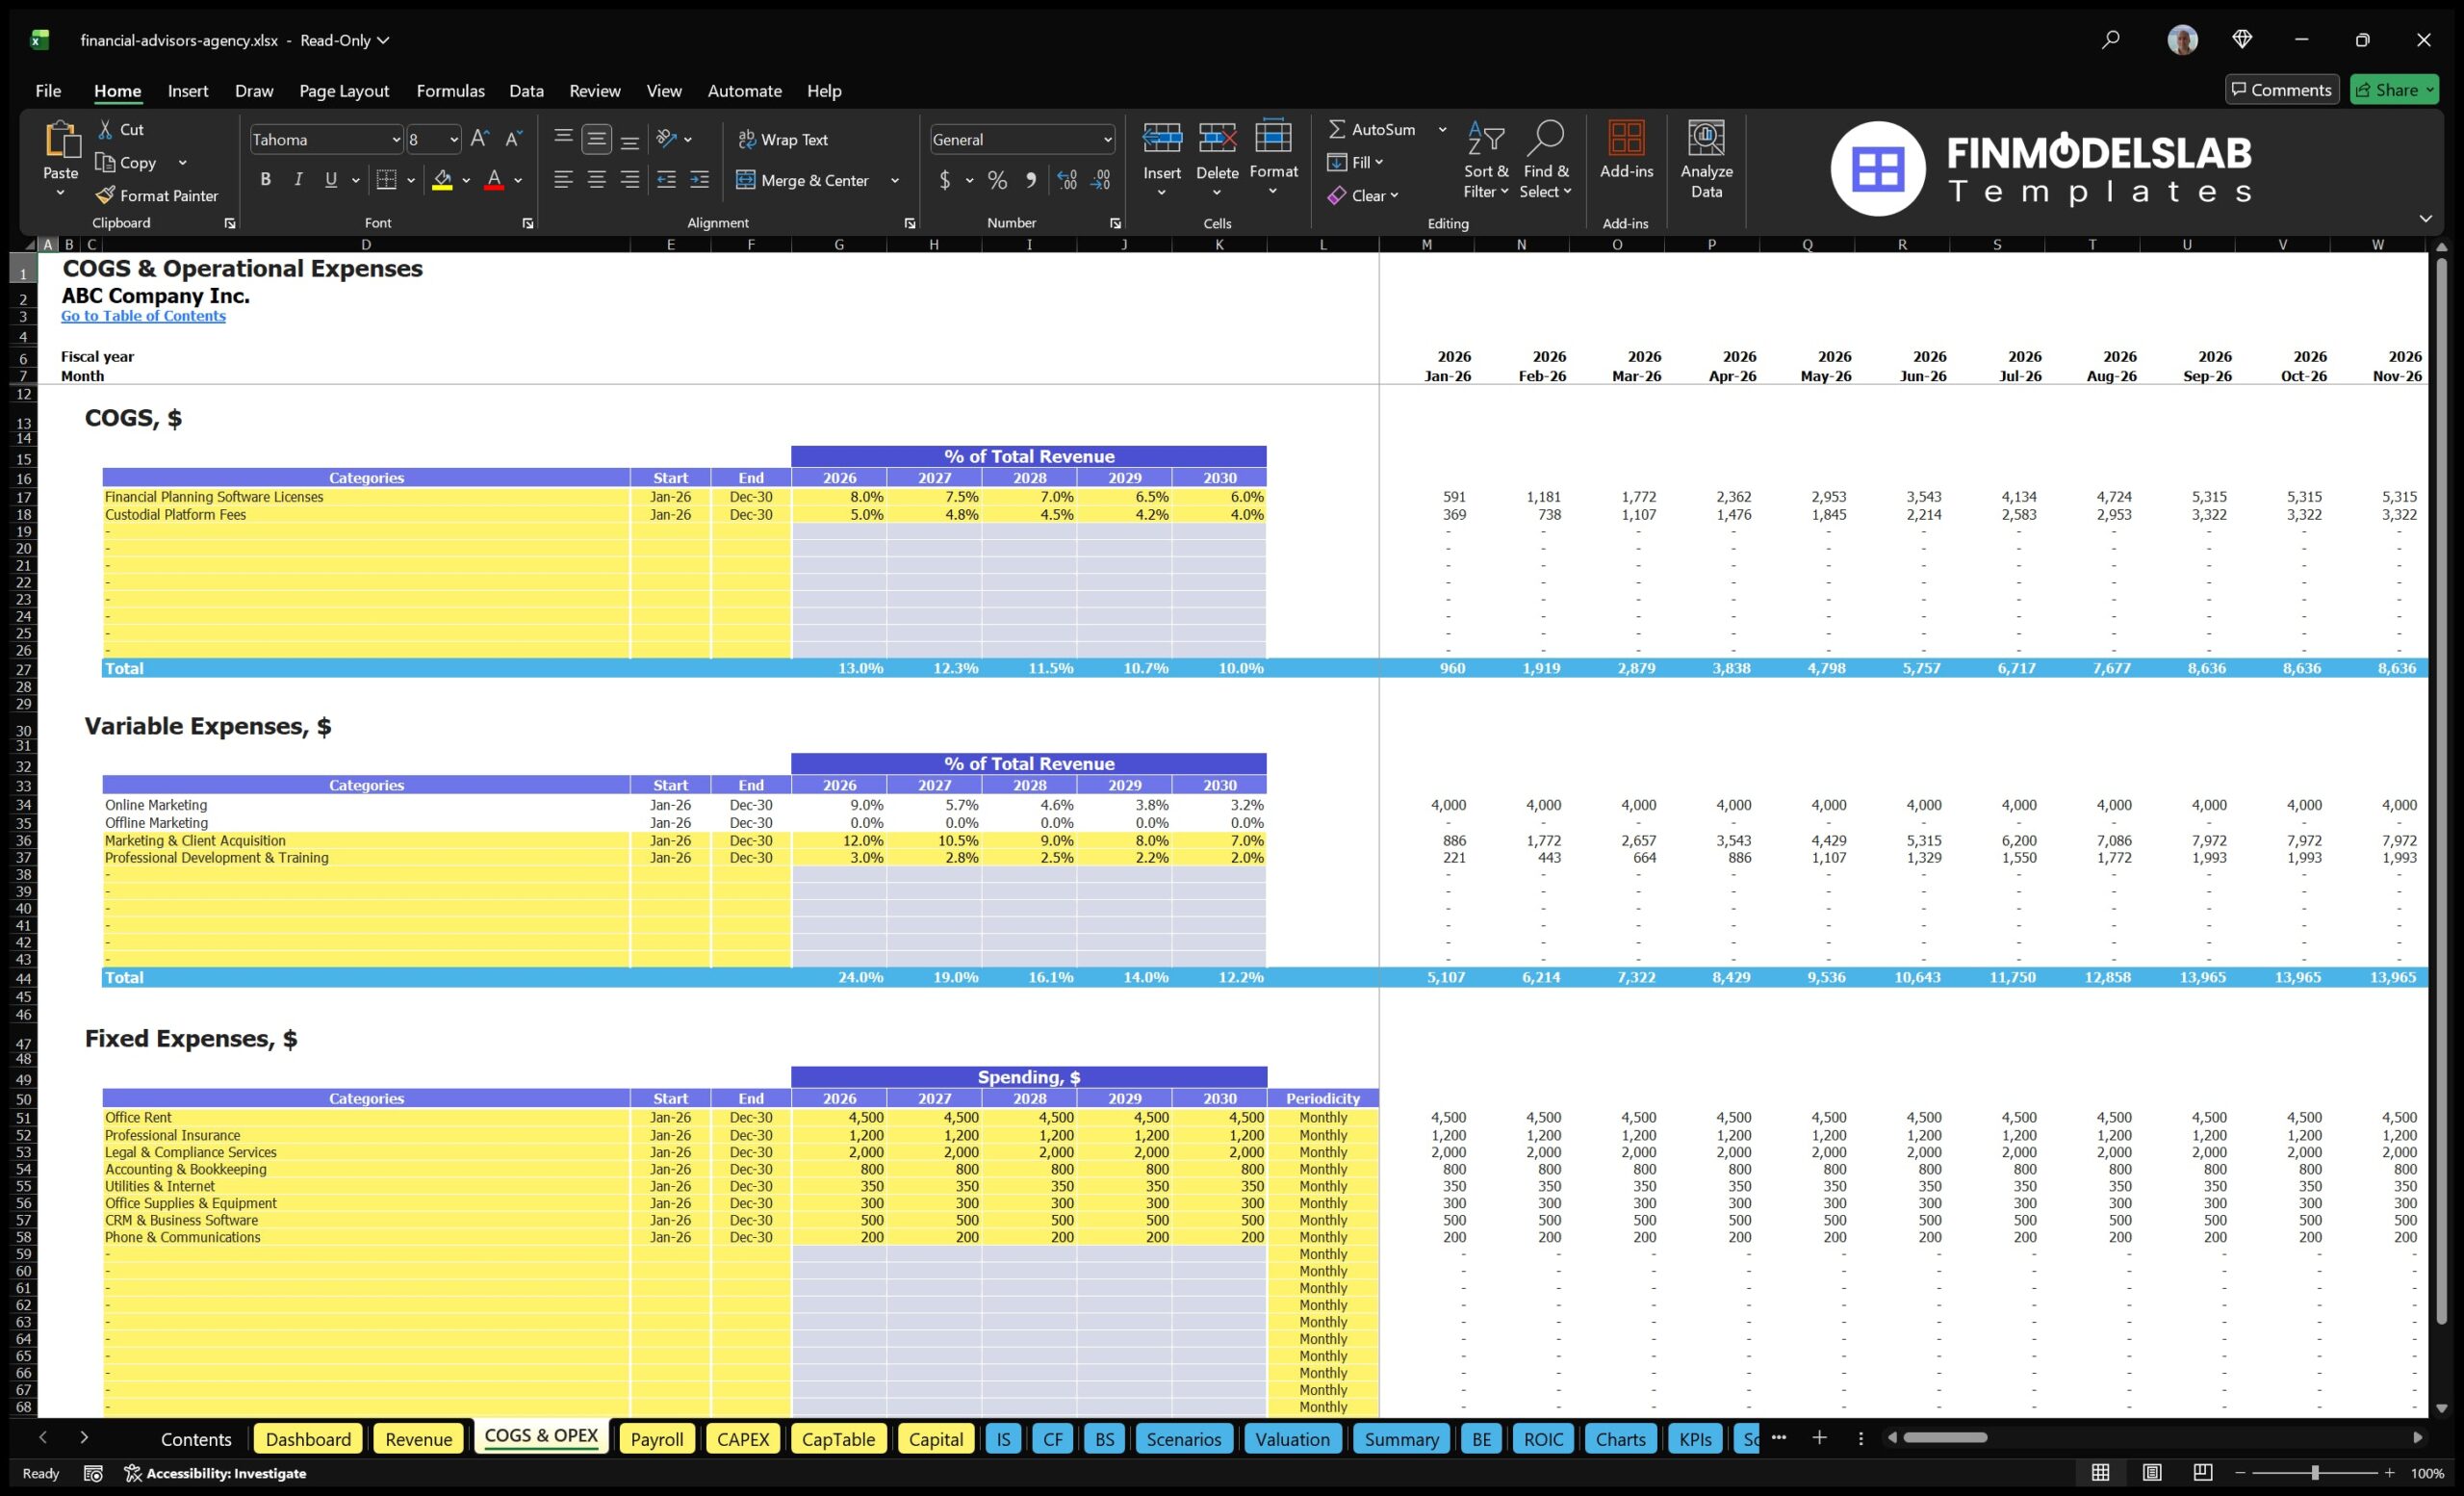
The Financial Advisor Financial Model is a ready-to-use financial model template designed to help financial advisors, wealth managers, independent planners, consultants, entrepreneurs, and analysts build a structured forecast for an advisory practice. It brings together the key assumptions behind client acquisition, service pricing, billable hours, investment management revenue, operating expenses, payroll, startup investment, cash flow, profitability, and funding needs in one organized workbook. Instead of building formulas and reports from scratch, users can begin with an editable model tailored to the economics of a financial advisory firm and then adjust the assumptions to match their own business plan. This makes the template useful for launching a new advisory practice, preparing a financial advisory business plan, raising capital, applying for financing, reviewing strategic scenarios, or presenting professional projections to partners, investors, lenders, and stakeholders.
All-in-One Dashboard
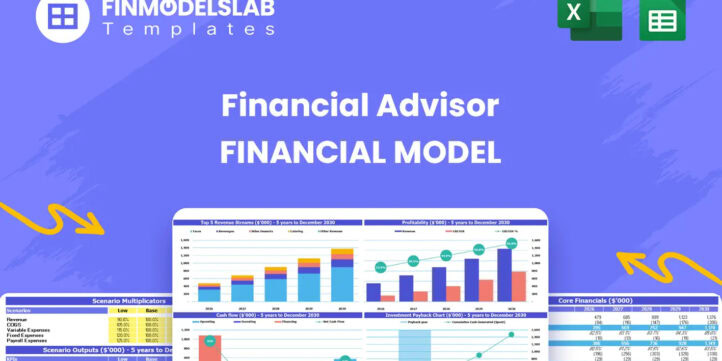
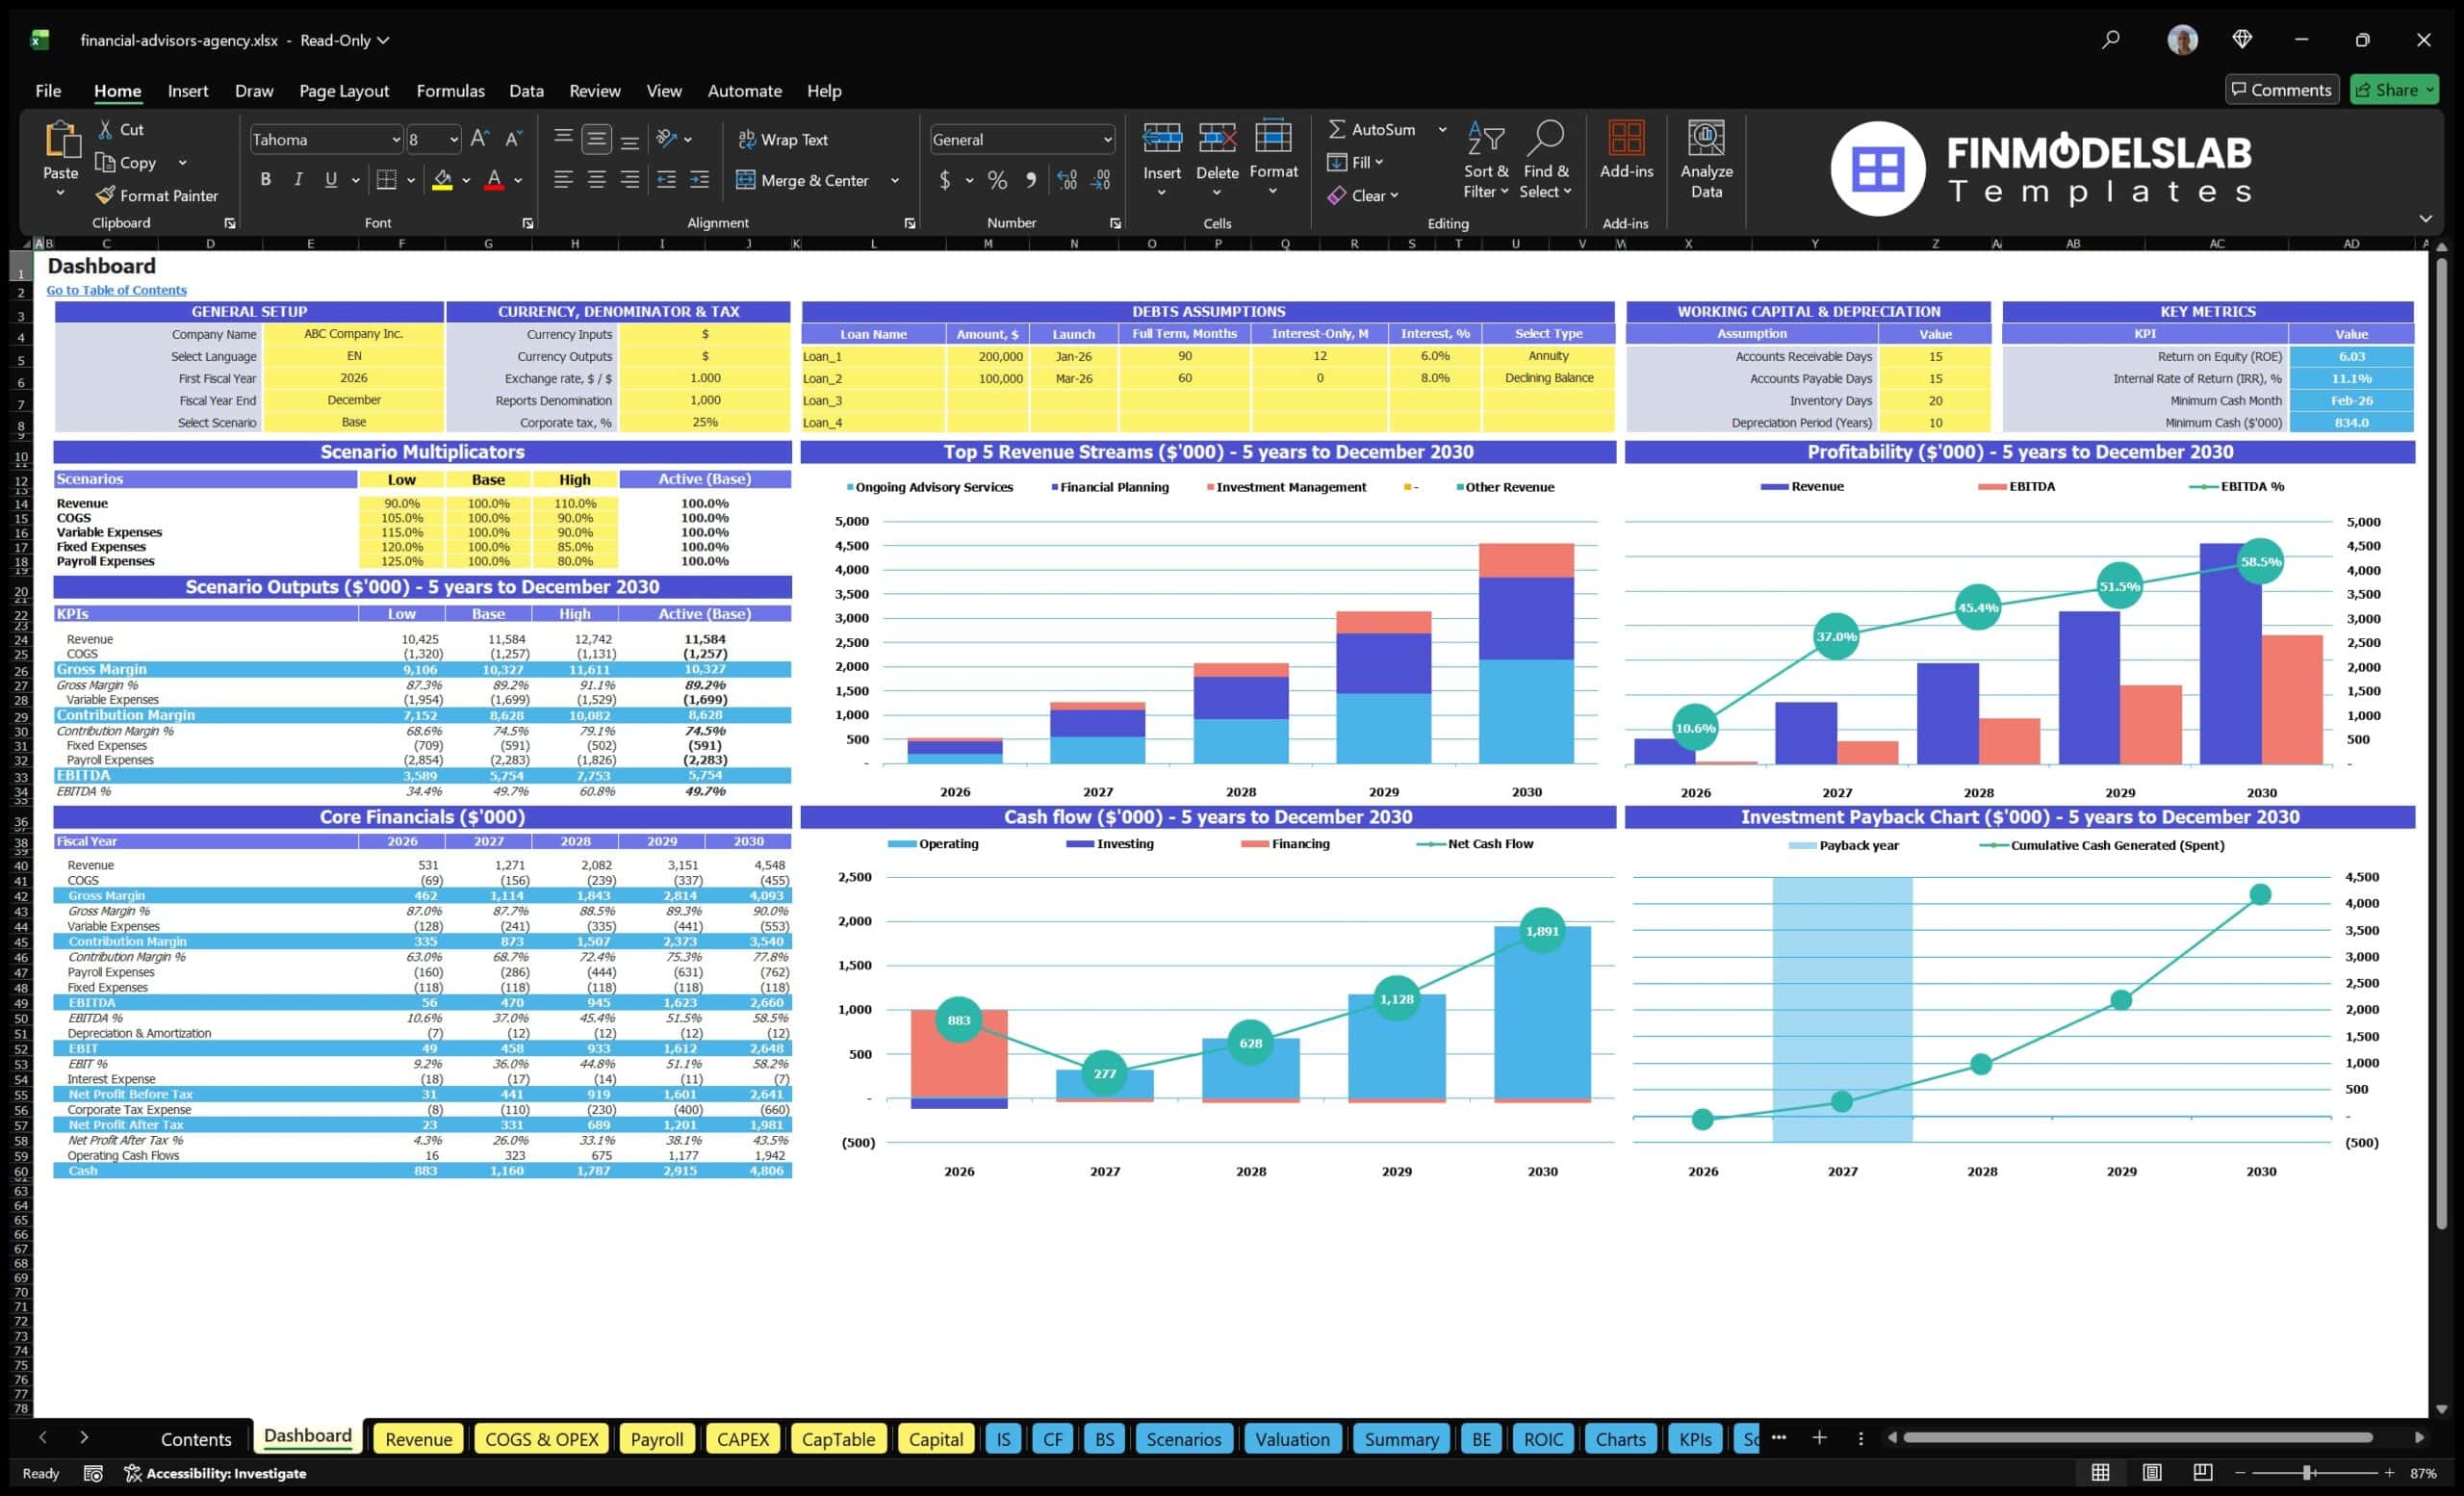
The all-in-one dashboard gives users a centralized view of the most important inputs and outputs in the Financial Advisor Financial Model. It is designed to connect the major assumptions of the advisory practice with the resulting financial projections, so users can quickly review revenue, expenses, profit, cash position, funding needs, and performance indicators without searching through multiple worksheets. Typical inputs may include starting clients, new client growth, service mix, pricing, billable hours, customer acquisition cost, payroll assumptions, marketing budget, office costs, technology expenses, and initial investment requirements. The dashboard then helps summarize outputs such as projected revenue, EBITDA, net income, cash balance, margins, and return metrics. For planning and decision-making, this section is valuable because it gives founders, advisors, consultants, and stakeholders a quick way to understand whether the business model is financially viable and where the most important planning levers are located.
Low, Base, and High Scenario Analysis
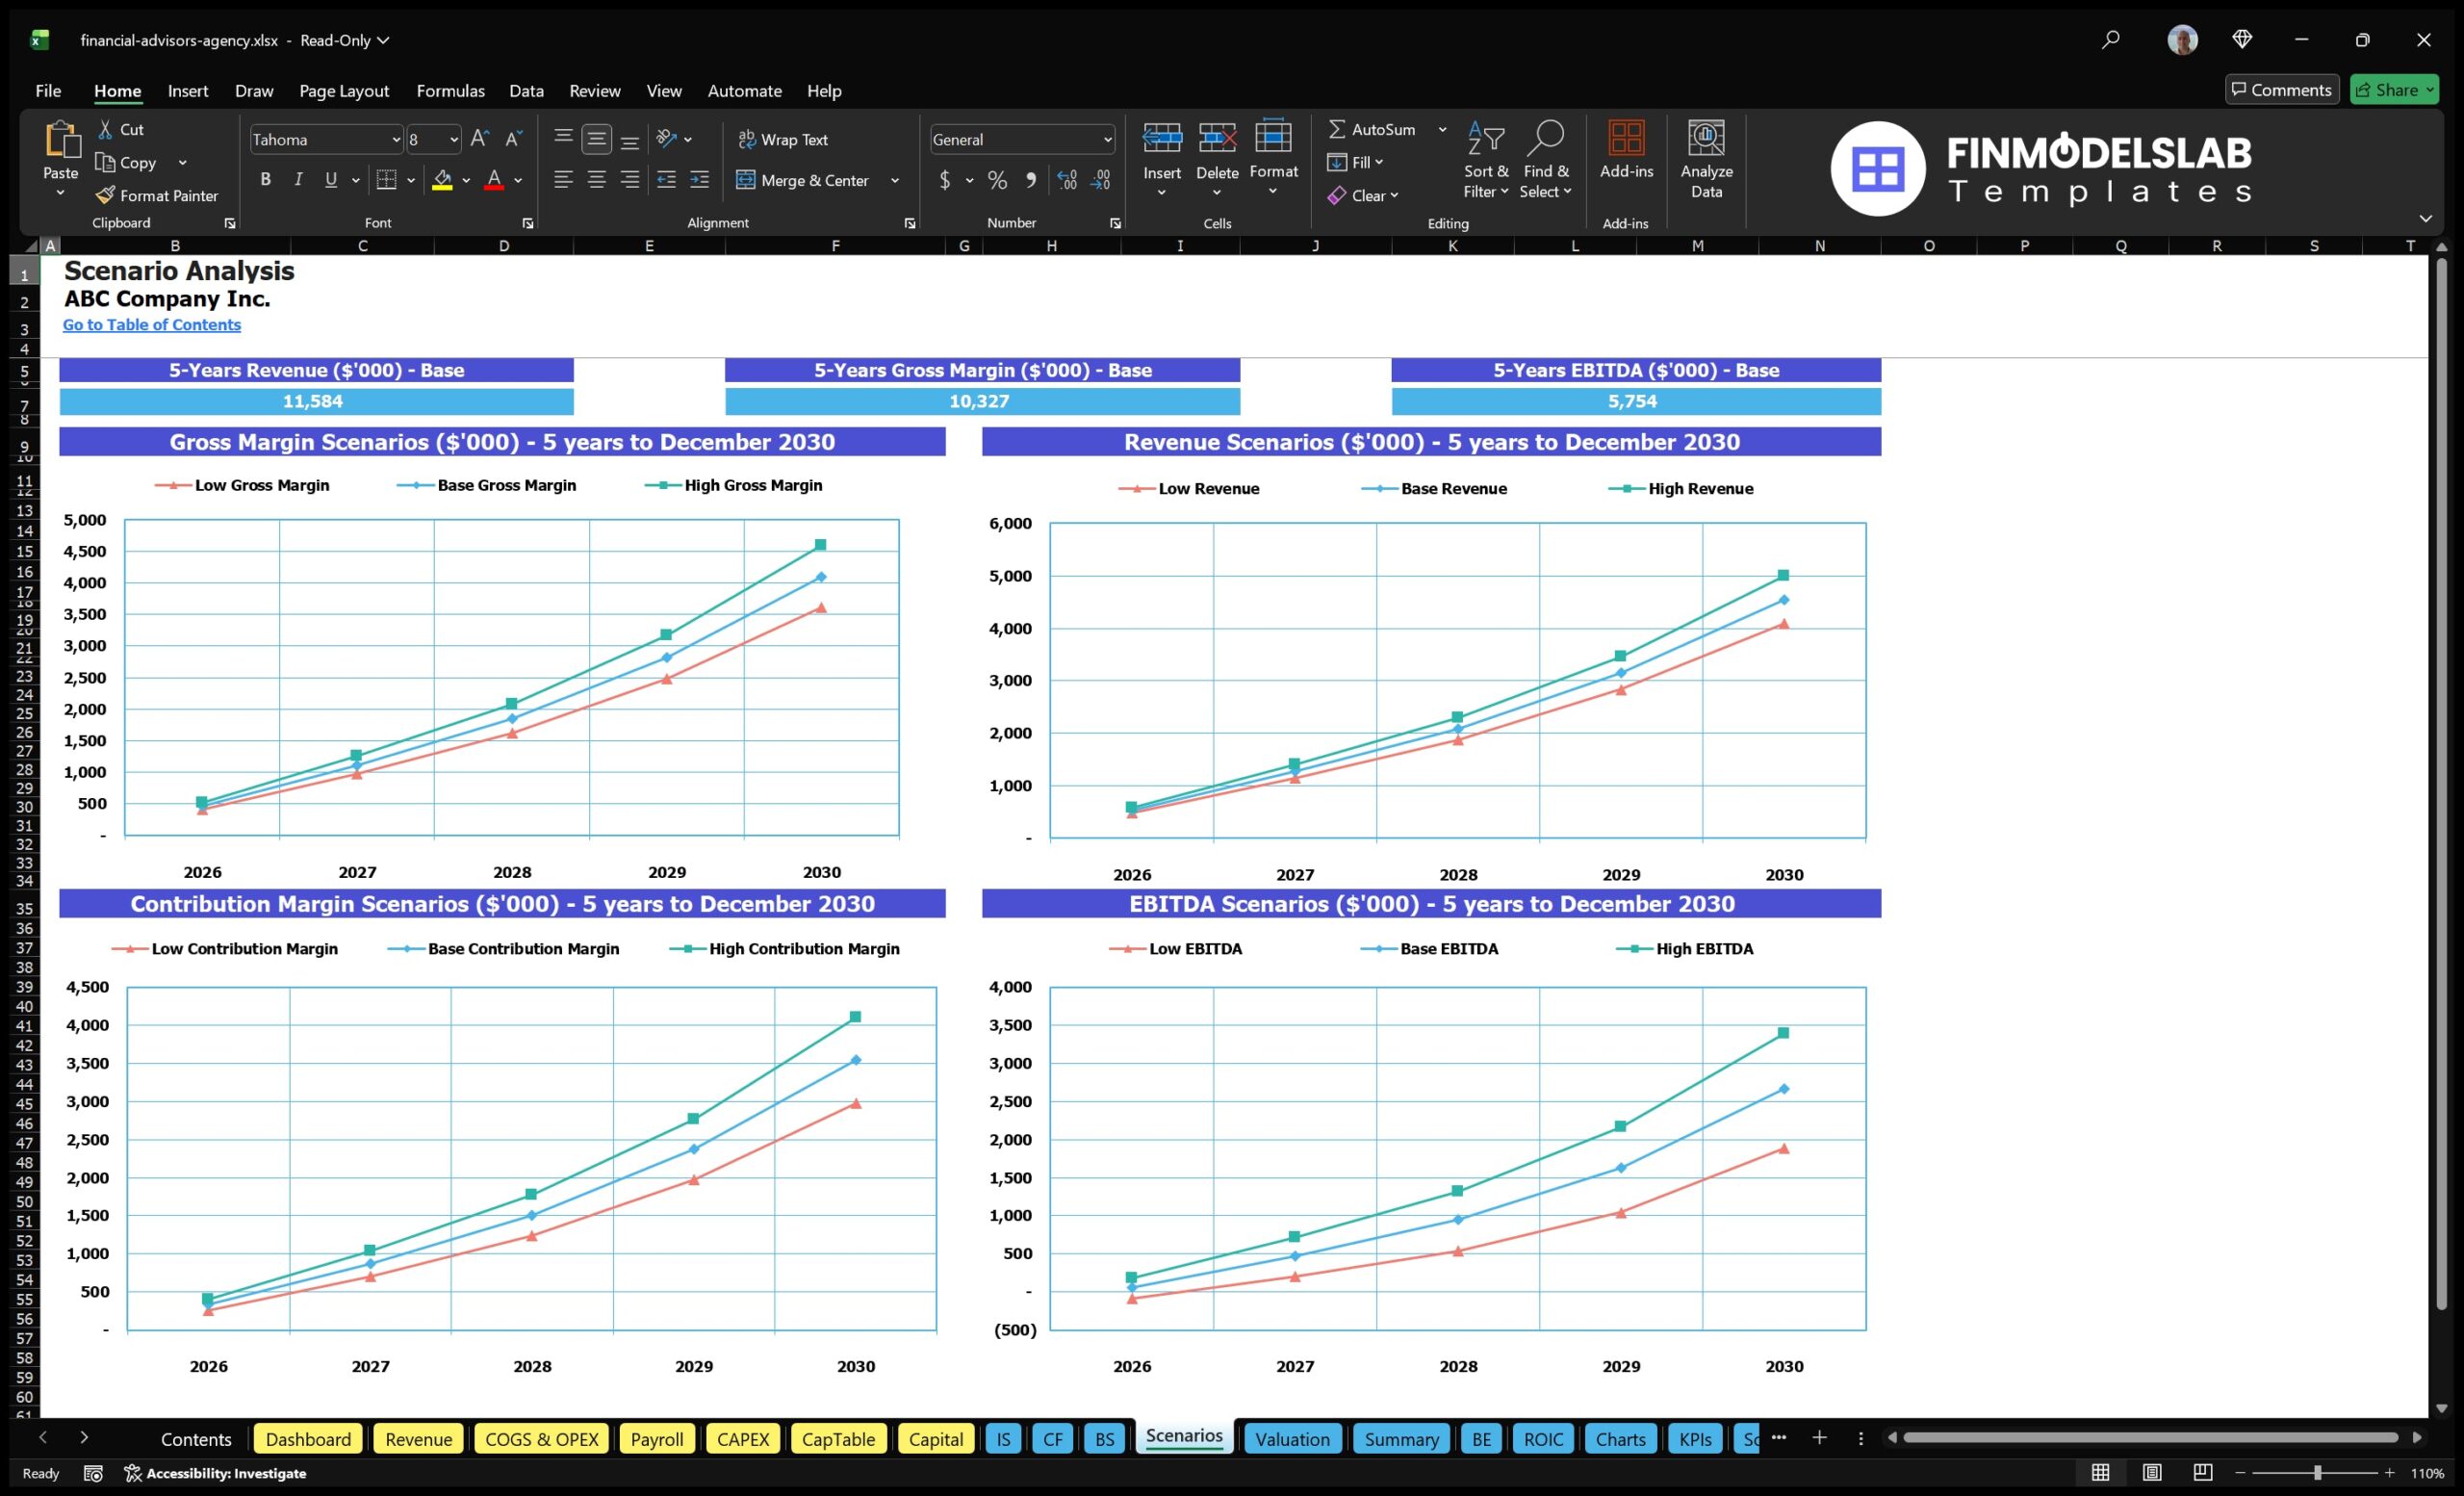
The low, base, and high scenario analysis component allows users to test how the financial advisory firm may perform under different business conditions. A base case can represent the most realistic plan, while a low case can reflect slower client acquisition, weaker pricing, higher customer acquisition costs, or delayed revenue growth. A high case can reflect stronger market demand, faster referral growth, higher billable utilization, improved pricing power, or more efficient marketing spend. By adjusting assumptions across these scenarios, users can compare revenue, profitability, cash flow, staffing needs, and funding requirements under multiple outcomes. This is especially useful for business planning and investor discussions because it shows that the user has considered uncertainty rather than relying on a single forecast. Scenario analysis also helps identify risk points, such as how much revenue can decline before the business becomes cash constrained or how much additional capacity may be needed if client growth exceeds expectations.
Professional Charts
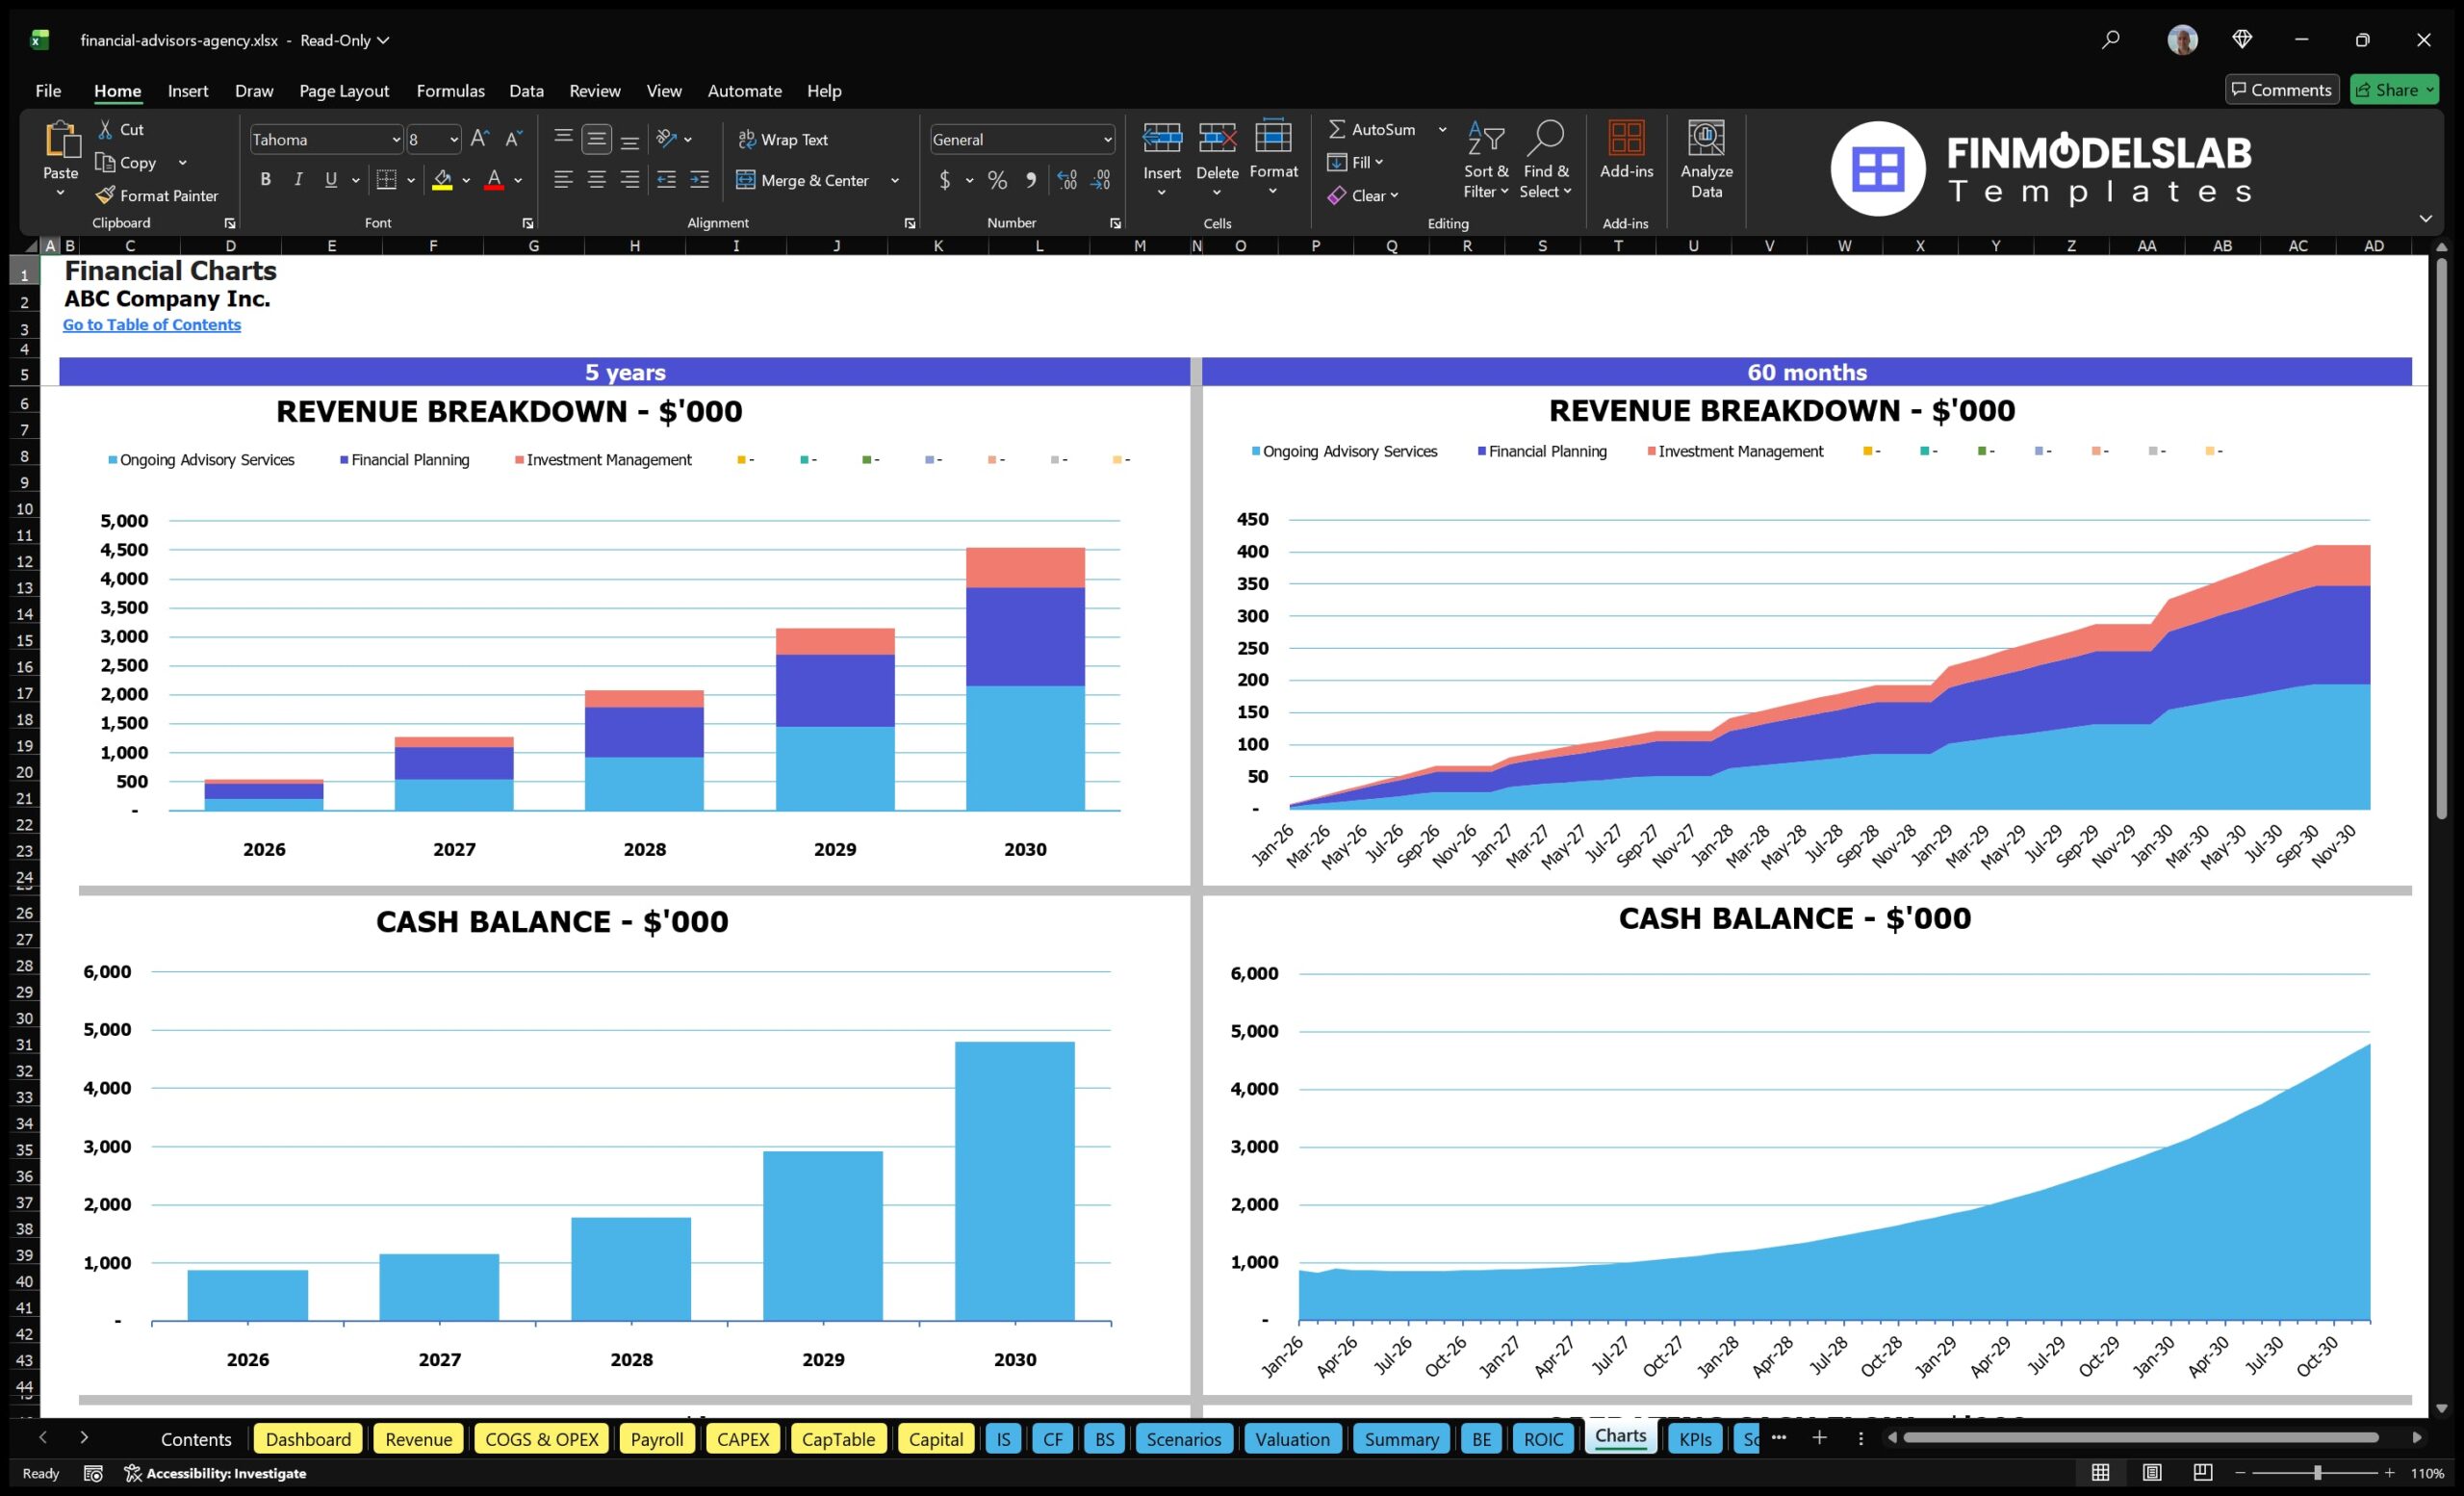
The professional charts component turns the financial forecast into clear visual outputs that can be used in meetings, planning reviews, lender conversations, investor presentations, or internal reporting. Instead of relying only on rows of numbers, this part of the Financial Advisor Financial Model helps users communicate trends in revenue growth, expense structure, EBITDA, net income, cash flow, profit margins, and other key financial indicators. The charts may display monthly or annual performance, compare scenarios, illustrate revenue composition, or show how margins improve as the advisory practice scales. These visuals are useful because financial advisory businesses often need to explain their growth logic to non-financial stakeholders, including partners, loan officers, investors, or team members. A clean chart pack can make the forecast easier to understand, support more productive discussions, and help users present a polished, professional view of the firm’s financial outlook.
ROE Components and DuPont Analysis
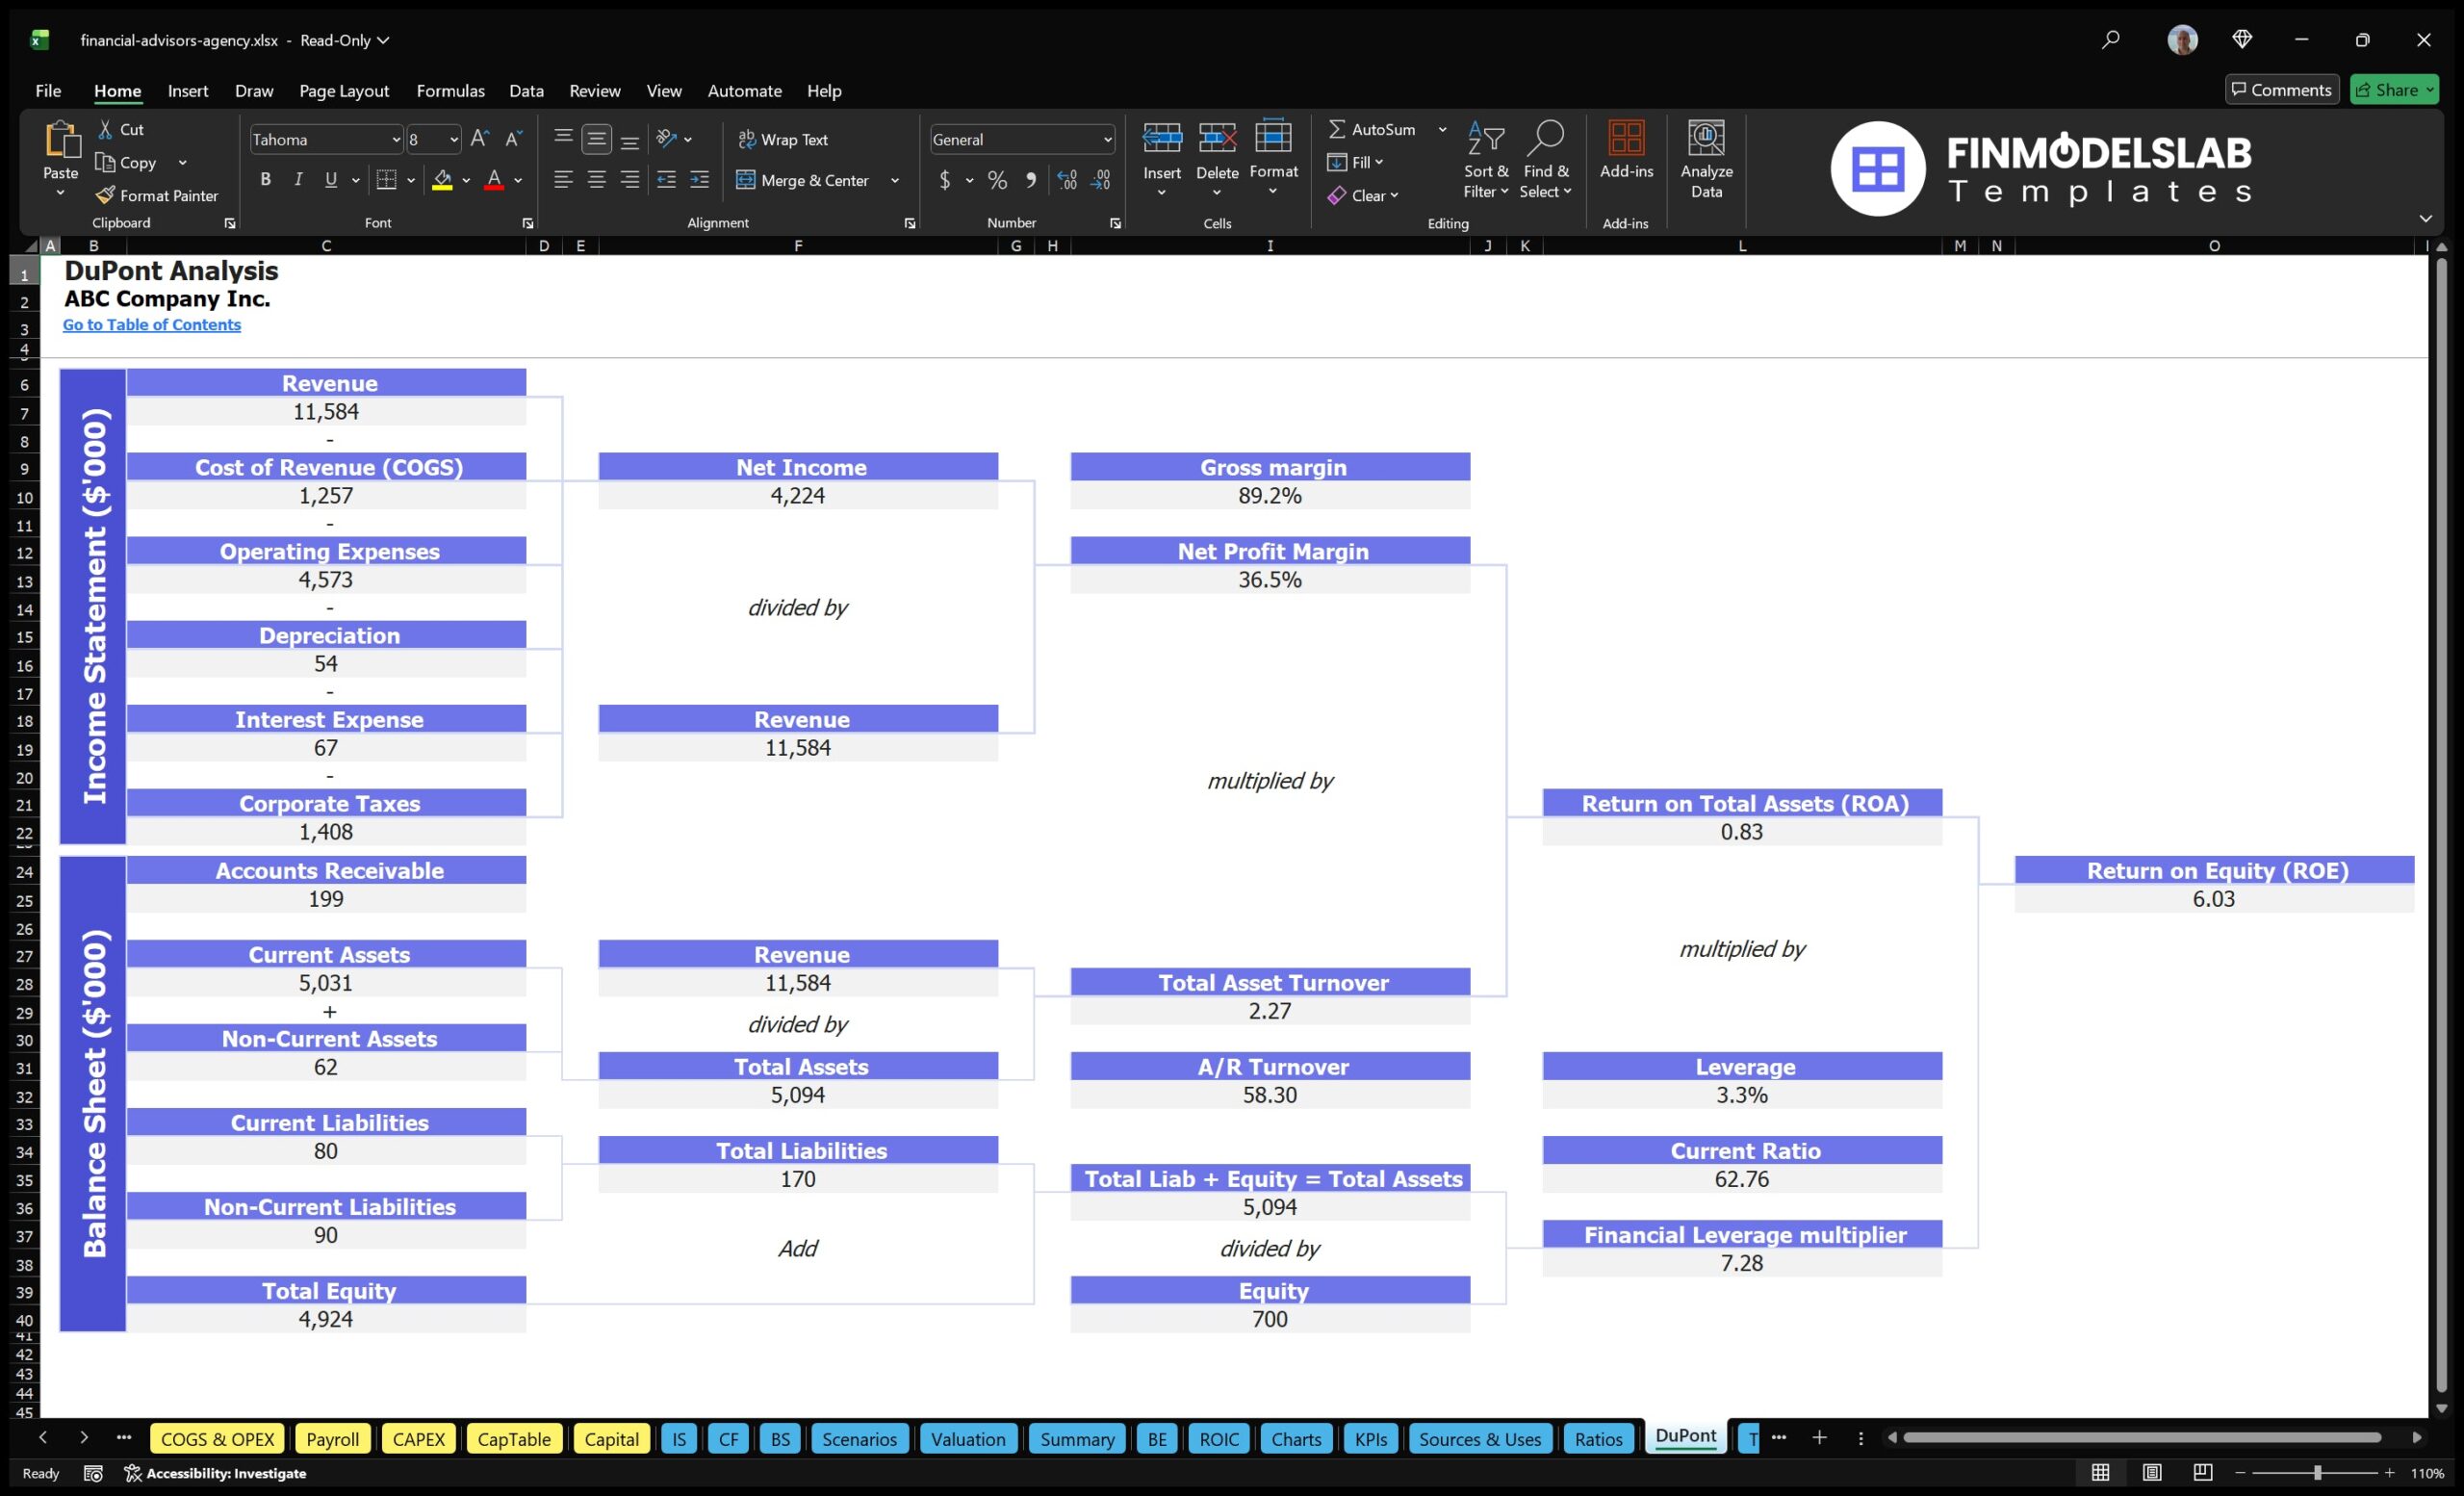
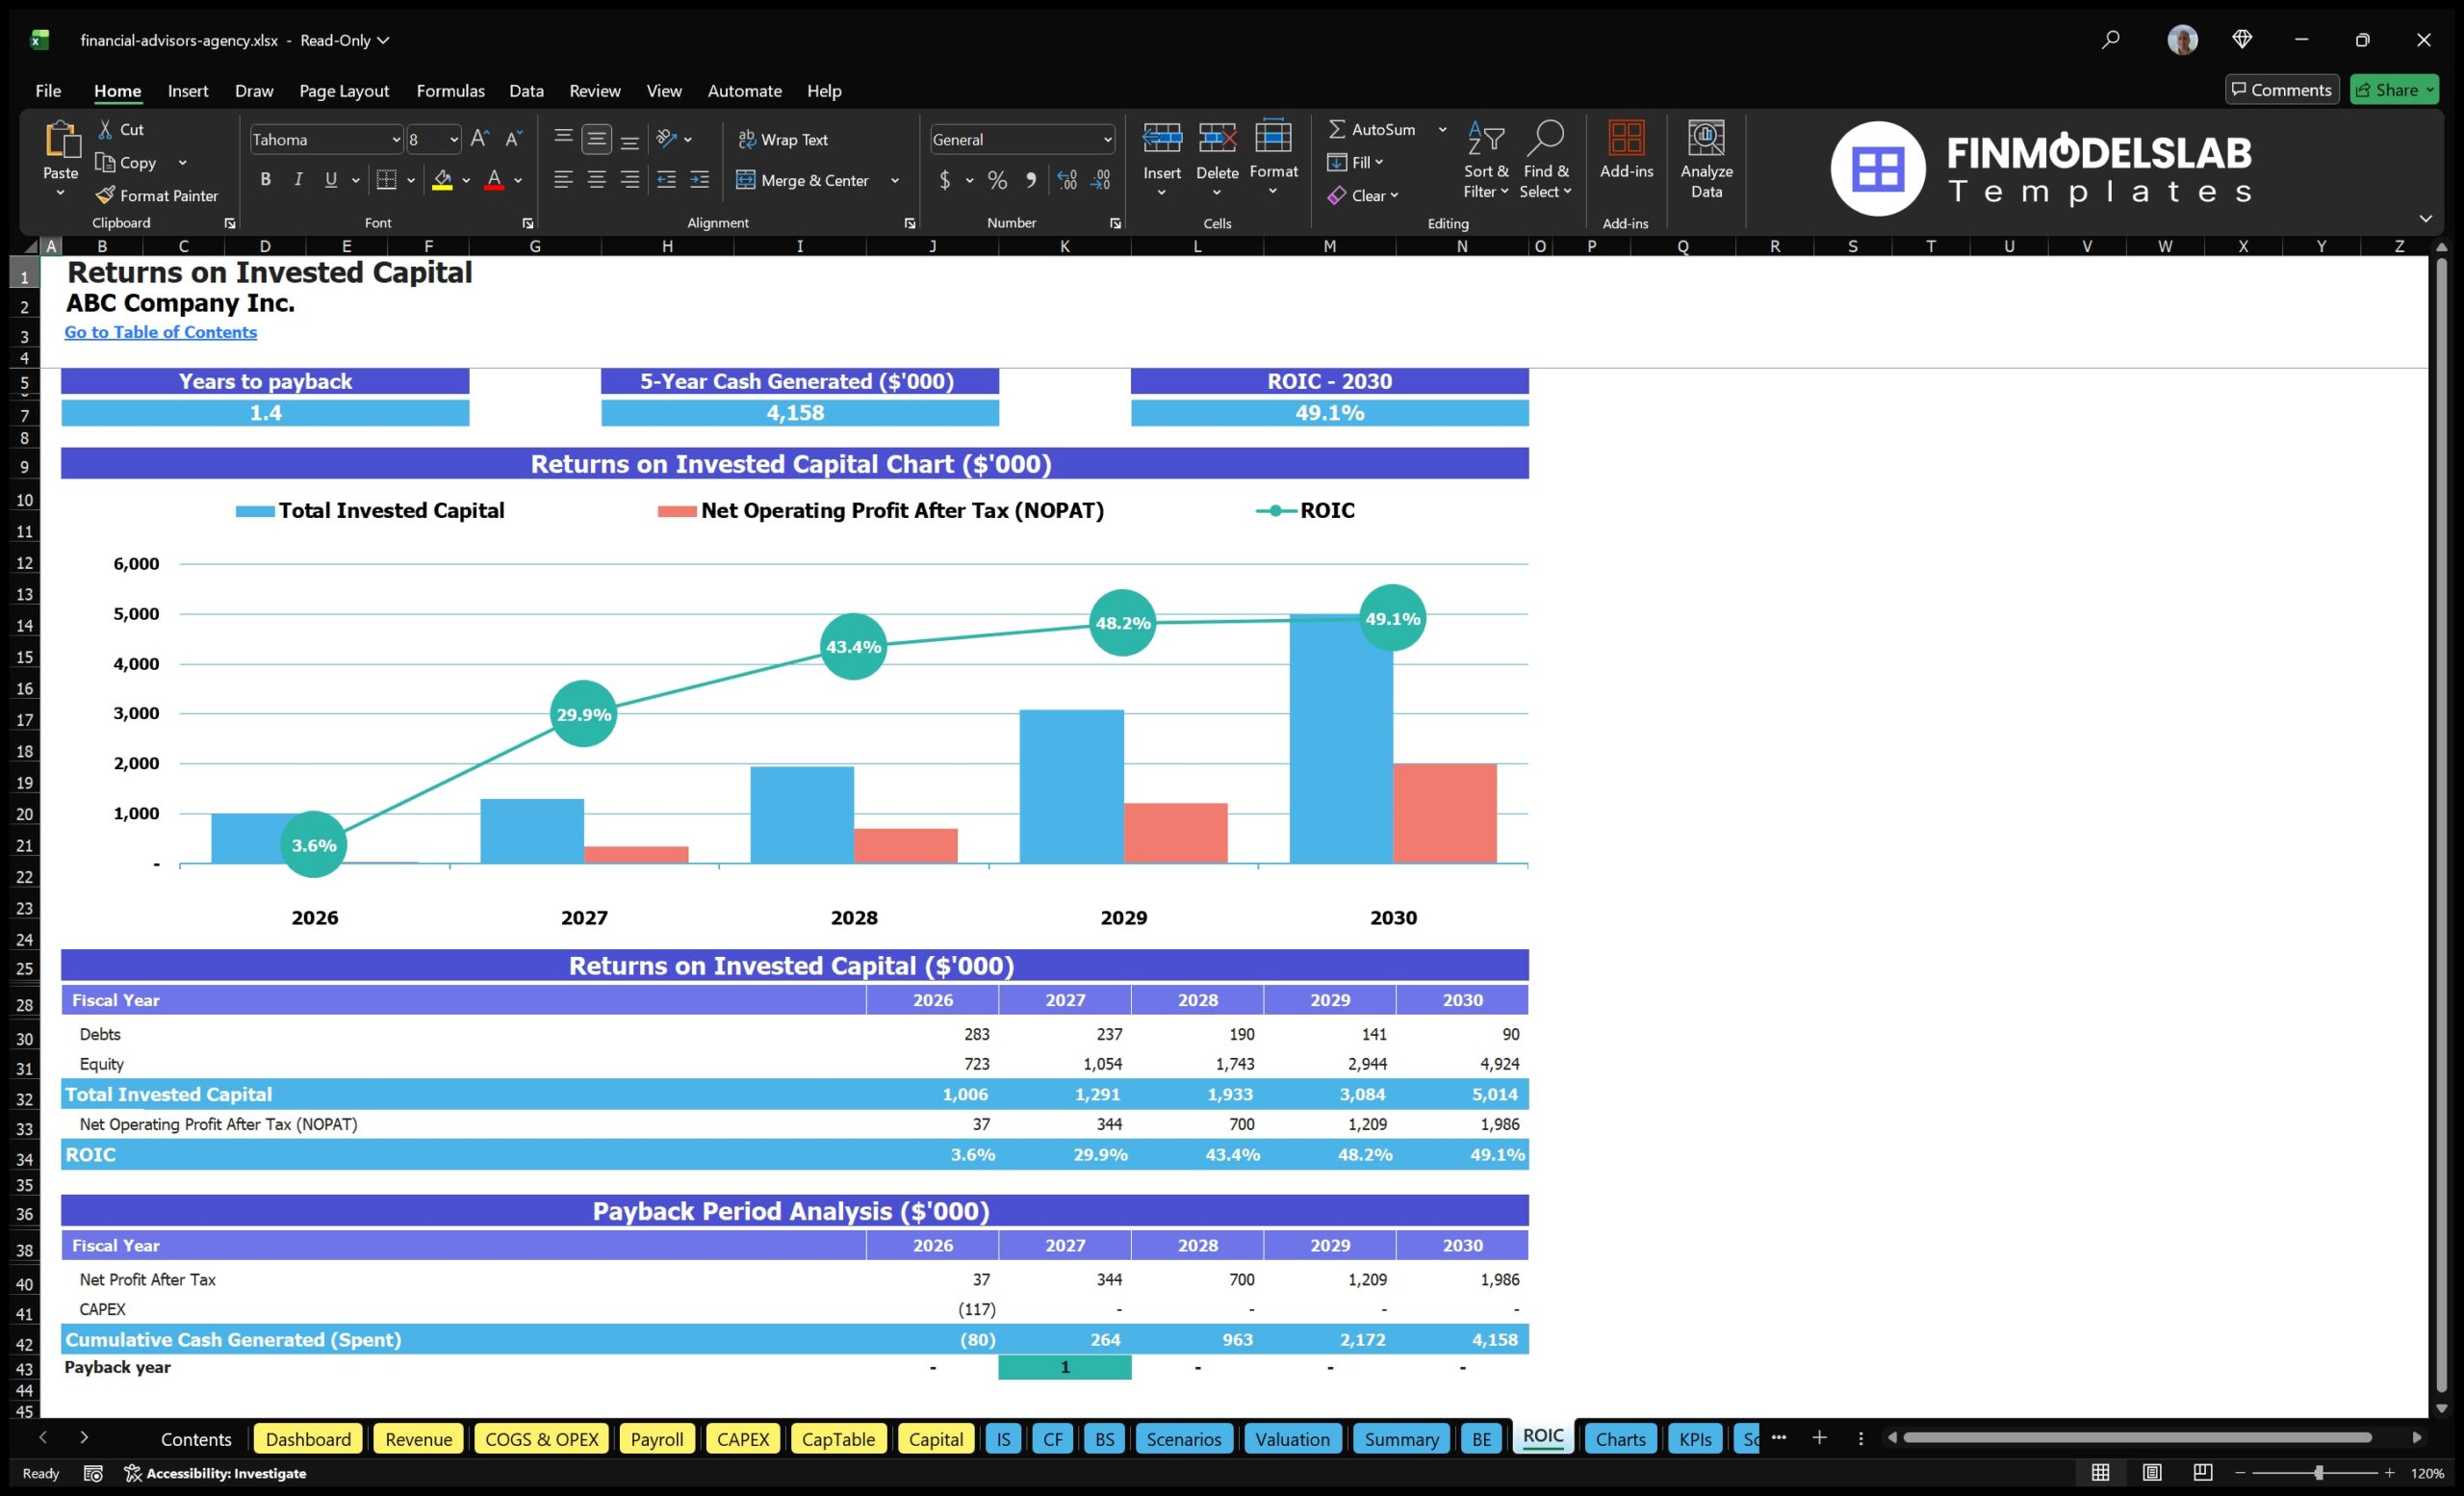
The ROE components and DuPont analysis section helps users understand the drivers behind return on equity rather than viewing profitability as a single isolated number. This component breaks down return performance into underlying factors such as profit margin, asset efficiency, and leverage, giving users a more detailed view of what is influencing the firm’s financial returns. Inputs may be connected to revenue, operating expenses, net income, asset base, equity investment, and financing structure, while outputs can help show how operational profitability and balance sheet decisions affect overall return on equity. For a financial advisory practice, this analysis is useful when evaluating whether the business is producing attractive returns relative to the capital invested. It can also support investor conversations by showing how improved pricing, better cost control, higher client retention, or more efficient use of assets may strengthen the firm’s return profile over time.
Revenue Inputs
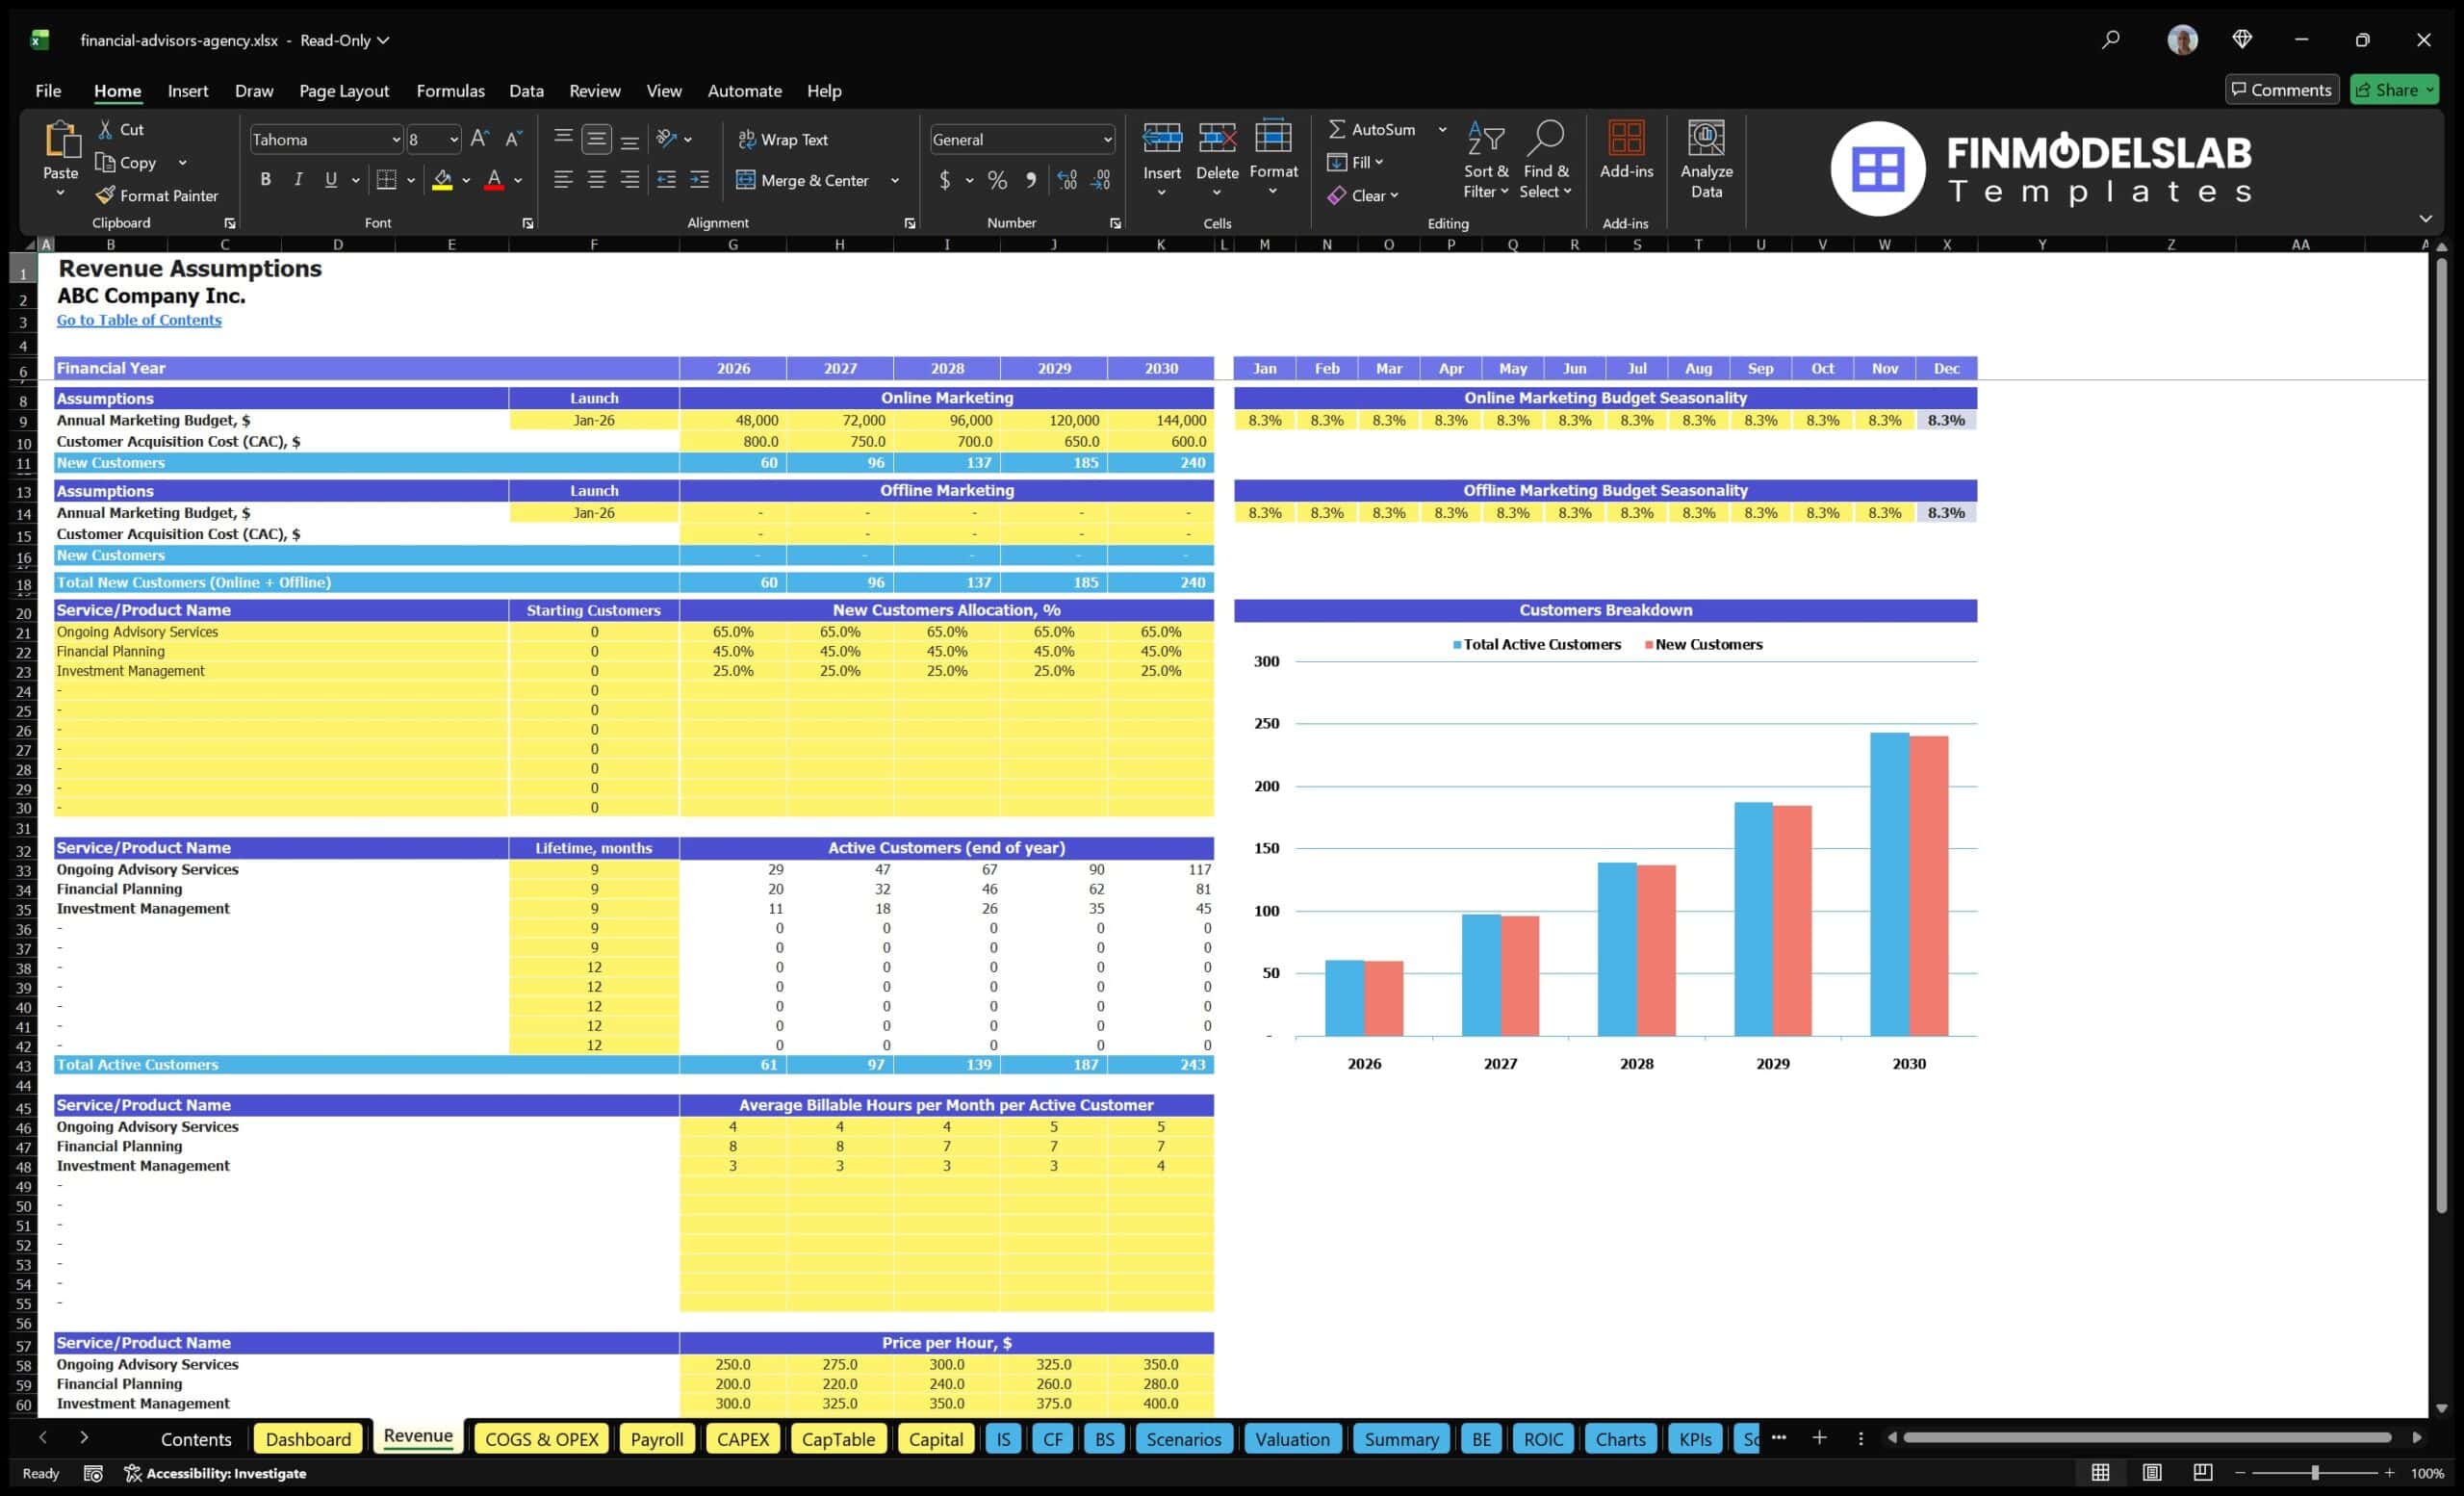
The revenue inputs component is where users define the commercial assumptions that drive the forecast for the financial advisory business. This section may include assumptions for ongoing advisory services, financial planning projects, investment management work, hourly rates, monthly billing, billable hours, number of clients, conversion rates, service mix, client acquisition cost, marketing spend, and pricing growth over time. It may also include pre-filled industry-specific assumptions that can be edited to match a particular advisory strategy. This is one of the most important parts of the financial model because advisory firms often depend on a combination of recurring and project-based income. By adjusting revenue inputs, users can test how changes in client volume, pricing, utilization, or marketing efficiency affect total revenue and profitability. This helps users build a more realistic sales forecast and understand which revenue levers have the greatest impact on long-term growth.
Bank-Ready Reports
The bank-ready reports component organizes the financial forecast into lender-friendly outputs that can support financing applications, capital planning, and external review. This section may include structured summaries of projected income, expenses, cash flow, profit, debt capacity, working capital needs, and repayment ability. For a financial advisory practice seeking startup funding, expansion financing, or a business line of credit, lenders typically want to see clear assumptions, credible revenue projections, disciplined expense planning, and evidence that the business can maintain enough cash to cover obligations. The bank-ready reporting section helps users present that information in a more professional and organized format. It is also useful for internal planning because it brings together the numbers that matter most when determining how much capital is needed, whether the firm can support debt, and how long it may take for operations to generate stable positive cash flow.
Revenue Breakdown
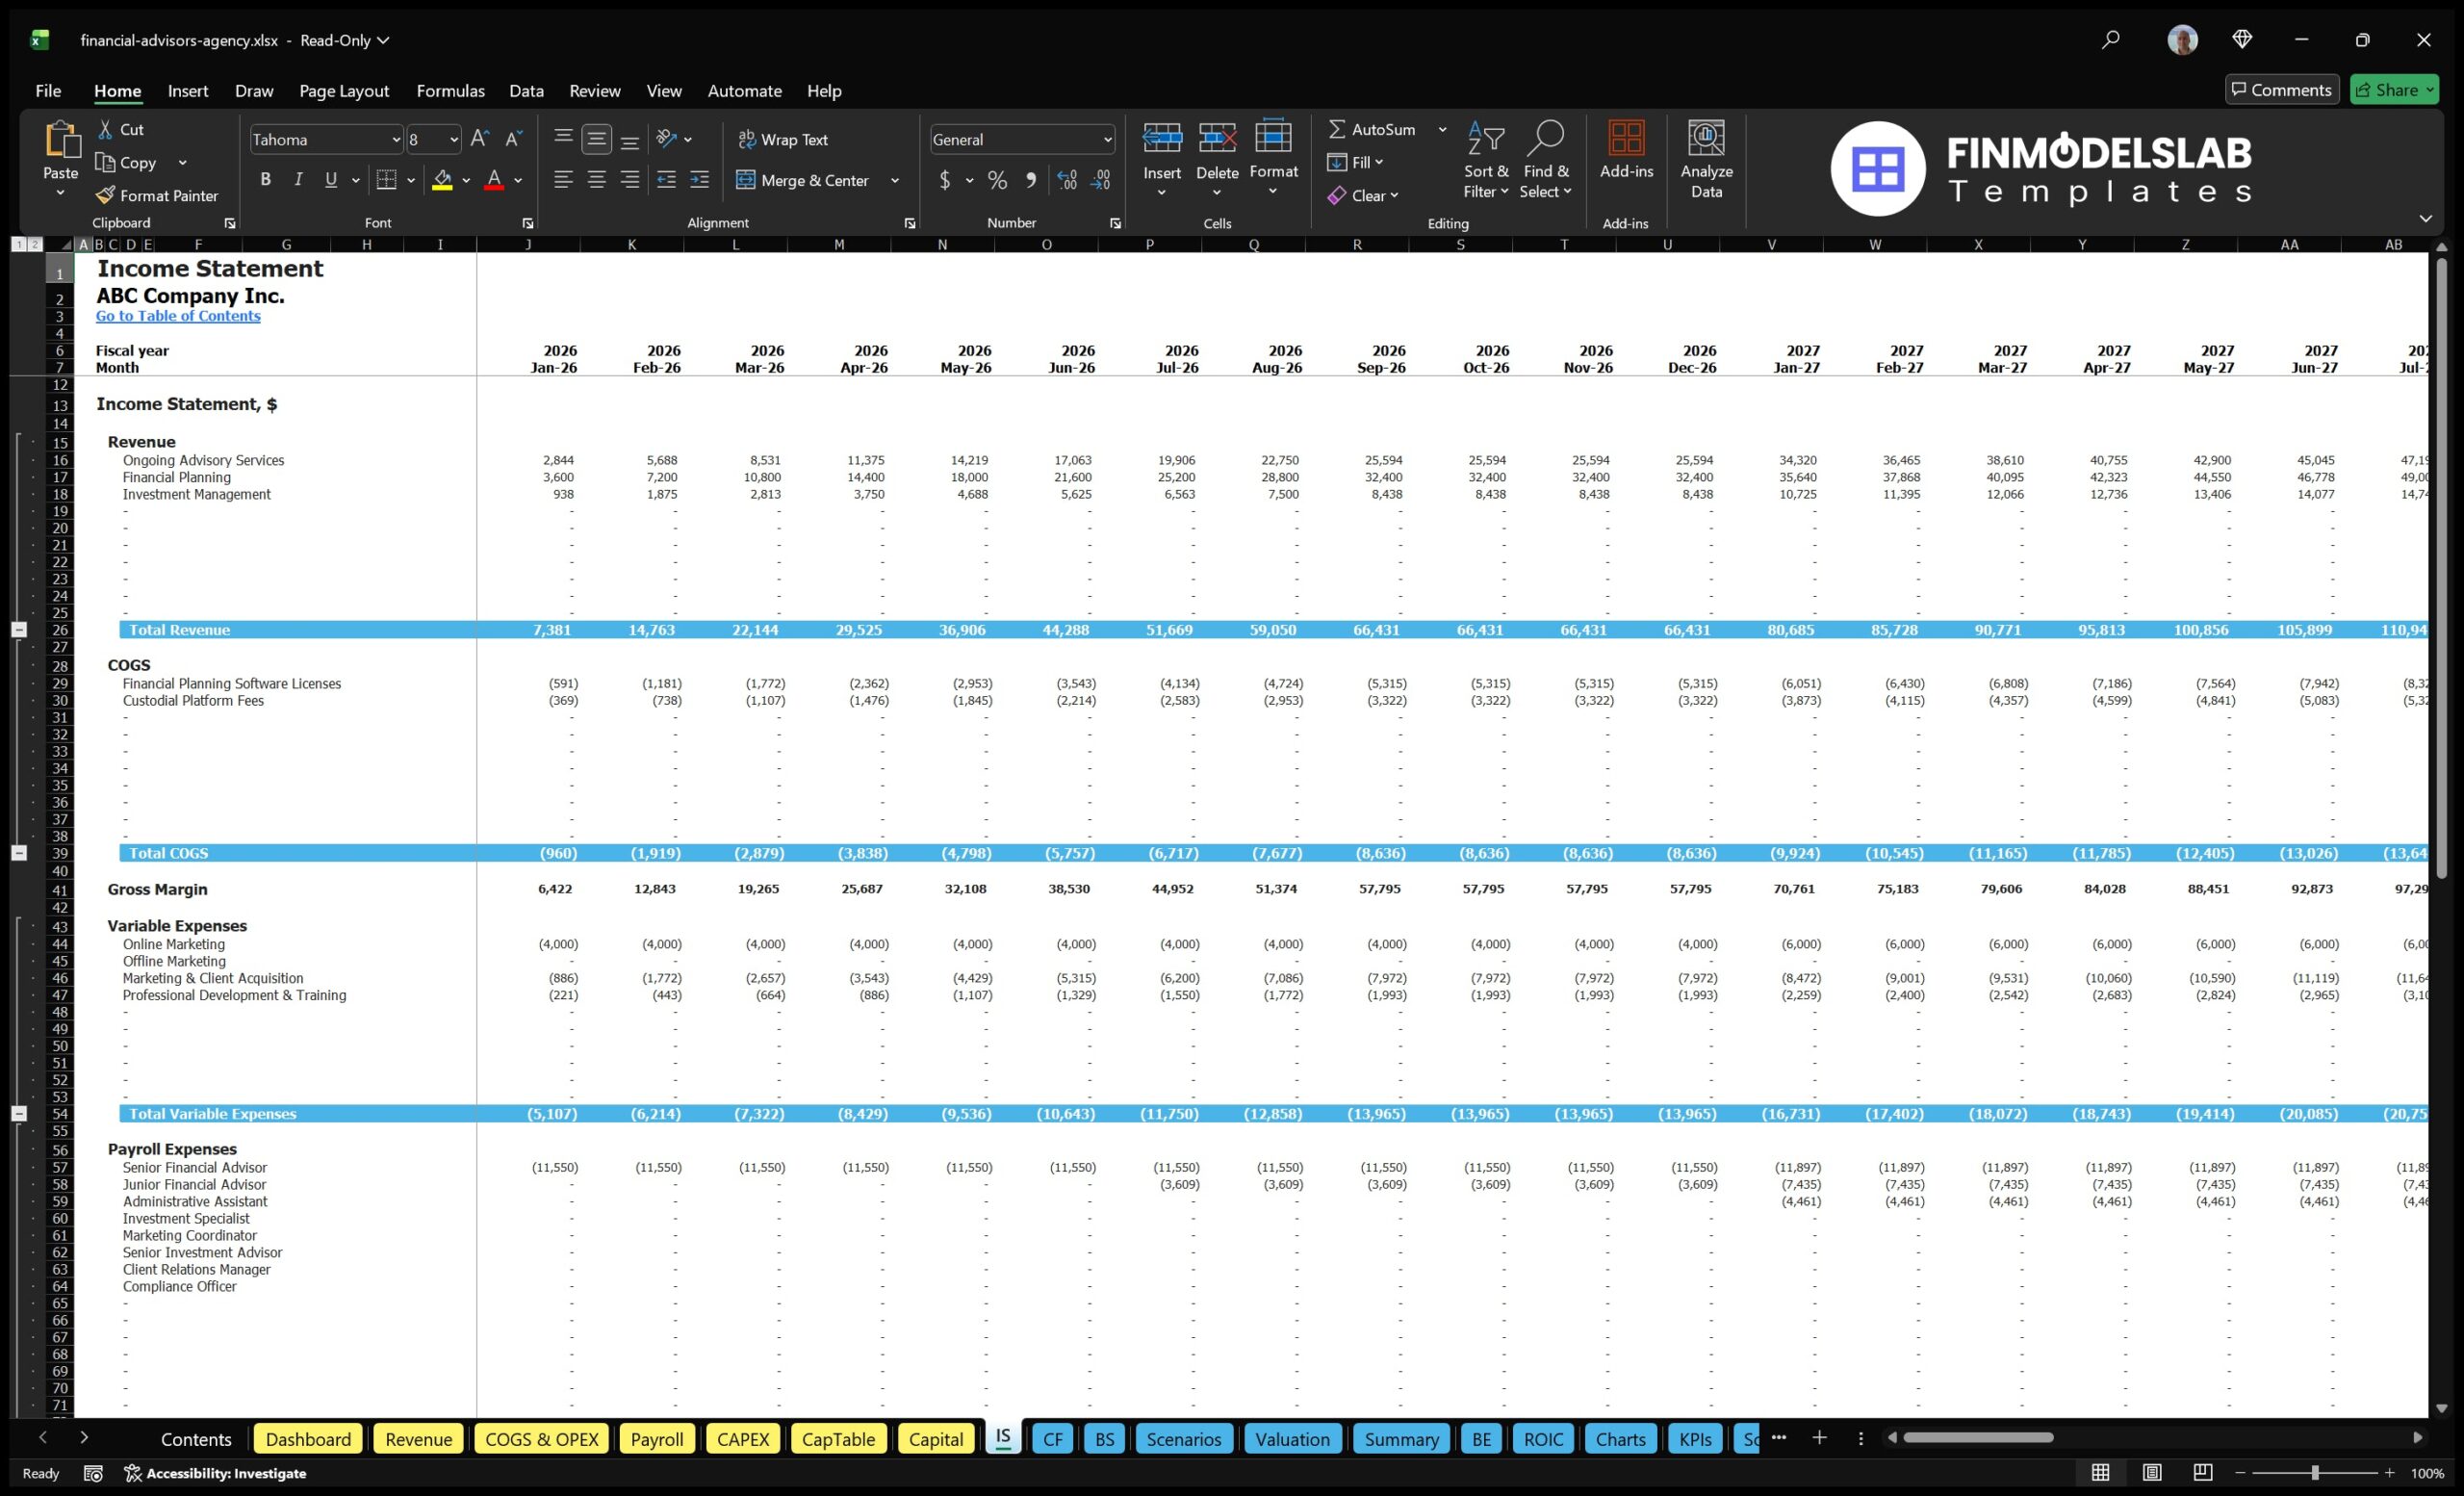
The revenue breakdown component provides a detailed view of how the advisory firm generates income across different services or revenue streams. A financial advisor may earn revenue from ongoing advisory retainers, hourly consulting, financial planning packages, investment management fees, project-based engagements, or other client services. This section helps users separate those streams so they can see which offerings contribute the most to total revenue, which services have the strongest growth potential, and how the service mix changes over time. Inputs may include pricing, client counts, hours per client, billing frequency, assets under management assumptions, conversion rates, and annual growth rates. Outputs may show revenue by stream, revenue share, recurring versus non-recurring income, and total forecasted sales. This is useful for decision-making because it helps users understand whether the business is too dependent on one service, whether higher-margin offerings should receive more focus, and how changes in client behavior affect the overall forecast.
KPI Dashboard and Performance Benchmarks
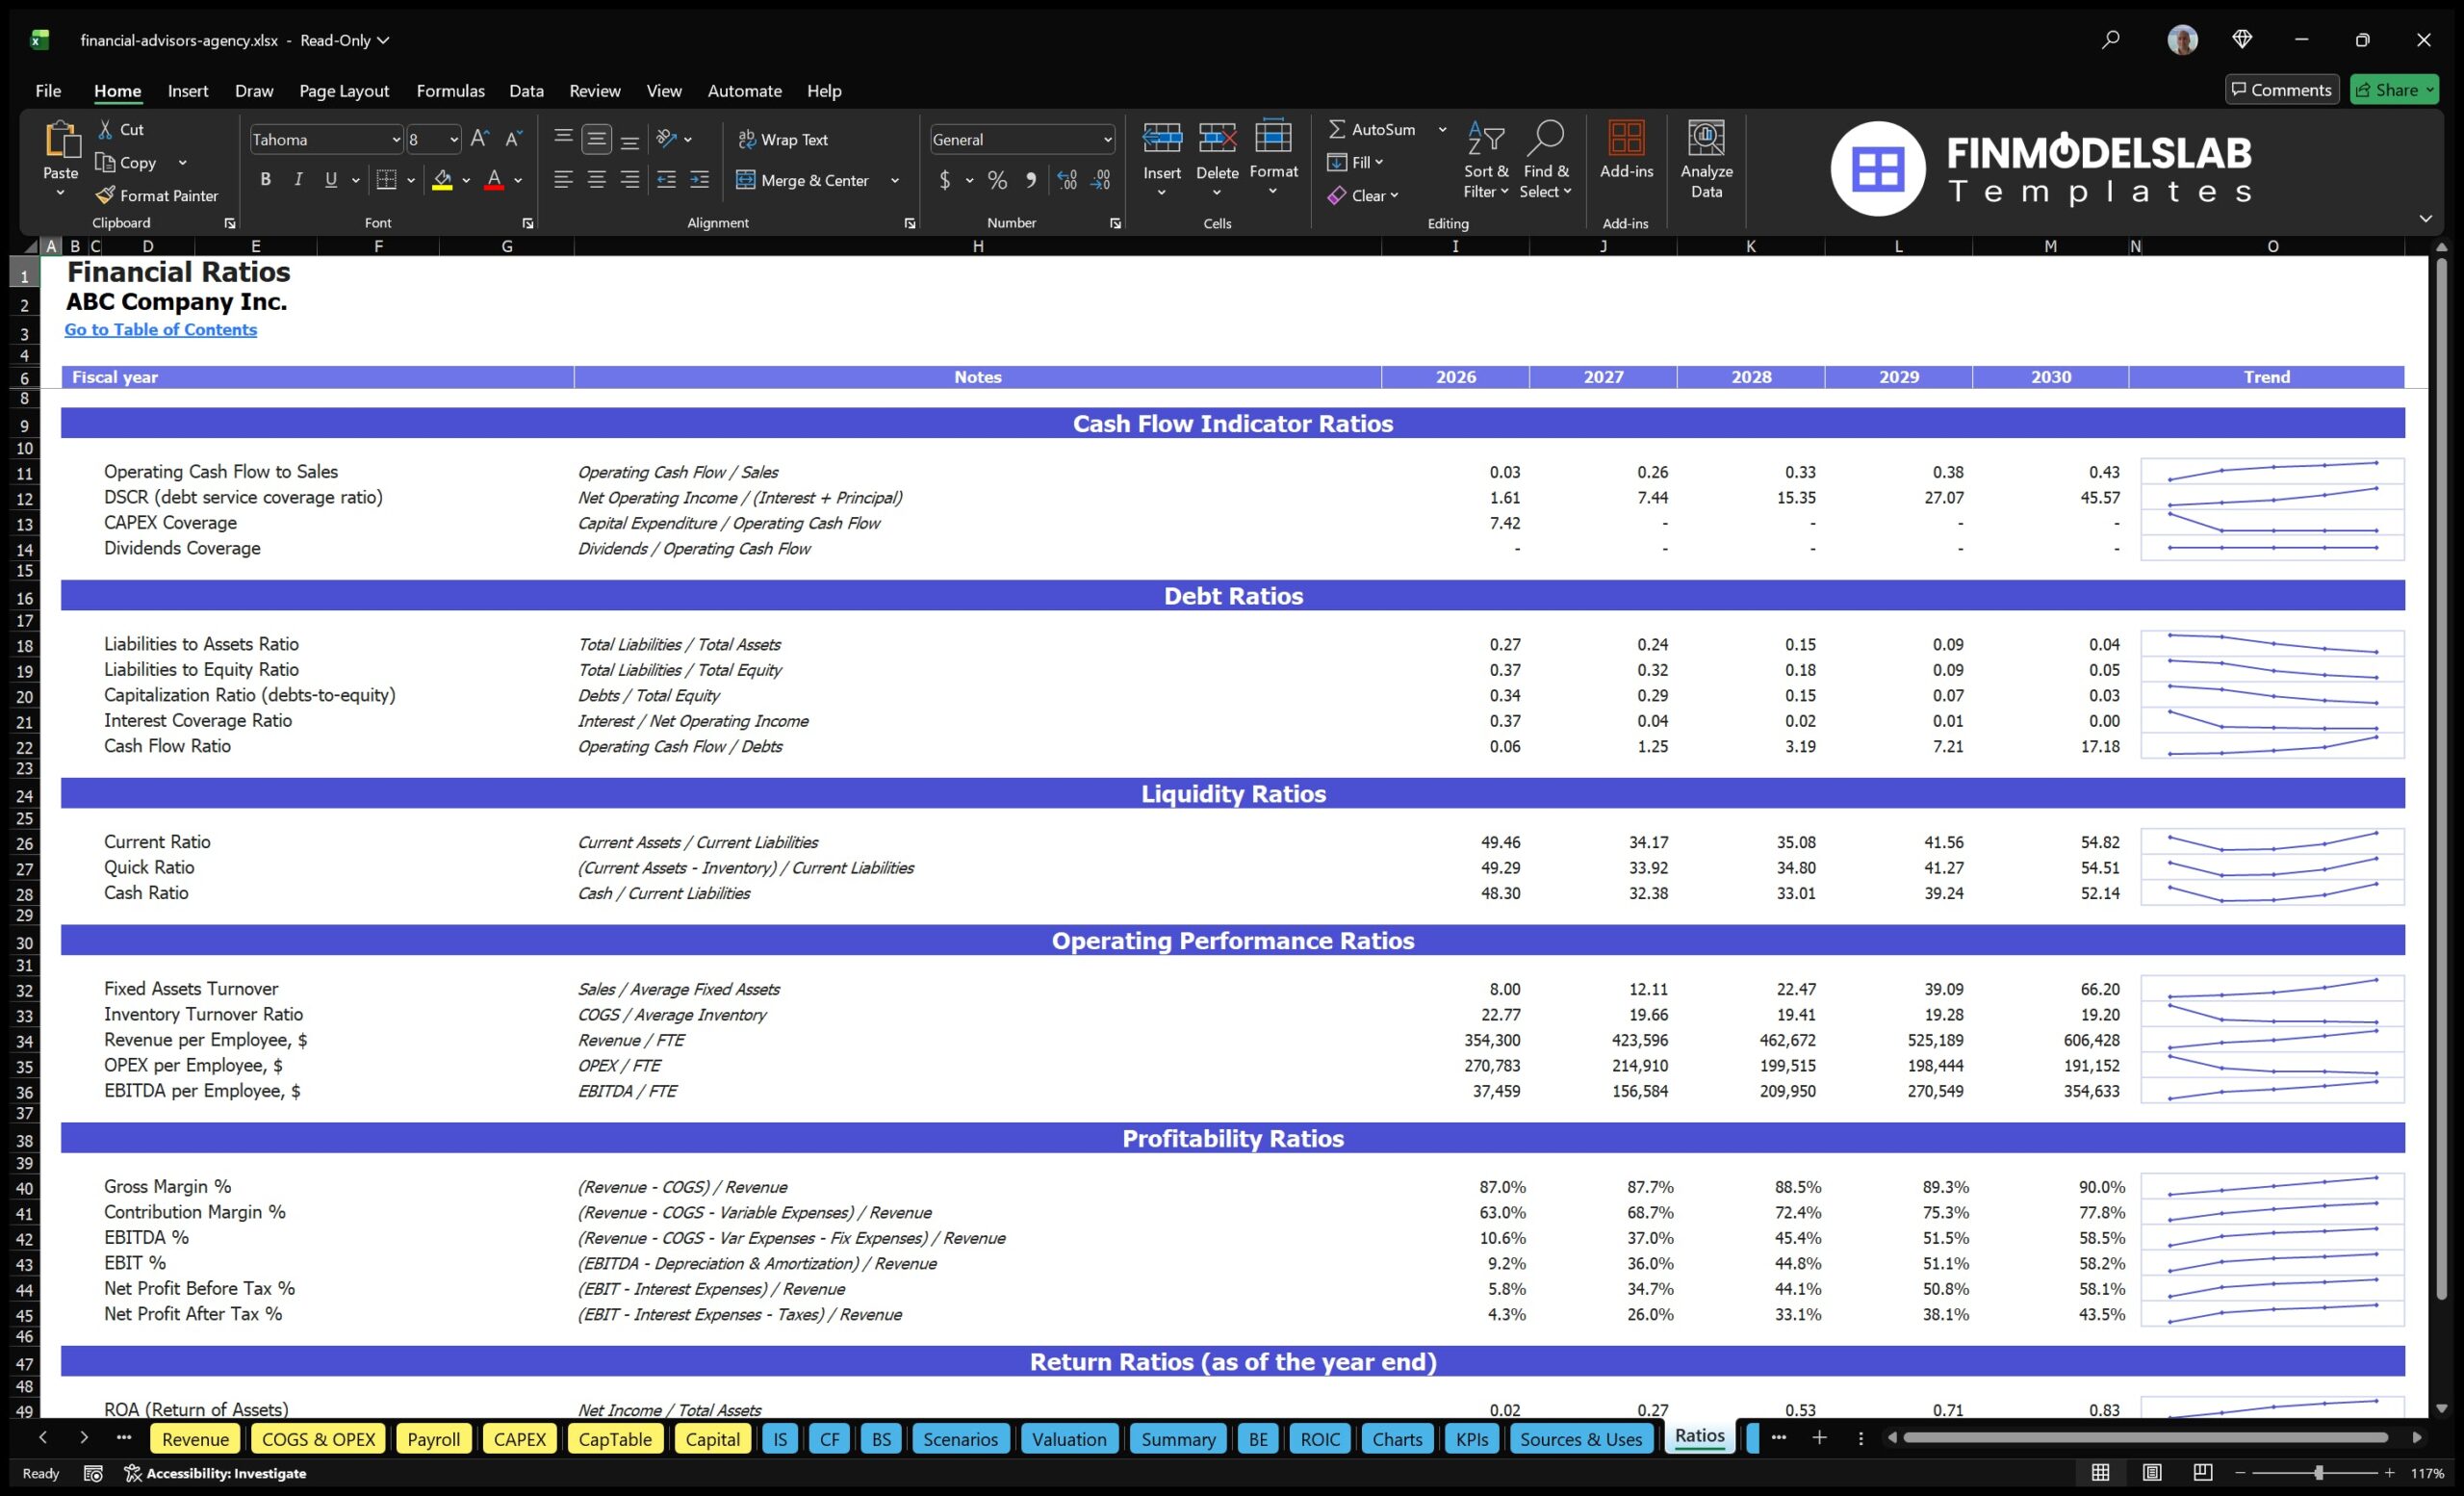
The KPI dashboard and performance benchmarks component gives users a practical way to monitor the operating health of the financial advisory practice. It may track metrics such as revenue growth, gross margin, EBITDA margin, net profit margin, average revenue per client, customer acquisition cost, client growth, payroll as a percentage of revenue, marketing efficiency, cash runway, return on equity, and payback period. The benchmark element helps users compare their assumptions and projected performance against industry expectations or internal targets, making the forecast more defensible and easier to review. This section is useful for monthly management, board-style reporting, investor updates, and ongoing strategic planning. By converting detailed financial projections into concise metrics, the KPI dashboard helps users identify what is working, where costs may be too high, whether growth is efficient, and whether the firm is moving toward sustainable profitability.
Break-Even Analysis
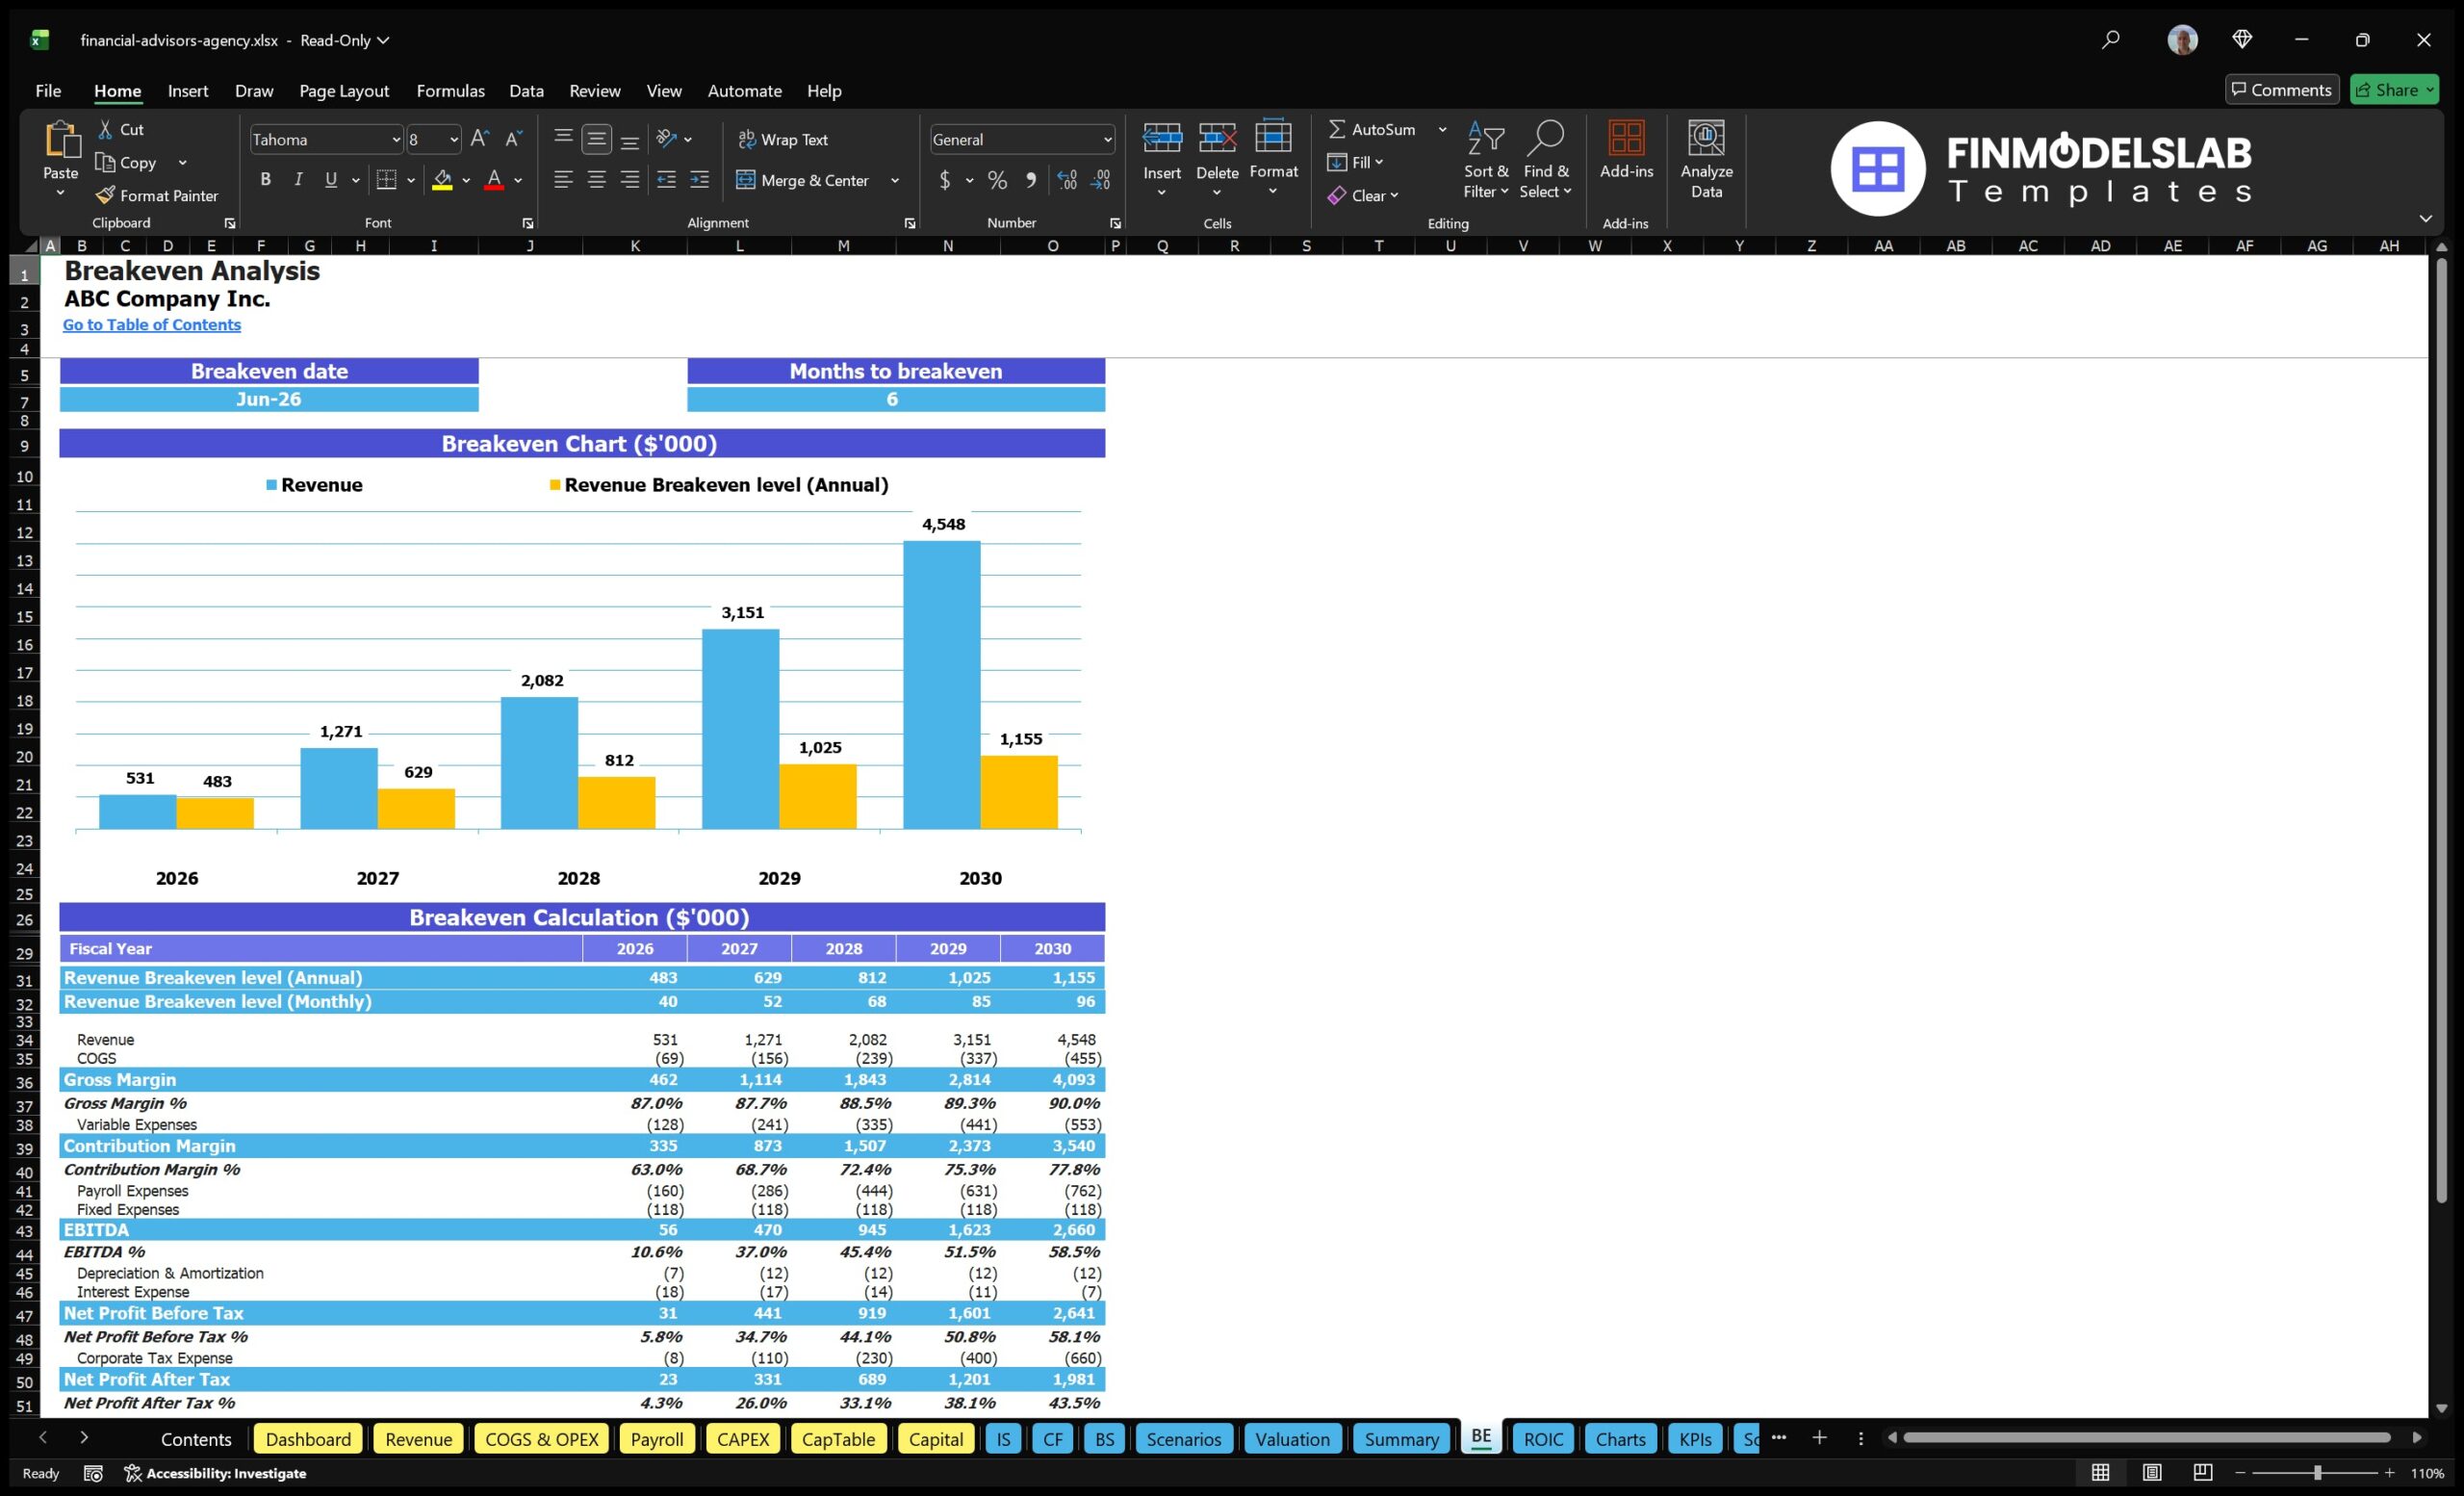
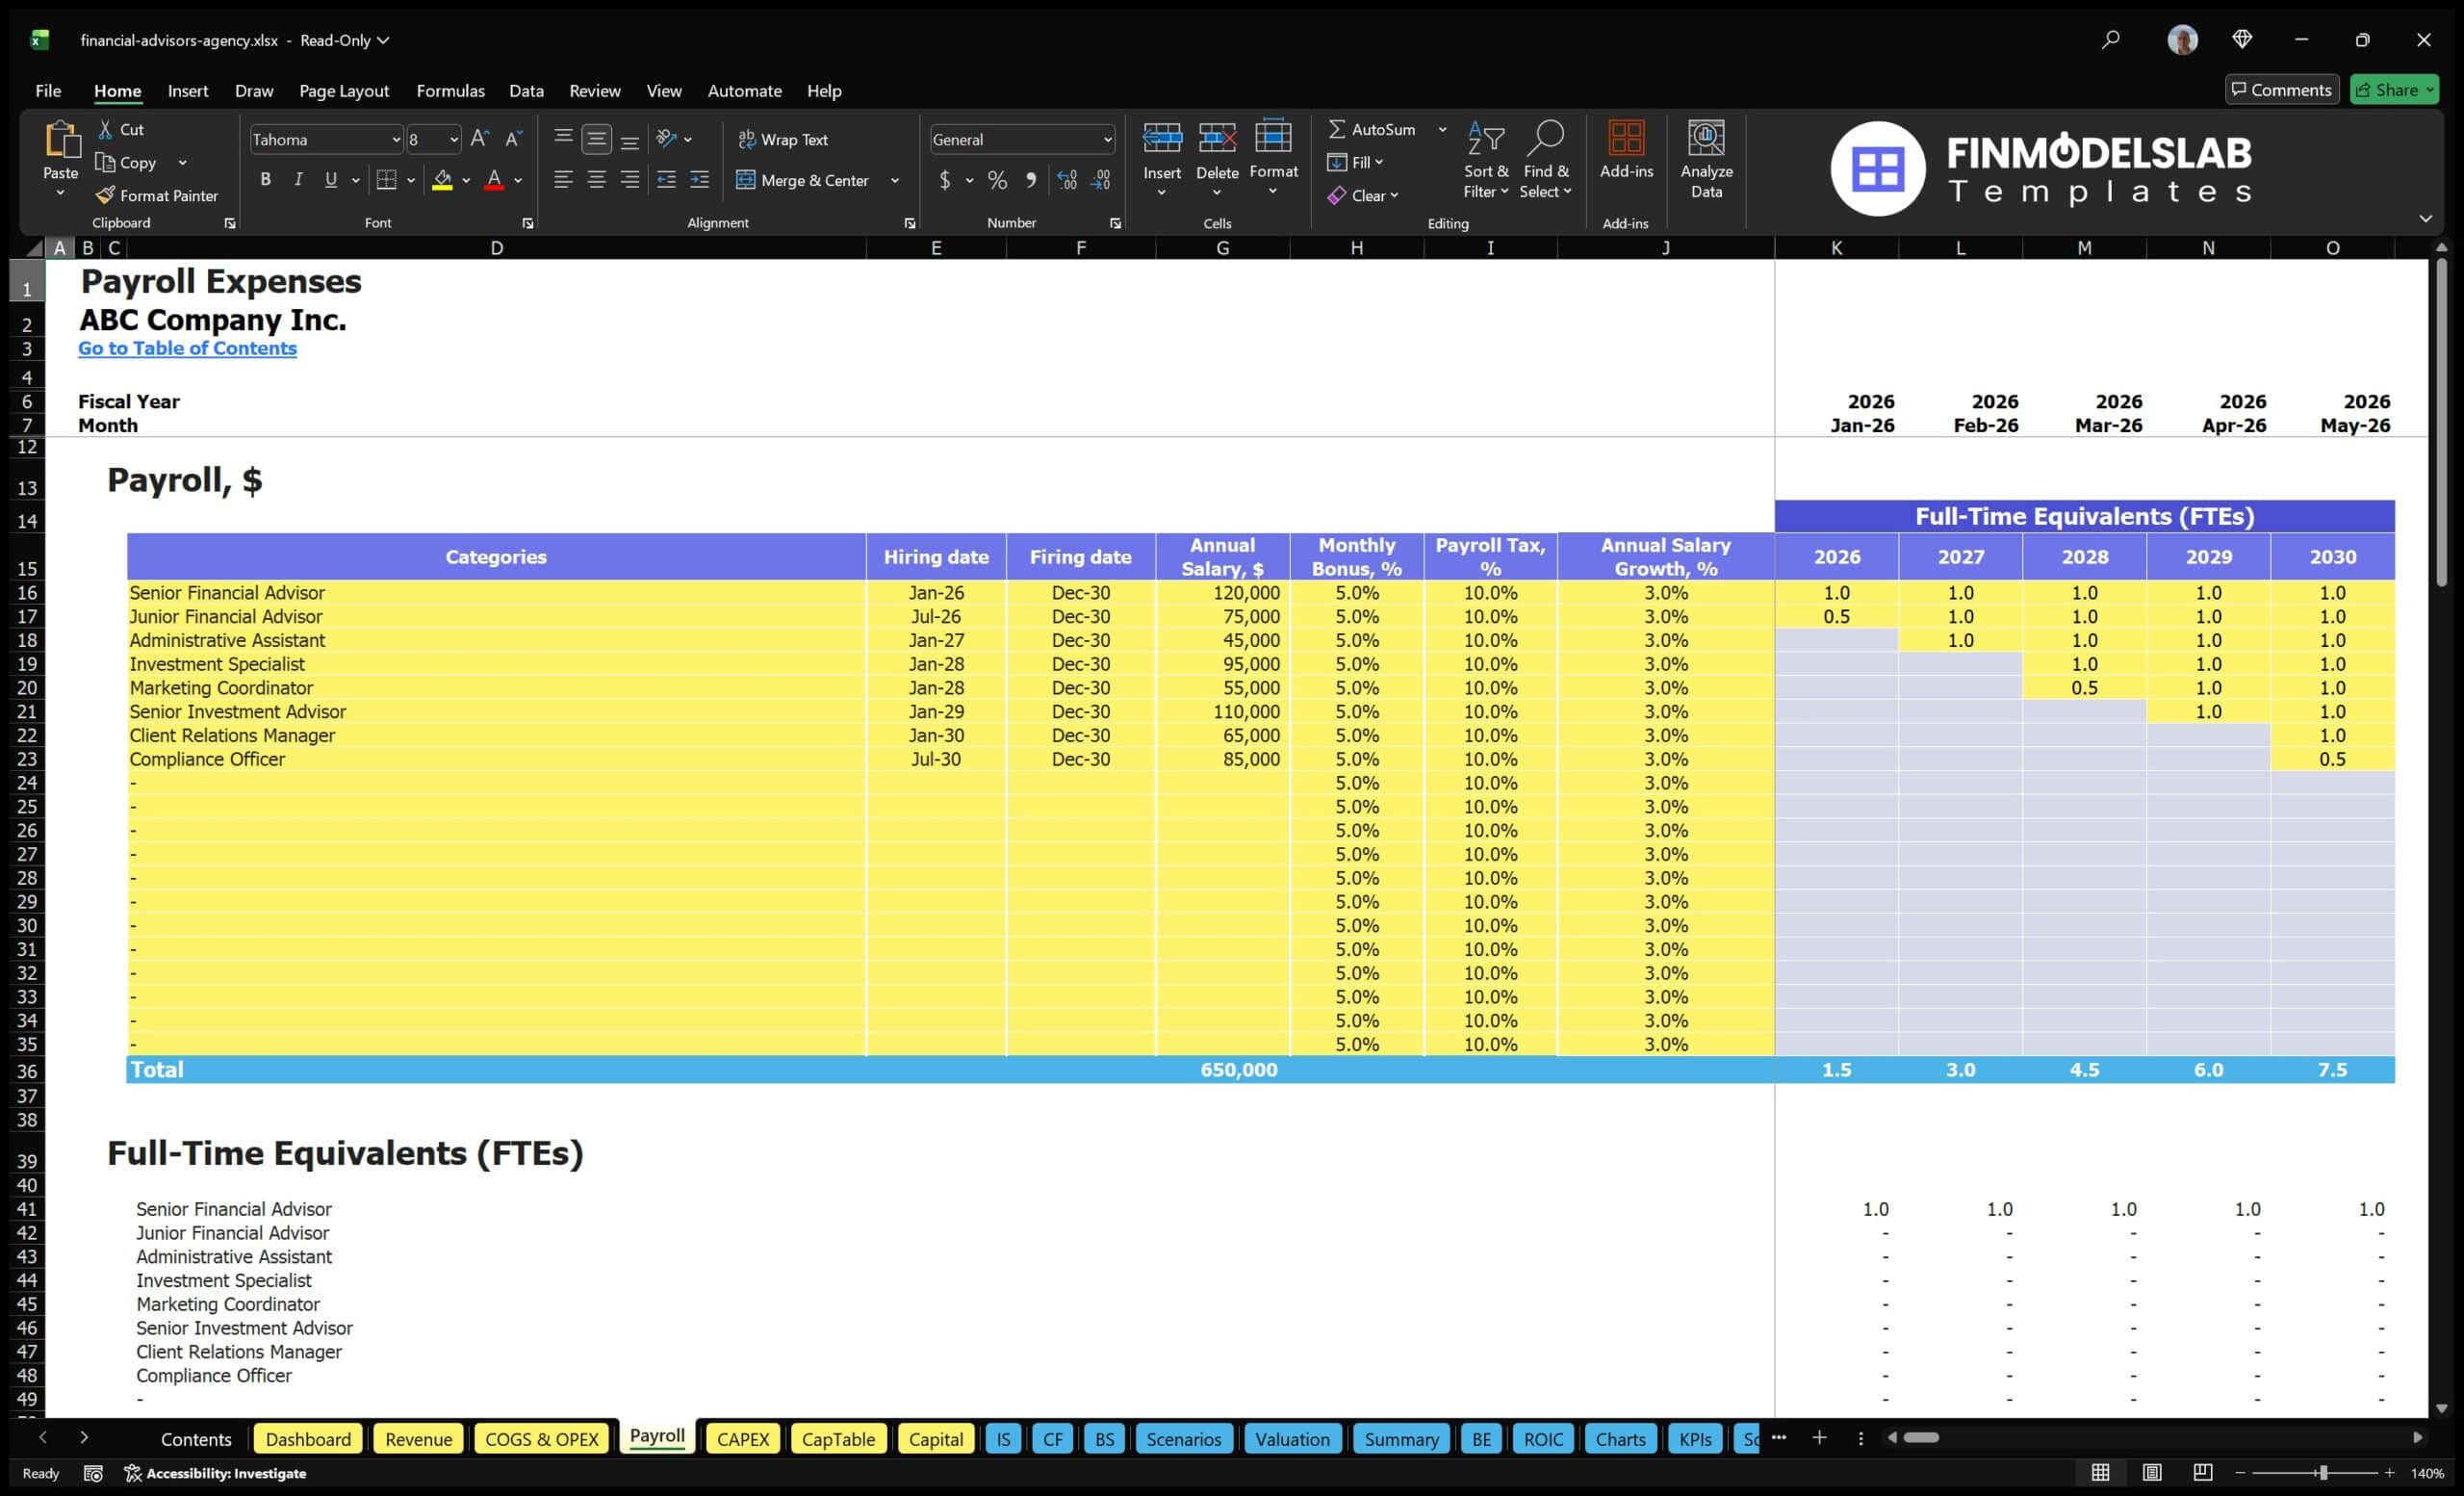
The break-even analysis component helps users determine when the financial advisory practice is expected to generate enough revenue to cover its recurring costs. It connects revenue assumptions with fixed expenses, variable expenses, payroll, software, marketing, rent, professional services, and other operating costs to estimate the point at which the business moves from loss-making to profitable. Inputs may include service pricing, number of clients, billable hours, cost structure, hiring schedule, and monthly overhead. Outputs may include the break-even month, break-even revenue level, required client volume, and margin of safety under different assumptions. This section is especially useful for entrepreneurs and founders because it clarifies how much traction is needed before the business becomes self-sustaining. It can also support funding discussions by showing how long the firm may need startup capital or working capital before operations can support themselves.
Cash Flow Forecasting and Liquidity Planning
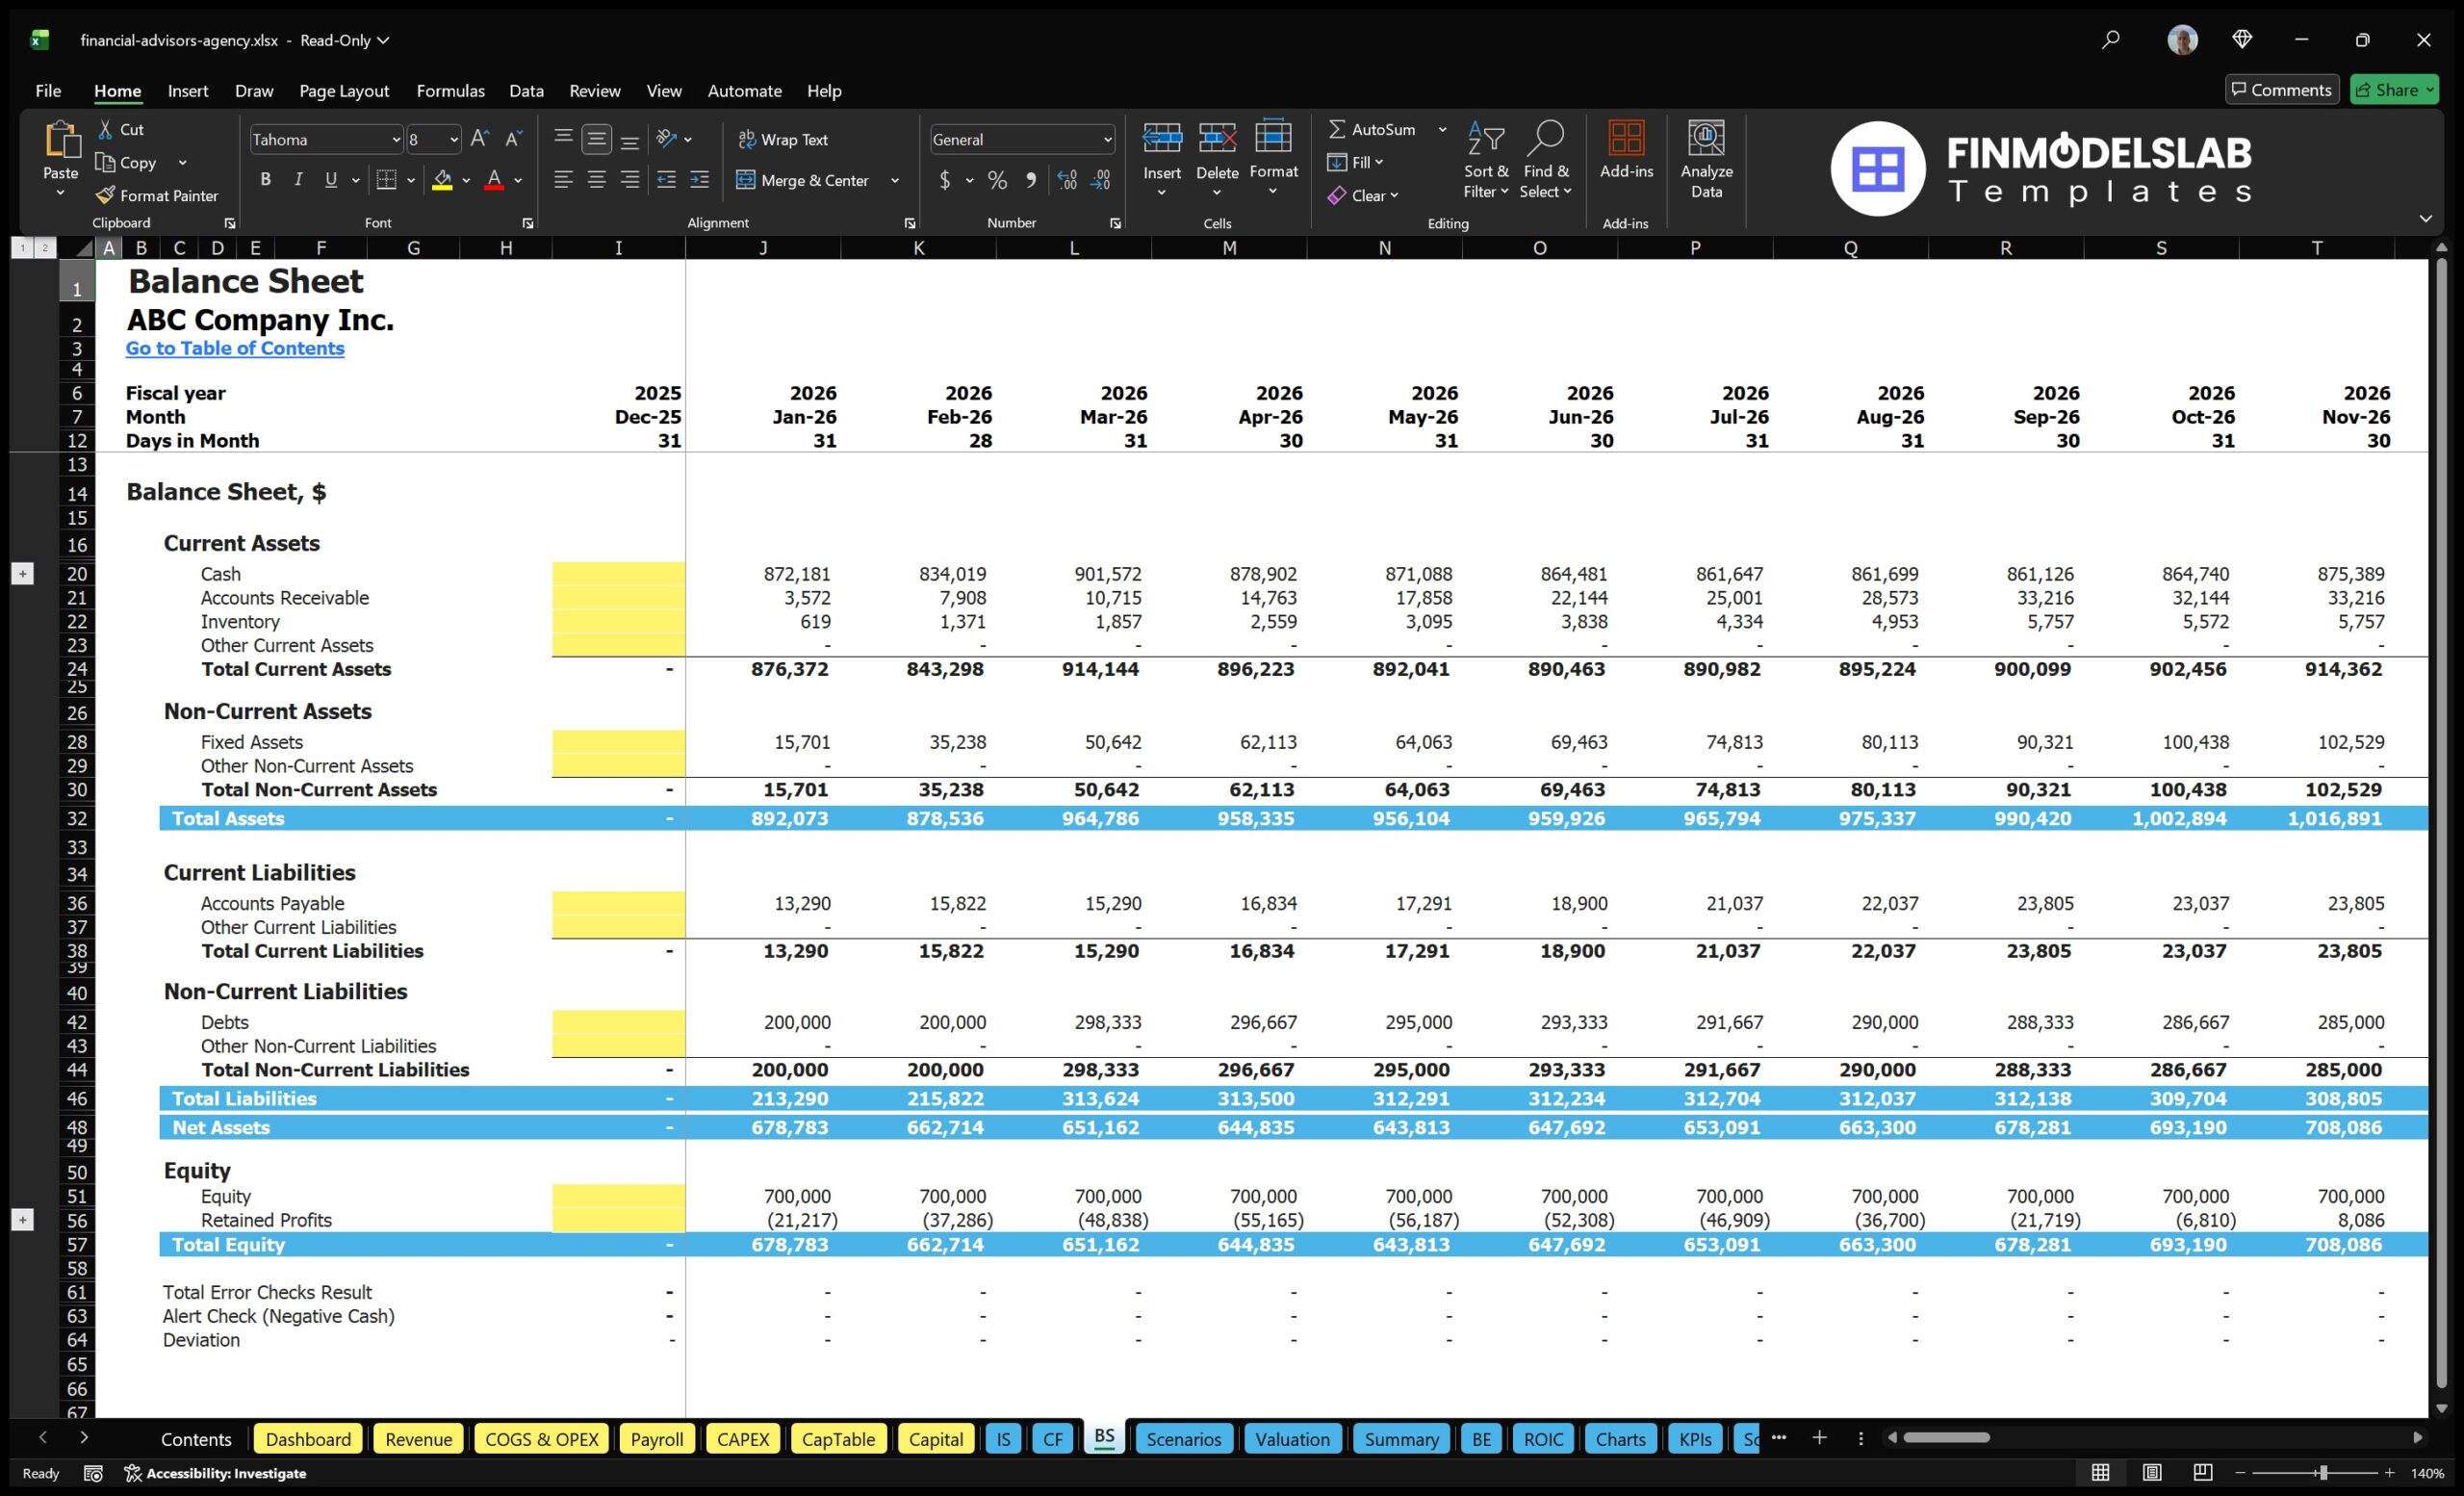
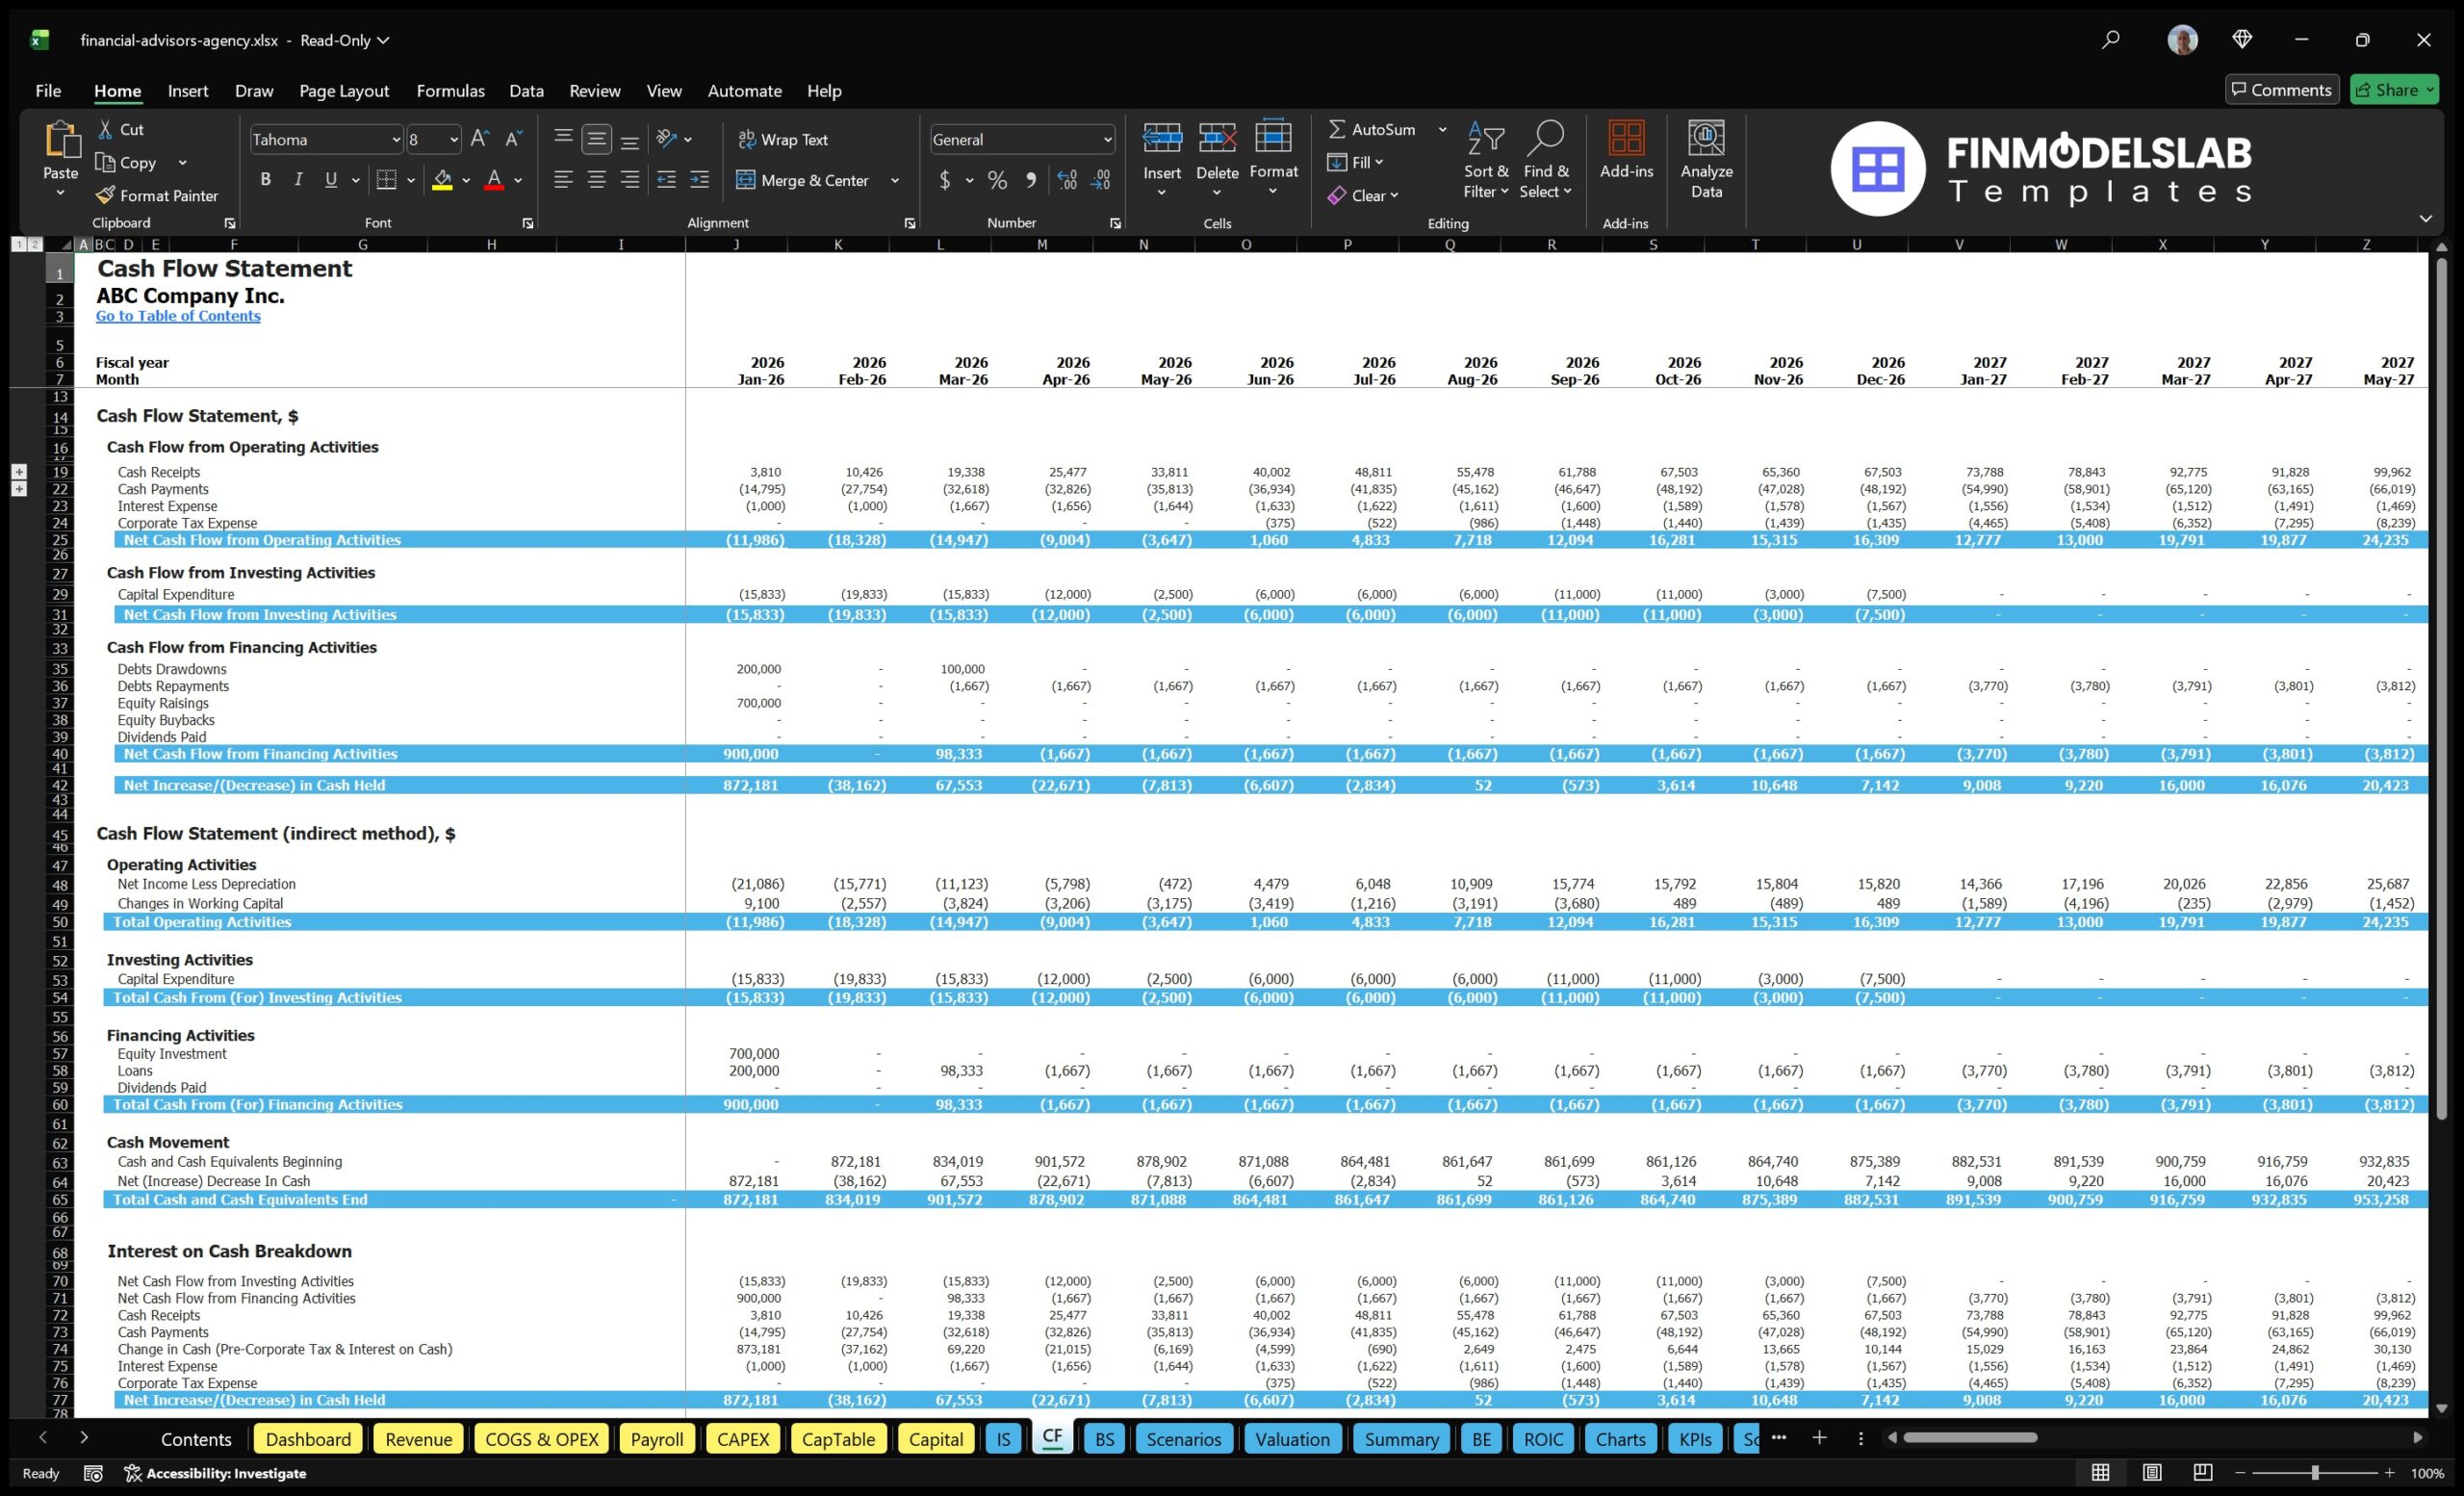
The cash flow forecasting and liquidity planning component helps users understand the timing of cash inflows and outflows across the planning period. A financial advisory firm may appear profitable on paper while still facing cash pressure due to upfront startup costs, delayed client payments, payroll commitments, technology investments, marketing spend, debt service, or seasonal fluctuations in sales activity. This section may use assumptions for collections, operating expenses, capital expenditures, taxes, financing, owner contributions, and cash reserves to generate monthly and annual cash flow projections. Outputs can include ending cash balance, minimum cash requirement, cash runway, funding gap, and periods of potential liquidity pressure. This is valuable for budgeting, lender conversations, and day-to-day decision-making because it helps users plan ahead for shortfalls, avoid undercapitalization, and determine whether additional financing, delayed spending, or revised growth assumptions may be needed. For a Financial Advisor Financial Model, cash flow planning is particularly important because early client acquisition and trust-building may take time, while the business still needs enough liquidity to maintain professional operations.
File types:
Excel – Single-User: .xlsx
Excel – Multi-User: .xlsx
Similar ProductsOther customers were also interested in...





 HenrySheykin
Bookkeeping Agency Financial Model Excel Template
The Accounting Firm Financial Model Template helps founders, practice owners, consultants, analysts,... Read more
 Giorgos
Accounting Firm – 10 Year Financial Model
10-year financial model for an accounting firm providing forecasts, profitability analysis, and insi... Read more
Auditor Financial Model Excel Template
The Auditing Firm Financial Model helps founders, consultants, analysts, and business owners turn an... Read more
 ECF Consultancy
Startup Business Plan – Consulting Firm
If you dream to start a Consulting Firm Business, the template is the first step in making your drea... Read more
Law Firm Financial Model Excel Template
The Law Firm Financial Model Template helps users turn a legal practice concept into a structured fi... Read more
Business Brokerage Financial Model Excel Template
The Business Brokerage Financial Model helps entrepreneurs, brokerage owners, consultants, analysts,... Read more
Architecture Firm Financial Model Excel Template
The Architectural Firm Financial Model Template helps founders, architecture practice owners, consul... Read more
Notary Financial Model Excel Template
The Notary Service Financial Model helps entrepreneurs, business owners, consultants, analysts, and ... Read more
Legal Services Financial Model Excel Template
The Legal Services Financial Model Financial Model Template helps entrepreneurs, law firm founders, ... Read more
Travel Agency Financial Model Excel Template
The Travel Agency Financial Model helps entrepreneurs, founders, consultants, analysts, and business... Read more
You must log in to submit a review.