
0 ITEMS

Business Brokerage Financial Model Excel Template
The Business Brokerage Financial Model helps entrepreneurs, brokerage owners, consultants, analysts, and founders create a structured financial forecast for a business brokerage built around the way brokerage deals actually operate. Instead of relying on a generic spreadsheet, this financial model template connects revenue assumptions, billable advisory work, valuation services, exit strategy consulting, marketing-driven client acquisition, advisor compensation, commission structures, startup costs, operating expenses, cash flow, and profitability into one editable planning tool. It is designed to support both new brokerage launches and established firms evaluating expansion, staffing, funding, or performance targets. This template gives users a practical way to translate commercial assumptions into financial projections. Users can estimate how many clients may be acquired, how revenue changes by service line, how pricing and billable hours affect monthly performance, and how payroll, commissions, software, rent, marketing, professional services, and other operating expenses influence the bottom line. It also helps map the capital required before meaningful revenue begins, making it useful for determining startup funding needs, planning cash reserves, and preparing realistic expectations for the early ramp-up period of a people-intensive service business. Built for business planning, funding preparation, lender discussions, investor presentations, and internal decision-making, the model provides a five-year view of the brokerage’s potential performance. It helps users review projected revenue, gross margin, EBITDA, net income, cash flow, and key performance indicators in a format that is easier to explain to partners, lenders, investors, or management teams. The model also supports scenario planning, so users can test low, base, and high outcomes by adjusting assumptions such as customer acquisition cost, billable hours, pricing, conversion rates, advisor productivity, and operating cost levels. The Business Brokerage Financial Model is fully customizable and ready to use in Microsoft Excel or Google Sheets, allowing users to edit assumptions without building formulas from scratch. It is especially useful for anyone preparing a business plan, evaluating a brokerage launch, raising capital, presenting financials to stakeholders, or deciding whether the business can reach sustainable profitability. By organizing financial planning, revenue assumptions, startup costs, operating expenses, payroll, cash flow, profitability, and break-even analysis in one place, the template helps buyers make clearer, more confident decisions before committing time and capital.
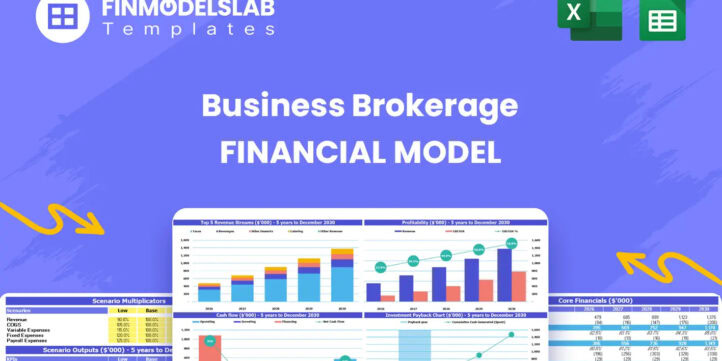


Financial Model Overview
The Business Brokerage Financial Model is a ready-to-use financial model template designed specifically for a business brokerage that earns revenue through advisory services, valuation work, exit planning, transaction support, and deal-related professional services. A brokerage model depends on a combination of client acquisition, billable hours, service pricing, advisor productivity, closing timelines, compensation structures, marketing spend, and operating discipline, so a generic forecast often fails to capture the true economics of the business. This template gives entrepreneurs, brokerage owners, consultants, analysts, and founders a structured way to plan revenue, estimate startup capital, manage operating expenses, forecast cash flow, evaluate profitability, and prepare investor-ready or lender-ready financial outputs. It is fully editable, compatible with Microsoft Excel and Google Sheets, and built to support business planning, funding preparation, internal budgeting, and strategic decision-making over a multi-year forecast period.
All-in-One Dashboard
The all-in-one dashboard brings the most important inputs and outputs of the Business Brokerage Financial Model into one central view, giving users a fast way to understand the overall financial picture without searching through every worksheet. This component typically summarizes core assumptions such as service pricing, billable hours, client acquisition activity, marketing spend, staffing levels, payroll, startup investment, and operating cost drivers, then connects them to high-level outputs such as revenue, EBITDA, net income, cash position, margins, return metrics, and funding needs. For a business brokerage, this is especially useful because performance is driven by several moving parts, including how many clients are acquired, which services they purchase, how much advisor capacity is available, and how quickly revenue ramps up. The dashboard helps users compare planned assumptions against projected outcomes, identify whether the model is financially balanced, and quickly explain the business case to investors, partners, lenders, or internal decision-makers. Because the dashboard is designed as a central command area, it also saves time during planning sessions by allowing users to review the forecast, spot pressure points, and make more informed changes before committing to hiring, marketing, expansion, or funding decisions.
Low Base High Scenario Analysis
The low, base, and high scenario analysis component allows users to test how the business brokerage could perform under different market and operating conditions. Instead of relying on a single forecast, users can compare conservative, expected, and optimistic versions of the model by adjusting assumptions such as customer acquisition cost, marketing conversion rates, billable hours per client, service pricing, client mix, payroll growth, advisor utilization, and operating expenses. For example, a low case may reflect slower client acquisition or reduced billable hours, while a high case may assume stronger referral conversion, improved pricing power, or more efficient marketing spend. This component is valuable because business brokerage revenue can fluctuate based on deal flow, economic conditions, seller readiness, buyer demand, and the firm’s ability to turn relationships into paid advisory engagements. Scenario analysis helps users understand cash runway, profitability timing, staffing affordability, and risk exposure before decisions are made. It also provides a stronger planning framework for investor conversations because stakeholders can see how the business may perform if assumptions change. By comparing low, base, and high outcomes, users can prepare contingency plans, set more realistic targets, and identify which drivers have the greatest impact on long-term financial performance.
Professional Charts
The professional charts component converts the model’s financial outputs into visual reports that are easier to review, present, and discuss with stakeholders. These charts may show revenue growth, revenue by service line, EBITDA trends, cash balance movement, margin development, expense categories, profitability progression, client growth, or other key metrics relevant to a business brokerage. For users preparing a business plan, investor deck, lender submission, or internal review, visual reporting helps communicate the financial story more clearly than raw spreadsheet numbers alone. A brokerage forecast often includes multiple revenue streams and cost categories, so charts make it easier to see whether growth is being driven by transaction advisory, valuation reports, exit strategy consulting, repeat clients, stronger pricing, or increased advisor capacity. They also help users identify potential concerns, such as cash flow troughs, delayed profitability, rising payroll burden, or overdependence on a single service line. The professional formatting supports a polished presentation and helps users explain assumptions and outcomes in a more credible way. This is particularly useful during stakeholder meetings, where quick interpretation matters and decision-makers need to see trends, comparisons, and financial direction at a glance.
ROE Components and DuPont Analysis
The ROE components and DuPont analysis section helps users understand the drivers behind return on equity rather than viewing profitability as a single isolated number. In a business brokerage, returns are influenced by operating margin, asset efficiency, financing structure, compensation costs, marketing productivity, and the pace at which the firm converts startup investment into sustainable earnings. This component can break return on equity into underlying drivers such as net profit margin, asset turnover, and equity multiplier, giving users a more detailed view of how operating decisions affect investor returns. Inputs may include net income, total assets, equity investment, revenue, expenses, cash balances, and balance sheet projections, while outputs may include ROE, margin analysis, and supporting return metrics. This is useful for founders and investors because it explains whether returns are improving due to better profitability, more efficient use of resources, or changes in capital structure. It also helps users evaluate whether the business is generating enough return for the capital and effort required. For funding preparation, this section adds depth to the financial story by showing stakeholders not only what the expected returns are, but why those returns occur and which operational levers can improve them over time.
Revenue Inputs
The revenue inputs component is one of the most important parts of the Business Brokerage Financial Model because it defines how the firm generates income. This section is designed around researched and editable revenue assumptions relevant to a brokerage, including billable hours, hourly rates, service mix, customer acquisition cost, marketing budget, new client volume, client conversion, and the share of clients using each service. Revenue streams may include transaction advisory, valuation reports, exit strategy consulting, and other brokerage-related professional services. Users can adjust pricing assumptions, expected monthly hours, growth rates, client acquisition activity, and service adoption percentages to reflect their specific market, team experience, positioning, and growth strategy. The outputs generated from these inputs flow into the revenue forecast, profit and loss statement, cash flow forecast, dashboard, and scenario analysis. This section is useful because small changes in billing rates, advisor utilization, or client acquisition efficiency can have a large impact on revenue and profitability. By structuring the revenue model around the actual drivers of a business brokerage, the template helps users move beyond broad sales estimates and build a forecast that reflects how clients are won, serviced, billed, and retained.
Bank-Ready Reports
The bank-ready reports component organizes the financial projections into clear outputs suitable for lenders, investors, partners, and other stakeholders reviewing the business. These reports may include forecasted profit and loss statements, cash flow statements, balance sheet summaries, revenue schedules, expense schedules, funding requirements, and key financial metrics. For a business brokerage seeking startup funding, working capital, a line of credit, or expansion financing, lender-friendly reporting is important because banks and financing partners want to see how revenue will be generated, when the business becomes profitable, whether cash flow can support obligations, and how much capital is required before the company becomes self-sustaining. The model’s structured reporting format helps users present assumptions and results in a professional, consistent way. Inputs from revenue planning, startup costs, operating expenses, payroll, and financing assumptions automatically flow into these outputs, reducing manual preparation time and improving consistency across the forecast. This component is useful for preparing business plans, loan applications, investor updates, and management presentations because it turns detailed financial modeling work into readable reports that support credibility, transparency, and decision-making.
Revenue Breakdown
The revenue breakdown component provides a detailed view of how total brokerage revenue is distributed across different services and business activities. Instead of showing only one top-line revenue number, this section separates income sources such as transaction advisory, valuation reports, exit strategy consulting, and any additional service categories the user chooses to add. It may show monthly and annual revenue by stream, pricing assumptions, volume assumptions, billable hours, client participation rates, and growth trends. For a business brokerage, this level of detail is important because not all services have the same margin profile, sales cycle, staffing requirement, or scalability. Transaction advisory may produce higher revenue per client, valuation reports may provide steadier professional service income, and exit strategy consulting may help build longer-term advisory relationships. By reviewing the revenue breakdown, users can identify which services contribute most to growth, which offerings should receive more marketing focus, and whether the firm is overly dependent on one type of work. This component also helps with budgeting and staffing because revenue by stream can be connected to advisor capacity, client service workload, and operational requirements. It supports better decision-making by showing not just how much revenue the brokerage may generate, but where that revenue is coming from.
KPI Dashboard
The KPI dashboard tracks the performance metrics and benchmarks that matter most for a business brokerage, giving users a concise view of operational and financial health. Key performance indicators may include customer acquisition cost, marketing spend efficiency, revenue per client, billable hours, gross margin, net profit margin, EBITDA margin, cash balance, payback period, break-even timing, return on investment, return on equity, and other financial ratios. This component helps users compare projected performance against internal targets or industry expectations and identify whether the business is on track. For example, if customer acquisition cost rises while revenue per client remains flat, the model can highlight pressure on profitability. If billable hours increase faster than staffing capacity, the dashboard may suggest a need to hire or improve utilization planning. The KPI dashboard is useful for founders, managers, consultants, and investors because it translates complex financial projections into practical performance signals. It also supports monthly review meetings and strategic planning by showing whether marketing, pricing, staffing, and cost decisions are improving or weakening the business model. By monitoring KPIs in one place, users can make faster, more evidence-based decisions and adjust assumptions before problems become larger financial risks.
Startup Cost and Operating Expense Planning
The startup cost and operating expense planning component helps users estimate the capital required to launch and operate the business brokerage before it reaches stable profitability. Startup costs may include office setup, furnishings, secure client portal development, CRM implementation, website development, legal setup, licensing, professional services, initial branding, software subscriptions, insurance, deposits, technology equipment, and initial working capital. Operating expenses may include rent, utilities, payroll, commissions, marketing, software, insurance, professional fees, travel, subscriptions, administrative support, and other recurring costs needed to run the firm. The section connects these costs to the broader forecast so users can see how spending decisions affect cash runway, profitability, and funding needs. This is particularly important for a brokerage because revenue may take time to build while fixed costs begin immediately, creating a ramp-up period that must be financed carefully. By organizing both one-time and recurring expenses, the model helps users avoid underestimating the cash required to open, hire, market, and serve clients professionally. It also supports better budgeting by making it easier to separate essential launch investments from optional spending. For business plans and funding discussions, this component provides a clear explanation of how much capital is needed, where it will be used, and how expenses are expected to evolve as the brokerage grows.
Break-Even Analysis
The break-even analysis component helps users identify when the business brokerage is expected to cover its cumulative costs and begin operating on a financially sustainable basis. This section uses revenue forecasts, startup costs, payroll, commissions, fixed expenses, variable costs, gross margin, and cash flow assumptions to determine the point at which revenue is sufficient to offset both launch investment and ongoing operating costs. For a brokerage firm, break-even timing is a critical planning milestone because the business may experience early losses while building brand awareness, acquiring clients, hiring advisors, and developing a pipeline of paid engagements. The analysis helps users understand how pricing, billable hours, customer acquisition cost, marketing efficiency, staffing decisions, and service mix can accelerate or delay profitability. It can also show how much cash may be required before the business reaches break-even, which is useful for setting funding targets and avoiding liquidity gaps.
Similar ProductsOther customers were also interested in...


 HenrySheykin
Law Firm Financial Model Excel Template
The Law Firm Financial Model Template helps users turn a legal practice concept into a structured fi... Read more
Auditor Financial Model Excel Template
The Auditing Firm Financial Model helps founders, consultants, analysts, and business owners turn an... Read more
Financial Advisors Agency Financial Model Excel Te...
The Financial Advisor Financial Model is a ready-to-use financial model template built for planning,... Read more
Legal Services Financial Model Excel Template
The Legal Services Financial Model Financial Model Template helps entrepreneurs, law firm founders, ... Read more
Corporate Trainer Financial Model Excel Template
The Corporate Training Financial Model helps users turn a professional development or corporate lear... Read more
Attorney Employment Agency Financial Model Excel T...
The Recruiting Agency Financial Model helps founders, agency owners, consultants, and analysts build... Read more
Bookkeeping Agency Financial Model Excel Template
The Accounting Firm Financial Model Template helps founders, practice owners, consultants, analysts,... Read more

 Giorgos
Accounting Firm – 10 Year Financial Model
10-year financial model for an accounting firm providing forecasts, profitability analysis, and insi... Read more

 ECF Consultancy
Startup Business Plan – Consulting Firm
If you dream to start a Consulting Firm Business, the template is the first step in making your drea... Read more
Architecture Firm Financial Model Excel Template
The Architectural Firm Financial Model Template helps founders, architecture practice owners, consul... Read more
You must log in to submit a review.