
0 ITEMS

Top 5 Principles of Corporate Finance

Understanding the core principles of corporate finance can significantly influence business success and long-term growth.
- Companies that prioritize cash flow management ensure liquidity and operational efficiency.
- Valuing projects involves assessing the time value of money through discounted cash flow analysis.
- Balancing risk and return guides strategic decisions, from investments to capital structure.
- Effective capital allocation using methods like NPV and IRR maximizes shareholder value.
- Generating positive economic profit indicates a firm’s ability to create real value beyond covering costs.
Mastering these principles helps in making smarter financial decisions and building resilient business models.
1. Cash Flow is King
“Decisions should focus on cash flows, not profits.”
The principle emphasizes that corporate finance decisions should be guided by cash flows rather than accounting profits. Cash flow measures actual cash movement in and out of business while accounting profits reflect earnings after adjustments that may not involve cash. While accounting profits can be influenced by non-cash items like depreciation and may not reflect the true timing of revenues and expenses, cash flows focus on the actual inflow and outflow of money, enabling better assessment of liquidity, investment potential, and long-term viability. In essence, cash flows determine a firm’s capacity to pay dividends, reinvest in operations, and fund future growth. It provides a clearer picture of a company’s financial health and ability to generate value for shareholders.

Focusing on cash inflows and outflows better assesses the viability and profitability of potential investments. Instead of relying solely on accounting profits, a robust financial model will track Free Cash Flow (FCF), which measures the liquidity available to the business after capital expenditures. By emphasizing cash flows, decision-makers can evaluate the true economic value of an investment, considering the timing, magnitude, and risk associated with future cash flows. This approach allows businesses to compare investments on an apples-to-apples basis, prioritize projects with higher cash flow generation, and ensure efficient capital allocation to maximize shareholder value.
Practical Example of the Free Cash Flow Analysis
Understanding the profitability and value of investments requires thoroughly examining cash flows, as demonstrated in this comparative analysis of Project A and Project B using free cash flow metrics.

Based on the analysis, Project B is the superior investment, as it has a higher net present value of its cash flows. Since NPV measures the absolute profitability of an investment, a higher NPV indicates a more attractive investment.
2. Time Value of Money Concept
“Money invested today is worth more than money invested tomorrow.”
The time value of money concept, a fundamental principle of corporate finance, states that money available now is worth more than the same amount in the future due to its potential earning capacity. This principle underlies many financial decisions, from investments to project evaluations. In project evaluations, the time value of money concept allows managers to compare the value of future cash flows, assessing whether investments or projects yield more value when considering present and future earnings. This understanding is crucial for making sound investment decisions and effective project planning.

Two critical factors within the time value of money concept are compounding and discounting. Compounding refers to the process where the value of an investment grows due to interest earned on both the initial principal and the accumulated interest over previous periods. Conversely, discounting involves determining future cash flows’ net present value (NPV) by applying a discount rate. Discounting helps firms evaluate whether long-term projects are financially viable when adjusted for risk and time in corporate finance.
Practical Example of the Time Value of Money Concept
The time value of money concept in corporate finance is especially useful for evaluating investment opportunities or financing decisions. Here’s a practical example of assessing a capital investment project using the time value of money concept:
Suppose a company is considering an investment in new machinery that costs $1,000,000. This machinery is expected to generate future cash flows over the next 5 years as follows:
- Year 1: $20,000
- Year 2: $25,000
- Year 3: $30,000
- Year 4: $35,000
- Year 5: $50,000
The company’s required rate of return (discount rate) for such projects is 10%. This rate is a key factor in evaluating such an investment, representing the minimum return the company expects from its investments, considering risk and the time value of money. Here’s an Excel table of the calculation using the time value of money concept, which discounts future cash flows to present value for accurate project evaluation:

When we sum the present values of all future cash flows, we get $116,320. It represents what the future cash flows are worth today after accounting for the time value of money. The NPV is the difference between the total present value of future cash flows ($116,320) and the initial investment ($100,000). A positive NPV of $16,320 means that after accounting for the time value of money, the project will generate $16,320 more than the initial investment at a 10% discount rate. This implies that the project is expected to add value to the company. If the NPV were negative, the project would not cover its cost of capital, indicating a loss when considering the time value of money.





















































3. The Risk and Return Trade-Off
“Higher risk demands higher returns.”
The risk and return trade-off principle, a guiding light in corporate finance, underscores the intrinsic link between risk and return. It dictates that potential returns on an investment rise in tandem with the level of risk. Companies must navigate this principle, balancing the allure of higher returns with the risk that these returns may not materialize. Similarly, investors demand higher compensation for shouldering additional risk. This principle, a beacon in the financial landscape, guides many financial decisions, from asset allocation to capital structure decisions, ensuring firms don’t overexpose themselves to risk while pursuing growth.

Financial managers use several tools, including standard deviation, beta, and Value at Risk (VaR), to quantify and assess the risk-return trade-off.
- Standard deviation measures the dispersion of returns around the mean, showing the asset’s volatility.
- Beta quantifies an asset’s sensitivity to market movements by comparing its returns to a benchmark index.
- Value at Risk (VaR) estimates an asset or portfolio’s maximum potential loss over a specific period with a given confidence level.
By understanding these metrics, corporations can weigh the potential upsides of risky ventures, such as expanding into new markets or launching innovative products, against the financial hazards.
Practical Example of the Risk and Return Trade-Off
The Capital Asset Pricing Model (CAPM), a key risk and return trade-off model, is instrumental in determining the appropriate required rate of return for an investment given its risk, as represented by its beta. More importantly, the model aids financial managers in evaluating whether an investment offers sufficient return relative to its risk, thus guiding investment decisions that align with the company’s risk appetite and strategic goals. The CAPM formula for expected return is Expected Return = Risk-Free Rate + Beta x (Market Return – Risk-Free Rate). Here’s a practical example:
Company X is considering two investment options:
- Investment A has a beta of 1.2.
- Investment B has a beta of 0.8.
The risk-free rate is 3%, and the expected market return is 8%. Here is the resulting CAPM calculation of the expected return for both investments:
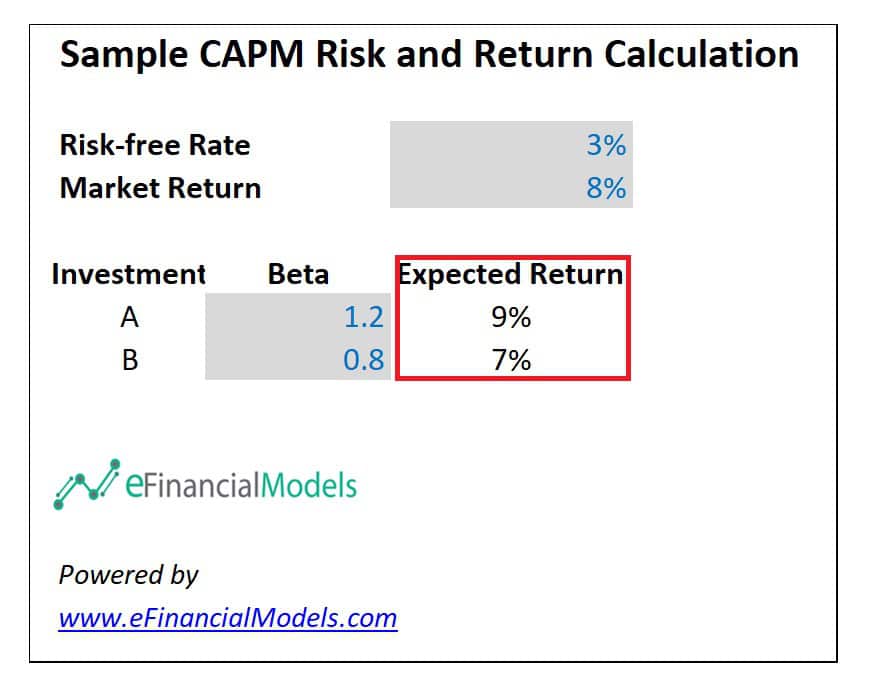
As shown above, investment A offers a higher return (9%) but comes with greater risk (beta = 1.2), while Investment B provides a lower return (7%) with less risk (beta = 0.8). The better investment depends on the company’s risk tolerance. Investment A is better if the company prefers higher returns and can tolerate more risk. If the company wants to minimize risk, Investment B is more suitable. Although, investment A is generally favored due to its higher expected return (9%) relative to its risk (beta = 1.2), which aligns with the risk and return trade-off principle of higher risk leading to higher returns.
4. Efficient Capital Allocation via Capital Budgeting Analysis
“Successful capital allocation hinges on analyzing long-term returns, not short-term gains.”
Capital budgeting analysis, a core principle of corporate finance, involves evaluating potential long-term investments or projects. As finance professionals, business students, or individuals interested in corporate finance and investment evaluation, you play a crucial role in this process. Whether it’s acquiring other companies, building new facilities, or expanding operations, your expertise is vital in determining the financial viability of these investments and their alignment with a company’s strategic goals. Capital budgeting analysis typically uses methods like Net Present Value (NPV), Internal Rate of Return (IRR), Payback Period, and Cash on Cash Yield to assess the potential return and risks associated with the project.
- The Internal Rate of Return (IRR) is the discount rate at which the project’s NPV is zero. Comparing the expected rate of return helps. When comparing investments, a higher IRR is generally considered better, indicating a greater return on investment. However, the project’s risk, cost of capital, and investor expectations should still be evaluated.
- Net Present Value (NPV) calculates the difference between the present value of cash inflows and outflows for a project, determining whether it will add value to the firm. A positive net present value (NPV) indicates that the investment is expected to generate more value than its cost, with a higher NPV signifying a more attractive opportunity than other investments.The payback period measures how long it takes for the initial investment to be recovered through the project’s cash flows, indicating the risk associated with the investment. A better payback period is shorter, indicating the investment will recover its initial cost more quickly, reducing risk and freeing up capital for other opportunities sooner.
- Cash-on-cash yield measures the annual return on an investment relative to the total cash invested. It is calculated as the ratio of annual pre-tax cash flow to the initial cash outlay, expressed as a percentage. A better cash-on-cash yield is higher, as it signifies a greater annual return relative to the amount of cash invested, making the investment more attractive in immediate cash flow.
By systematically analyzing these factors, companies ensure that capital is allocated efficiently to projects that have a direct impact on shareholder value. Your decisions in the capital budgeting process carry significant weight, as they can either enhance or diminish the value of the company for its shareholders.

Capital budgeting analysis is a financial exercise and a strategic tool that aligns with corporate goals. When done correctly, it helps businesses invest in opportunities that enhance competitive advantage, operational efficiency, and market share. However, poor capital budgeting decisions can tie up resources in unproductive projects, hampering growth and reducing shareholder value. As such, companies must critically evaluate each potential investment’s long-term impact on financial performance and strategic positioning.
Practical Example of Capital Budgeting Analysis
Here’s an example of a capital budgeting analysis involving two potential projects:
- Project A requires an initial investment of $200,000, with annual cash inflows of $60,000 for five years.
- Project B requires an initial investment of $150,000, with annual cash inflows of $50,000 for five years.
Using a discount rate (WACC) of 10%, here’s the resulting capital budgeting analysis table:
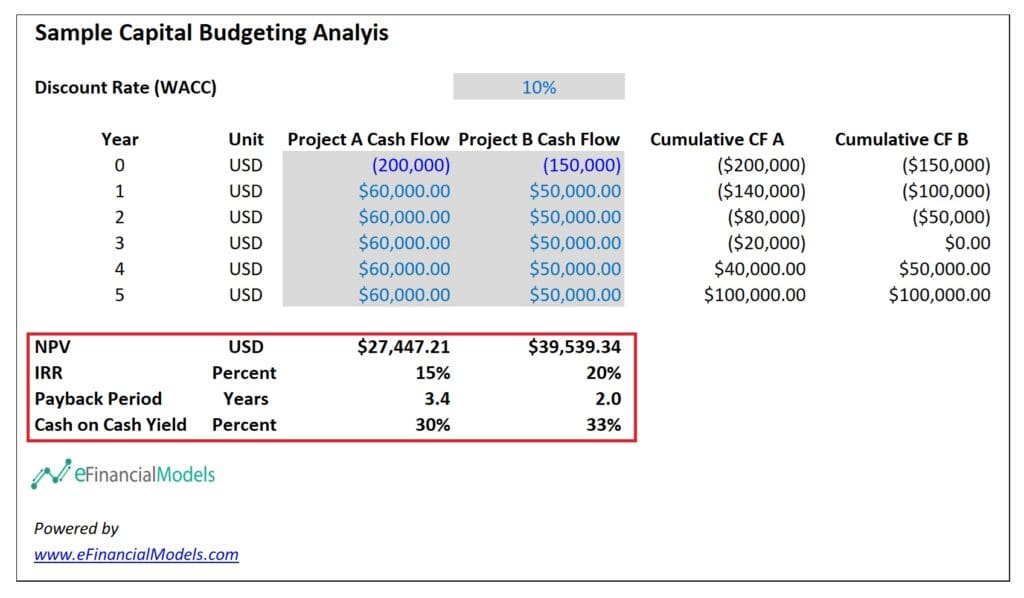
Based on the capital budgeting analysis, Project B is the better investment. It has a higher NPV of $39,539.34 than Project A’s $27,447.21, indicating greater profitability. Project B also has a superior IRR of 20%, surpassing Project A’s 15%, suggesting a higher return on investment. Plus, it has a higher cash-on-cash yield of 33%. Additionally, Project B offers a faster payback period of 2.0 years, compared to 3.4 years for Project A, making it the more attractive option based on all key financial metrics.














5. Positive Economic Profit
“Generating positive economic profit is the ultimate test of business success, proving capital is used wisely.”
Positive economic profit represents a company’s ability to generate value beyond opportunity costs. It occurs when a firm’s total revenue exceeds the sum of both explicit and implicit costs, including the required return on capital. In other words, positive economic profit indicates that the company is not just covering its operating and capital expenses but is also delivering a return that exceeds the expected compensation for taking on business risk.

This principle is fundamental in corporate finance because it serves as a benchmark for evaluating whether a firm is creating real value for its shareholders. Companies strive to achieve a positive economic profit by targeting returns that exceed the cost of capital. Suppose a company can consistently generate positive economic profit. In that case, it has a competitive advantage and is using its resources more efficiently than other market investment opportunities. Consequently, understanding and pursuing positive economic profit helps guide managerial decisions, strategic planning, and long-term sustainability.
Practical Example of Economic Profit Analysis
Economic profit is calculated by subtracting the cost of capital from the project’s Internal Rate of Return (IRR). The cost of capital, typically represented by the Weighted Average Cost of Capital (WACC), plays a significant role in this calculation. It is determined by considering the proportionate costs of equity and debt and serves as the minimum return a company needs to justify its investment decisions and maintain its value. The difference evaluates whether the return exceeds the minimum required rate of return. Here’s an example economic profit analysis:
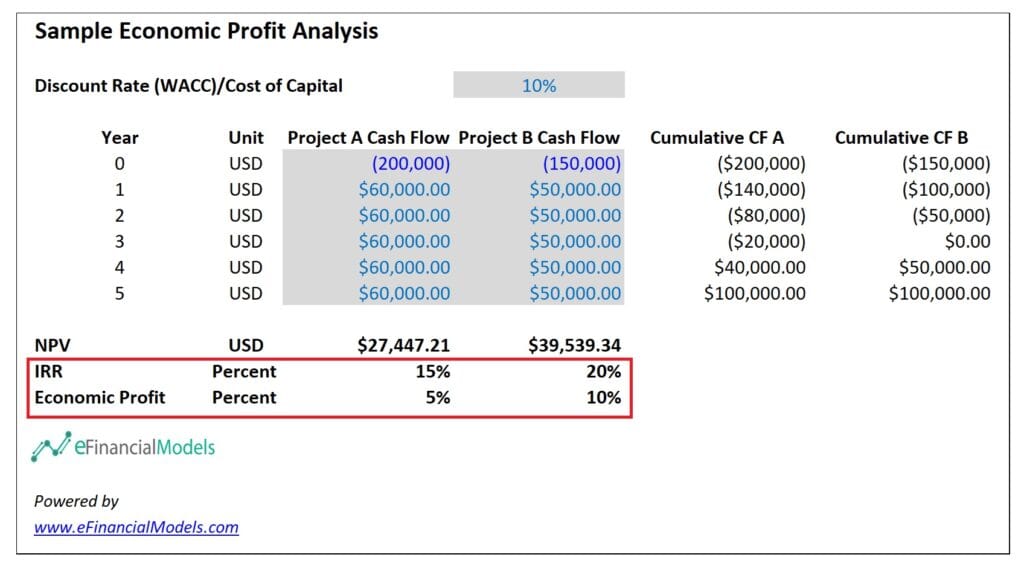
This sample economic profit analysis compares the cash flows of two projects, A and B, using a 10% discount rate over five years. Both projects require an initial investment, with Project A starting at -$200,000 and Project B at -$150,000. Over the five years, both generate positive cash flows, resulting in Net Present Values (NPVs) of $27,447.21 for Project A and $39,539.34 for Project B. The Internal Rate of Return (IRR) is 15% for Project A and 20% for Project B, while both showed a positive economic profit at 5% and 10%, respectively. Since both projects have a positive economic profit, they are considered viable investments. However, Project B is the superior option, given its higher NPV, IRR, and economic profit, indicating a more efficient use of capital.
Financial Modeling: Transforming Finance Principles into Profit
These top five principles of corporate finance are the foundation for creating robust financial models that drive strategic decision-making. Understanding that Cash Flow is King highlights the importance of liquidity and operational efficiency, while the Time Value of Money principle ensures accurate valuation of future cash flows. The Risk and Returns Trade-Off informs investors of the appropriate level of risk to pursue a desired return. Moreover, efficient capital allocation is key to maximizing shareholder value by deploying resources to their best use and focusing on positive economic profit. This ultimately distinguishes value-creating opportunities from those that merely cover costs. Integrating these principles helps build financial models that reflect a company’s current position and chart a clear path to future growth and profitability.

Financial modeling is a powerful tool that brings the top five principles of corporate finance to life by transforming abstract concepts into actionable insights. It helps create free cash flow projections highlighting the inflows and outflows, enabling businesses to manage liquidity and assess operational health. Financial models accurately discount future cash flows to evaluate the true worth of potential investments. Additionally, scenario analysis in these models allows for a deeper understanding of the risk and returns trade-off, helping stakeholders choose investment opportunities that align with their risk tolerance. Moreover, financial models support efficient capital allocation by optimizing capital budgeting decisions and showing which projects can generate the highest returns. Finally, financial modeling integrates profitability metrics, ensuring that companies focus on ventures that deliver value beyond a positive economic profit,
Ready to elevate your decision-making with data-driven insights? Leverage financial modeling to transform complex finance principles into clear, actionable strategies that drive business growth. Contact us today to discover how we can help you build powerful models that lead to smarter investments and better outcomes.




















You might also like:
- Financial Planning for Small Business Owners – Taking an SBA Loan
- How to Prepare a Financial Plan for a Chicken Egg Farm?
- A Step-By-Step Guide to the Merger and Acquisition Process
- 10 Tips to Develop a First Class Business Valuation Report
- Funding Sources for Businesses and Startups
- Finding a Valuation Model for Your Business
- Cash Flow Analysis in Excel
- Real Estate
- Financial Projections
- Understanding the Debt Service Coverage Ratio: An Essential Metric for Financial Analysis
- Mastering Business Finance: The Three-Statement Financial Model
- Top 10 Mistakes in DCF Valuation Models
- Agriculture
- Business Valuation
- Leveraging a Cash Flow Projection Template
- Finding Fair Market Value: A Quick Guide to Real Estate Valuation
- Financial Spreadsheet – A Key Tool for Entrepreneurs
- Financial Modeling
- Financial Planning for Gym Startups
- Automotive Supplier