
0 ITEMS

Top 10 Mistakes in DCF Valuation Models

Understanding how to accurately measure ROI and customer value is essential for sustainable business growth.
- Calculating ROI involves dividing the lifetime value (LTV) of a customer by the cost to acquire them (CAC).
- Mastering LTV and CAC helps optimize marketing spend and increases profitability.
- Analyzing the LTV:CAC ratio reveals whether customer acquisition is sustainable and profitable.
- Industry benchmarks suggest aiming for a ratio of at least 3:1 for healthy margins.
- Tracking and adjusting these metrics regularly supports continuous improvement and strategic decision-making.
These insights help businesses refine their growth strategies and maximize investment returns.

Discounted Cash Flow Explained
Discounted Cash Flow (DCF) is a method used to estimate a business’s value based on its future cash flows. It works by predicting how much money the business will make and adjusting that amount to today’s value using a discount rate. This helps investors see what those future earnings are worth right now. DCF is useful because it looks at real performance, not just market trends or guesses.
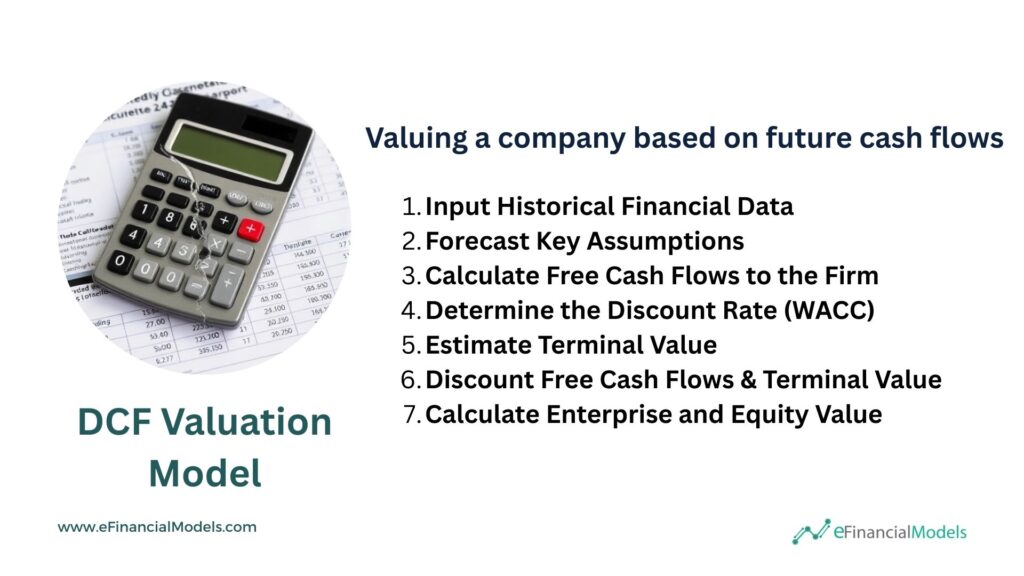
A Discounted Cash Flow (DCF) valuation starts by gathering a company’s past financial data. Next, you forecast future performance based on key assumptions. Then, you calculate Free Cash Flows to the Firm (FCFF), which shows how much cash the business can generate. After that, you determine the discount rate, often using the Weighted Average Cost of Capital (WACC). You estimate the terminal value using several methods to capture value beyond the forecast period. Then, you discount all future cash flows and the terminal value to today. Finally, you add everything to get the enterprise value and subtract debt to find the equity value.
A DCF valuation model requires a business plan with minimum 5 year forecasted financials to derive the expected Free Cash Flows to Firm (FCFF) which then are discounted by using the company’s Weighted Average Cost of Capital (WACC), the discount rate to get the present value of the company’s future Free Cash Flows. Cash Flows beyond year 5 are factored in with the Terminal Value (TV) calculation.
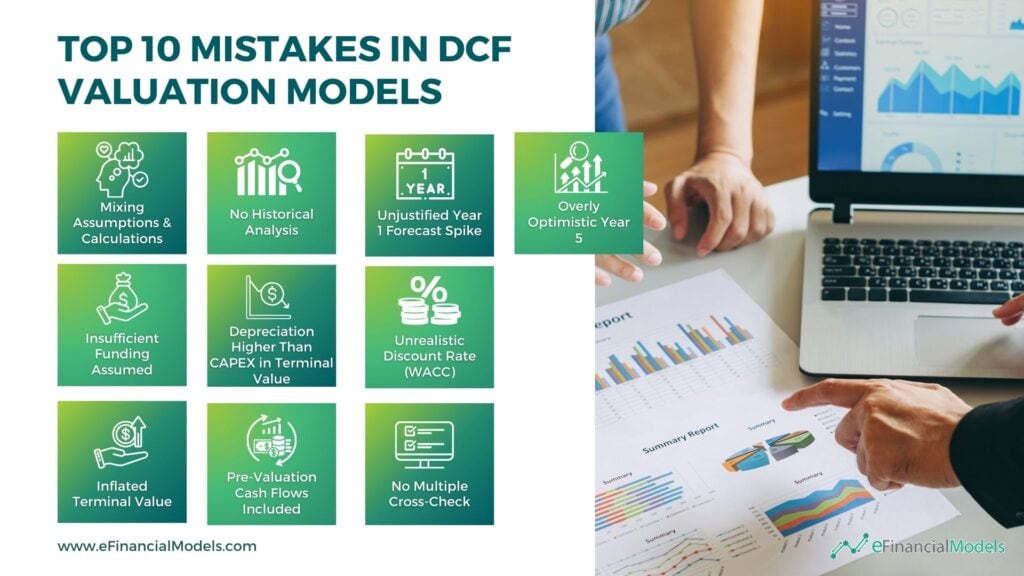
10 Costly Mistakes in DCF Valuation Models
By reviewing hundreds of DCF valuations, we have noticed a repetitive pattern of common mistakes made in such valuation models, seen over and over again. The following is our list of the Top 10 Mistakes made when building DCF valuation models.
(1) Mixing Assumptions and Calculations
Mixing assumptions and calculations in a DCF valuation model leads to confusion, errors, and wasted time. When assumptions are buried in formulas or scattered across the sheet, it becomes hard to audit or update the model. Whether you place assumptions on a separate sheet or beside the calculations, they must be clearly labeled and consistently formatted to avoid costly mistakes. Inputs should be marked—usually in blue—and kept separate from formulas shown in black. This simple color code helps users instantly recognize what they can change and shouldn’t touch.
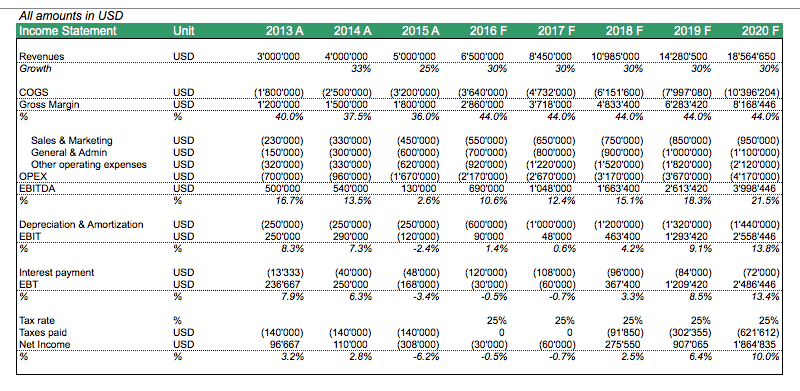
The above DCF valuation model mixes assumptions and calculations to confuse users. Inputs like tax rates, interest payments, and revenue growth percentages are scattered across the same sheet as hardcoded numbers and formulas, without consistent color coding or separation. It is hard to tell what can be adjusted and what drives the results. In a DCF valuation model, unclear inputs increase the risk of mistakes, slow down model reviews, and reduce transparency for stakeholders trying to follow your logic.
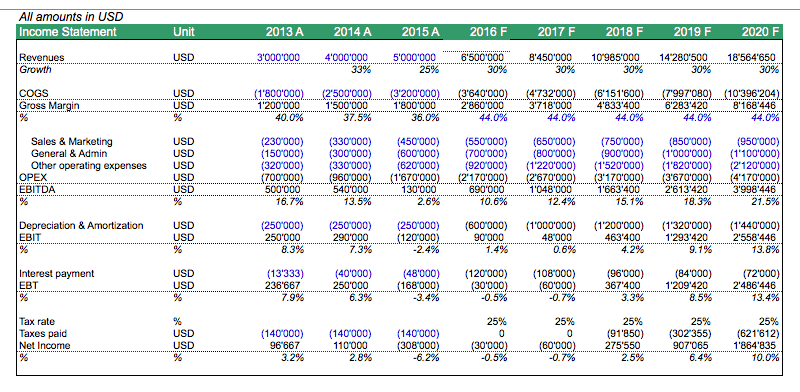
To avoid confusing assumptions in a DCF valuation model, group all inputs together and highlight them clearly, using a consistent color like blue. The above model does it right by separating key assumptions like growth rate, tax rate, and expenses while making them easy to spot. Place inputs on a dedicated sheet or beside calculations, but never mix them. Keeping inputs clean and visible helps users update the model quickly, reduces errors, and makes the logic easier to follow.
(2) No Historical Analysis
Skipping historical analysis is a major mistake in DCF valuation models. Without looking at past performance, you’re left guessing future cash flows with no solid base. You miss revenue, costs, and margins trends that guide accurate forecasting. This weakens the model’s credibility and misleads investors.
Solid DCF valuation models always begin with real, proven numbers. Before going into any business plan, it’s highly recommended to undertake a financial analysis of the business’s value.
- How does it compare to the level of financial debt to the company’s debt capacity?
- What are the historical profit margins, such as EBITDA?
- Does the company have sufficient Net Working Capital (Current Ratio)?
- Are the required days receivable, days inventory, and days payable?
- What is the efficiency of the allocated capital (Revenues/Assets)?
- How much was the historic return on invested capital (ROIC), and what is a likely scenario in the future?
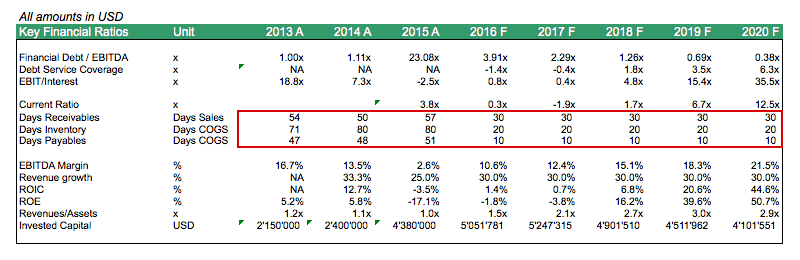
Above is a table that shows the forecast for Days Receivables, Days Inventory, and Days Payables, which is disconnected from the historical figures. Consequently, Net Working Capital levels might be significantly understated in the future, leading to a potential financing gap or dragging growth rates down.
(3) Unjustified Year 1 Forecast Spike
One common mistake in DCF valuation models is an unjustified Year 1 forecast spike. This happens when the first projected year shows an unrealistic jump in revenue or profits without a solid reason. It skews the entire valuation by inflating cash flows early on, making the business look more valuable than it is. Investors may be misled, especially if new contracts, product launches, or market shifts don’t back the spike. Always ensure Year 1 forecasts align with actual business trends or reasonable expectations. A smooth, defensible growth curve is better than a sudden leap that lacks explanation.

Look at the income statement above. The first forecast year (2016) forms the starting basis for the financial plan. As you can see, the gross profit margin jumps in 2016, and suddenly the company is performing much better than it has in its history. The way to validate the first forecast year is to check for current projects that could drive such growth (see also CAPEX), check back for historic figures, industry benchmarks, and quarterly results, which can either support or deny the plan’s financial feasibility.
(4) Overly Optimistic Year 5
One of the top mistakes in a DCF valuation model is showing an overly optimistic Year 5. Entrepreneurs are always optimistic about the future of their company, so there is a natural bias to paint a bright picture of the company’s future. Also, mostly only next year’s budget needs to be defended as it can be challenged more easily than a figure 5 years down the road. This can lead to a bias where the business plan gets overly optimistic. Without clear justification, many analysts project sharp revenue jumps, unrealistic profit margins, or sudden market dominance by Year 5. This skews the entire valuation, as Year 5 often drives a big part of the terminal value. It creates a false sense of growth and can mislead investors.
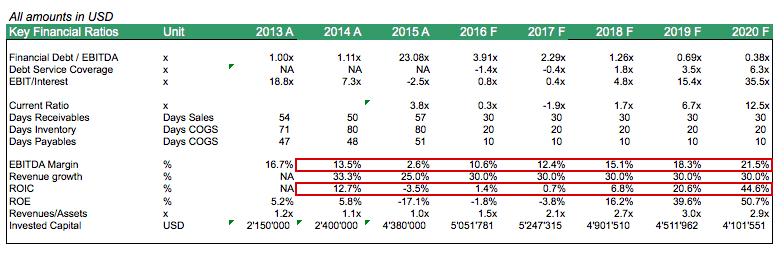
The DCF valuation above shows one of the classic errors—an overly optimistic Year 5. From 2015’s 17.1% ROE and 2.6% EBITDA margin, the model projects a sharp rise to 50.7% ROE and 21.5% EBITDA margin by 2020. That leap lacks a gradual build-up or solid proof, making Year 5 numbers look inflated. Unrealistic jumps like these distort terminal value, overstate business potential, and mislead decision-makers. Realistic growth should reflect consistent trends, not wishful spikes.
A model must reflect steady, achievable progress based on sound data, not wishful thinking. Stay realistic. One way to look at it is to focus on ROIC (Return on Invested Capital), which indicates the yearly profitability of the invested capital (equal to capital employed). Normally, ROIC should be higher than WACC, but in the long term, attractive ROICs will draw in competitors, which diminishes the ROICs in the long term. Therefore, for the final year of the forecast period, which also serves as the normalized cash flow year used in the Terminal Value calculation, some caution must be applied when claiming to generate high ROICs forever.






















































(5) Insufficient Funding Assumed
Assuming insufficient funding in a DCF valuation model is a critical mistake because it ignores the real capital needs of the business. If the model underestimates how much money is needed to fund operations or growth, it creates an unrealistic forecast of cash flows. This leads to inflated valuations and poor investment decisions. A proper DCF must reflect all financing needs, including working capital and capital expenditures, to give a true picture of a company’s value. Without this, investors are left with a flawed roadmap.

The business plan above shows a negative cash balance during years 1 to 3 of the forecast years. One would not even notice it by focusing only on the Free Cash Flow calculation. One can see the negative cash balance only by checking the forecasted Balance Sheet. This means the business is underfunded and will need an additional capital injection to execute this business plan. This needs to be considered in the valuation as well.
When looking at the business plan from a bank financing perspective, one needs to compare the operating profits vs. its financial debt obligations. Normally banks fund up to 3.0x Financial Debt/EBITDA, and values above either require a waiver or some additional guarantee/collateral in order to satisfy the risk department of the bank.
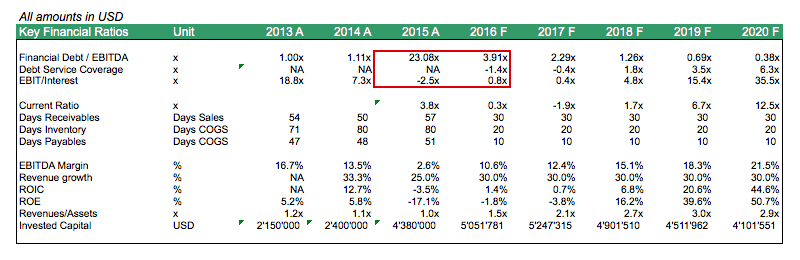
Above is a plan showing that more financial debt is used than the EBITDA justifies. One explanation could be that, e.g., the owner or the parent company had to provide a personal or corporate guarantee. This means the business cannot be valued as is. Still, the value of the required guarantee needs to be considered, and the valuation model should reflect the value of the business on a standalone basis without any need for additional guarantees or collateral. One way to solve this problem is to include the amount of the guarantees as required equity injection to bring Financial Debt/EBITDA ratios down to a more reasonable level.
(6) Depreciation Higher Than CAPEX in Terminal Value
One common mistake one can notice is that Depreciation is assumed to be higher than the Capital Expenditures (CAPEX) in the long run. This is illogical as the Fixed Asset Balance, which is increased by CAPEX and reduced by Depreciation, would become negative at some point if Depreciation is higher than CAPEX. Normally, CAPEX is set equal to Depreciation or slightly higher than Depreciation to account for the investment required to sustain future growth.
When Depreciation is higher than CAPEX in the terminal value, the DCF valuation model sends the wrong signal. It suggests the business is shrinking, not growing. This mistake undervalues the company by assuming assets are wearing out faster than they’re being replaced. A stable or growing business should reinvest at least as much as it depreciates. If not, the terminal value becomes flawed, dragging down the overall valuation and misleading investors.
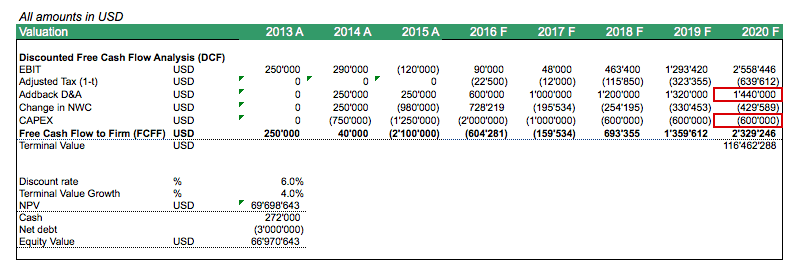
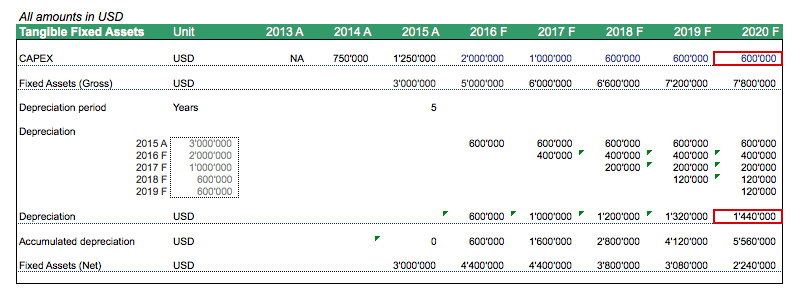
The above valuation and asset tables show a clear DCF modeling mistake: in 2020, depreciation is $1,440,000 while CAPEX is only $600,000. This gap signals the business is not reinvesting enough to maintain or grow its asset base. When depreciation outpaces CAPEX in terminal years, it suggests shrinking operations, which contradicts the growth assumption in terminal value. This mismatch distorts the free cash flow forecast and drags down the company’s valuation, leading to misleading results for investors.
(7) Unrealistic WACC – Discount Rate
Using an unrealistic discount rate is a major mistake in DCF valuation models because it distorts the true value of future cash flows. If the rate is too high, it undervalues the business by making future profits seem less valuable. If it’s too low, it inflates the valuation unrealistically. Analysts often ignore market conditions, company risk, or capital structure. A proper discount rate should reflect the company’s cost of capital and risk profile. Otherwise, the valuation loses credibility and can mislead investors or decision-makers.
The Weighted Average Cost of Capital (WACC) is one of the key value drivers in any DCF calculation as the discount rate. A higher WACC discounts future cash flows more than a lower WACC (present value gets higher). WACC is based on an opportunity cost calculation. The required return to convince an investor is to put their money into the company rather than investing in a company with a similar risk profile on the stock market. Thus, the WACC needs to compensate equity shareholders and lenders for the assumed risk, and therefore has two components:
- The Cost Of Debt can be determined by looking at a reasonable financing structure the company can use (Debt/Equity ratio) and by checking the debt financing costs. Today’s challenge is that the risk-free rates are very low, and bank financing is cheap in Europe and the US. So normally, we see the cost of debt before tax, between 3% and 6%, whereas the majority is the debt premium that the banks charge.
- Cost of equity equals the risk-free rate plus a market premium (ca. 4.5% – 6% for US and Europe, depending on source). The market risk premiums are multiplied by the company’s beta (risk factor concerning movements in the stock market). Additional premiums can be added if needed, especially if the company is highly dependent on a single key man (key man adjustment) or is small in size (Small Cap Premium).
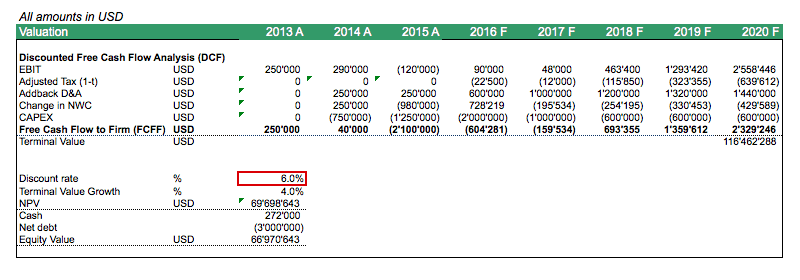
The chart above shows a WACC of only 6%, hardly compensating investors and lenders for the risks of a dynamic and growing company. Hence, the impact on the valuation is that the company’s value becomes overstated. See also an example WACC calculation here for a detailed calculation of the discount rate.
(8) Inflated Terminal Value
One of the biggest mistakes in a DCF valuation model is using an inflated terminal value. This happens when analysts assume overly optimistic growth rates or apply unrealistic multiples far into the future. The result? A terminal value that dominates the entire valuation, masking the real performance of the business. It gives investors a false sense of value and can lead to poor decisions. Terminal value is an estimate of what the company is worth in 5 years’ time, considering all future cash flows on a normalized level. To avoid this, always use conservative estimates and stress-test your assumptions. Any valuation would need to be tested by the market. As a quick check, one can simply compare the Enterprise Value (EV) to EBITDA ratio at the time of exit. Another solution can also be to extend the forecast period to 10 or 20 years instead of using a Terminal Value formula and model the cash flows more careful on a yearly basis.
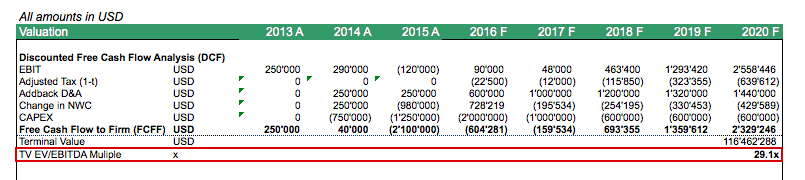
The above example shows a 29.1x EV/EBITDA multiple, which is way beyond any reasonable range (normally, an EV/EBITDA ratio is between 4.0x and 8.0x). Only some industries that show higher growth or are less capital-intensive manage to get higher EV/EBITDA valuation multiples. So, one should check the Terminal Value for the implied EV/EBITDA multiple.

In the above case, the estimation of Terminal Value uses a simple FCFF/(WACC-g formula (Free Cash Flows capitalized by the Discount rate minus the Terminal value growth rate). The netted capitalization rate, thus, is only 2%. This appears unrealistic. So, the solution might be to recheck for a reasonable WACC and use a lower growth rate so that when checking for the implied EV/EBITDA multiple, the multiple appears realistic.
(9) Pre-Valuation Cash Flows Included
Including pre-valuation cash flows in a DCF model is a major mistake because it inflates the business’s value. Discounted Free Cash (DCF) analysis means that only the future free cash flows should be considered in the valuation exercise. A DCF should only project future cash flows starting from the valuation date. If past or already-earned cash flows are added, it leads to double-counting and skews the model’s accuracy. This mistake gives a misleading picture of value and can result in poor investment decisions. Always start the forecast from today and exclude any historical cash flows to stay aligned with valuation best practices.
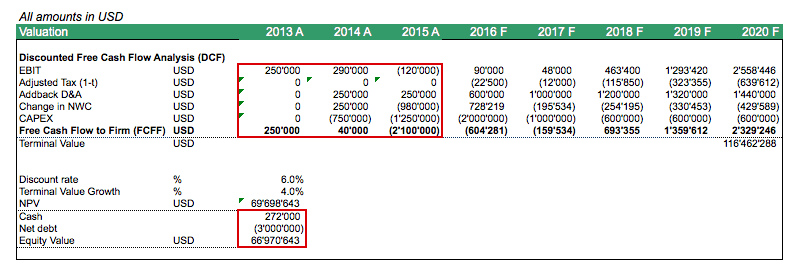
The example above also includes historic cash flows (2013 – 2015), which are not correct from a methodological point of view. If the valuation date is Dec. 31st, 2015, only cash flows from 2016 onwards should be considered. Each DCF valuation assumes a certain date. Thus, the financial model should ensure that only the future cash flows from that date are included in the company’s valuation.
(10) No Multiple Cross-Check
A DCF valuation should also be checked for its implied valuation multiples, mostly the implied EV/EBITDA multiple, and other multiples such as Price / Earnings (P/E) or Price to book (P/B) ratio. Those multiples should be compared to industry benchmarks based on publicly available data or recent transactions in that sector. Skipping multiple cross-checks in a DCF model is a big mistake. It means you rely only on projections, which can be wrong or too optimistic. A market-based multiple, like EV/EBITDA, helps check if your DCF value makes sense. Without it, you risk missing red flags or overvaluing the business. Always cross-check to stay grounded in market reality.
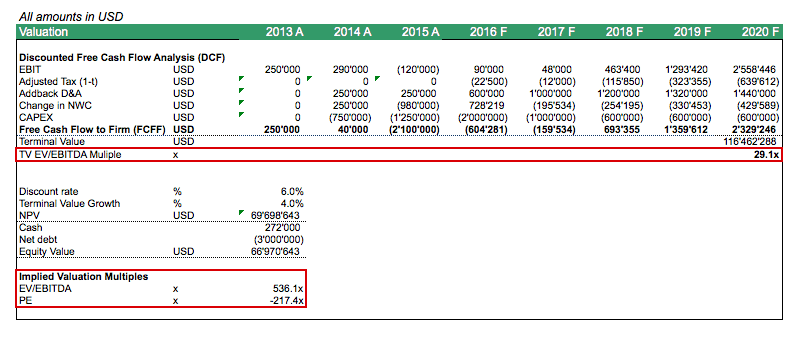
Above is another example that shows very high valuation multiples, raising the question of how realistic those multiples are when convincing an investor to pay their hard-earned money for that company under fair market conditions.
As always, it is important to review your financial model properly and look at the whole. The same with building a DCF model, there will be times when you missed certain details which will greatly affect the accuracy of the projections in your model.
Avoid Costly Errors with a Smarter DCF Valuation Model
Avoiding common mistakes in DCF valuation models is key to accurate financial forecasting. Errors like blending assumptions with calculations, skipping historical trends, or spiking Year 1 projections weaken credibility. Overly rosy long-term forecasts, unrealistic discount rates, and ignoring funding needs distort value. Including pre-valuation cash flows or relying too much on terminal value misleads investors. Even small oversights—like depreciation outpacing CAPEX—can signal poor logic. Always double-check with valuation multiples to stay grounded.
Avoid costly errors by using smarter DCF models built to guide you. Our Free DCF Valuation Model helps you start with clean logic and a clear structure. Our Advanced DCF Model adds depth with tested formulas, realistic assumptions, and built-in cross-checks. Both templates reduce guesswork, flag risks, and help you focus on what drives value. Let these tools do the heavy lifting—so your valuation stays sharp, reliable, and investor-ready.
No Downloads found
You Might Also Like:
- 10 Tips to Develop a First Class Business Valuation Report
- 10 Main Elements of a Business Plan
- 12 BUSINESS VALUATION METHODS
- Understanding the Levelized Cost of Energy Formula
- Calculating Revenue Growth Rate: A Key Metric for Business Success
- Real Estate Financial Modeling in Excel
- How to Value a Business Using a Discounted Cash Flow Model
- Financial Valuation Service
- How to Prepare a Financial Feasibility Study?
- Finding the Balance in Your Optimal Capital Structure
- Top 5 Tips For a Good Financial Due Diligence
- Ten Ways to Estimate Terminal Value in DCF
- Financial Model Templates Easy to Use
- How to Create a Business Plan for your Food Truck Business
- Business Valuation
- Forecasting Sales Using Product Life Cycle
- How to Start a Distillery Business: What You Need to Know?
- Developing a 5 Year Financial Projection Template
- How to Request for Custom Financial Models
- Commercial Real Estate Valuation Methods: Helping Investors in Taking Informed Decisions


