
0 ITEMS

Top 5 Tips For a Good Financial Due Diligence

Financial due diligence (FDD) is a critical step in M&A transactions and fundraising, focusing on deeper financial insights beyond standard audits.
- It aims to provide a clear understanding of a target company’s revenue streams, profitability, and key financial metrics.
- The process involves analyzing historical performance, adjusting for normalization, and assessing forecast feasibility.
- A structured approach, including step-by-step phases like data gathering, analysis, and report writing, ensures thorough coverage.
- Visual tools like bridges charts help illustrate the drivers behind changes in EBITDA and other key indicators over time.
- Following best practices like comparing points in time and organizing findings logically enhances report clarity and decision-making.
This article guides you through effective methods and best practices to conduct comprehensive financial due diligence.
1 – The Financial Due Diligence Engagement Process
Every process is different, but the following structure is quite common amongst Financial Due Diligence engagement within the Big 4. Think of it as a Financial Due Diligence Checklist is a step-by-step process.
- Pre-Assignment preparation
- Information and document gathering
- Exploratory analysis phase
- 1st Management Q&A
- Advanced analysis phase and report structuring
- Additional Management Q&A sessions
- Report writing
- Gathering of findings from other departments working on the project
- Completion of Report first draft and review from Partner
- Report shared with clients and feedback processed

The Financial Due Diligence services process would be expected to last from 3 weeks for small companies up to 6 weeks for more significant engagements. However, from time to time, especially when working on a Vendor Due Diligence, engagements can last several months (and more exceptionally, several years!)
2 – Methodically Follow the Natural Flow of the P&L
A challenging part of Financial Due Diligence is to know where to start, especially for younger, less experienced analysts.
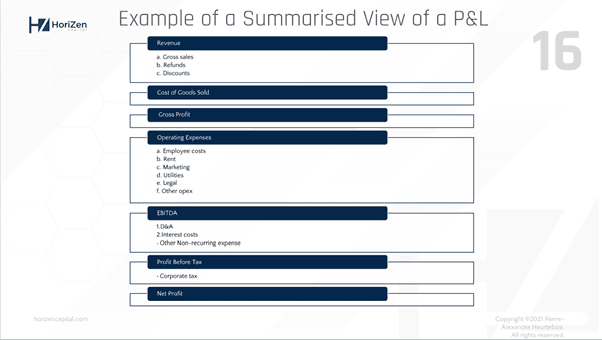
By following the flow of the P&L, it becomes easier to structure your approach and make sure that you do not forget an essential piece to review.
Schematically, a P&L structure will look more or less like the following for every business. You will have to fine-tune the following and adapt it to the specificities of the business you are doing financial due diligence on.
Before diving into each row of the P&L, I recommend starting your analysis with a high-level overview.
You can lay out the P&L in a format that makes it easy to read and start familiarizing yourself with the high-level trends of the business.
Best practice recommends that you add a year on year movement for each line of the P&L along with some typical profitability KPIs
- Gross Profit %
- EBITDA %
- EBIT %
- Average Revenue per customer (if available)
- Any other relevant KPIs that are specific to the business under review
An example is shown below:

3 – Bridges Charts are Your Best Friends
Bridges are a classic within the consultant world. Bridges are the main kind of charts that TS teams use. I have never seen a report without a few bridges in it.
What does a bridge do? It takes two points in time, A and B, showing how the company went from point A to point B. In other words, in many situations, to represent the key drivers of a stage change visually, we can use the bridge.
The most common bridge used in Transaction Services and financial due diligence services is Gross Profit and EBITDA bridge. It allows the reader to quickly grasp the essential elements impacting a business and helps you summarize your findings.
A few examples of bridges that you can create:
- Revenue Bridge by the primary category (by country/by-product / by industry etc.)
- EBITDA bridge showing each main component of the P&L, ie. Revenue change, COGS change, and details of OPEX change
- Gross profit bridge showing the Margin effect and the Volume Effect (see dedicated section)
- Price Volume Mix analysis
- EBITDA bridge where main events explain changes in EBITDA (e.g., Christmas sales, Black Friday, Covid impact, etc.)
An EBITDA bridge can look as follows.

We can see clearly from this chart the breakdown of the movement of the EBITDA between 3 points in time, we showed the whole movement of OPEX for each year, and we can see for each year the EBITDA margin.
This information is usually crucial for the reader and can be easily seen and memorized based on the presentation above.
4 – Always Use Different Points in Time for Comparison
When you analyze the P&L or metrics of a company, look at the numbers from different perspectives.
To do so, you can ask yourself the following questions:
- How does that performance compare to last month?
- How does that performance compare to the same month last year?
- How does the movement of a specific cost compare to the movement of the top line? (e.g., COGS growing 15% YoY while revenue only increased 10%)
- How significant is the impact of a specific item in the grand scheme of things? (eg. Mail cost increased 400% vs. last year but only represented 0.1% of total costs)
- Do I expect a particular cost line to be variable or fixed by nature, and is it reflected in the change between two periods?
- How does seasonality impact the numbers in the specific month under review?
5 – Financial Due Diligence Report Structuring
Presenting your findings in a structured and transparent manner is as important – maybe more – than all the analyses that you can perform.
The typical structure of a financial Due Diligence report will look as follows:

Conclusion
With the above, you should be better armed to start your Financial Due Diligence engagement. If you apply a strict structure and organization to your process, you should be in an excellent position not to miss any critical details that the investor or buyer needs to know. Then you have to gather all the information you need and do the analyses that you consider helpful to your engagement.
The key in any Financial Due Diligence process is to tie all the different parts and conclusions together to form a general view of the business and help investors feel comfortable enough to make their own decision.
To help you build your own due diligence report, here is a ready-made financial model template for Due Diligence P&L Exhaustive Revenue and Costs Analysis.
Feel free to check out our other Due Diligence Tools and Checklist here:











































This article was written by Pierre-Alexandre Huertebize, one of our vendors here at eFinancialModels. You can find all his financial model templates and contact him here: Pierre-Alexandre Huertebize
You might also like:
- 10 Main Elements of a Business Plan
- 10 Tips to Develop a First Class Business Valuation Report
- All About Financial Modeling for Project Finance
- 14 Best Practices in Financial Modeling
- 5 Practical Tips to Help Raise Funds For Startups
- Top 10 Mistakes in DCF Valuation Models
- Financial Modeling for Startups and Small Businesses
- How to Prepare a Financial Feasibility Study?
- Understanding the Debt Service Coverage Ratio: An Essential Metric for Financial Analysis
- Finding Fair Market Value: A Quick Guide to Real Estate Valuation
- Business Plan Models – Using Business Models as Examples
- Boost Your Business’s Financial Management with this Excel Budget Template
- How to Build a Capitalization Table
- How to Calculate Net Present Value (NPV)?
- Financial Statements – Definition, Uses, Contents and Templates
- How to Start a Distillery Business: What You Need to Know?
- Commercial Real Estate Valuation Methods: Helping Investors in Taking Informed Decisions
- Top 5 Risks of Wind Energy Parks
- Financial Ratios Analysis and Its Importance
- Financial Model Templates Easy to Use
