
0 ITEMS

14 Best Practices in Financial Modeling (2026)

Financial models in Excel are essential tools for analyzing business performance and supporting strategic decisions. Whether you’re forecasting profitability for a new venture, evaluating an acquisition, or planning a major expansion, the quality of your model directly impacts the quality of your decisions.
The difference between a trusted model and a liability often comes down to following proven best practices:
- Cash flow projections help you forecast profitability under different scenarios and identify potential cash crunches before they happen.
- Sensitivity analysis reveals which assumptions truly drive your outcomes and where risks lie.
- Clear structure and organization, with assumptions separated and hardcoding eliminated, make your model transparent and auditable.
- Consistent formatting and automatic error checks prevent mistakes from compounding and make updates seamless.
- Well-defined terms ensure everyone, from analysts to executives, understands your model.
These aren’t just technical niceties; they’re the foundation of smart, data-driven decision-making. Master these practices, and you’ll build models that forecast outcomes accurately, allocate resources efficiently, and reduce uncertainty in even the most complex projects.
What is Financial Modeling in Excel?
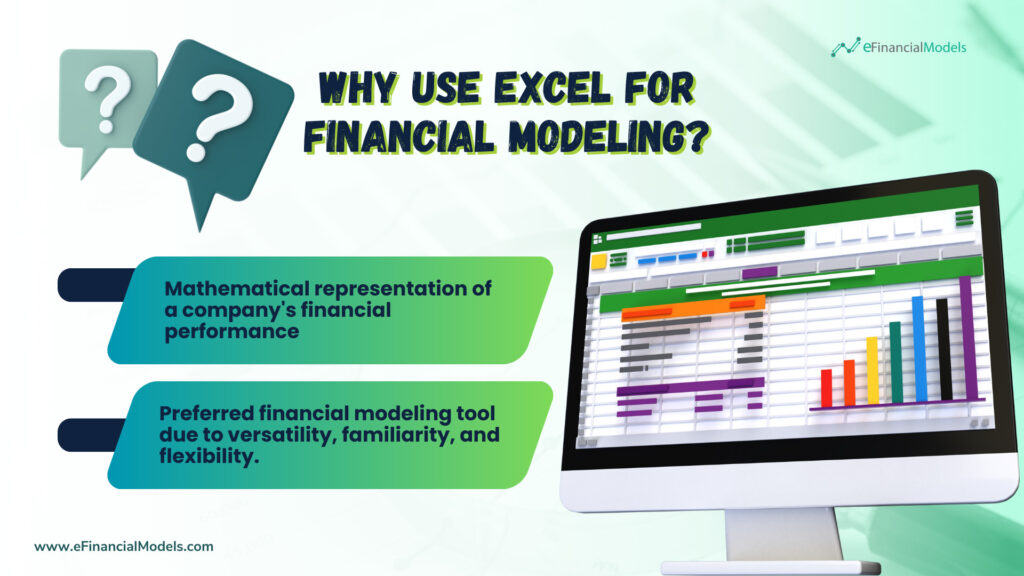
Financial modeling in Excel refers to creating a mathematical representation of a company’s financial performance. A financial model often incorporates historical data, financial assumptions, and forecasts, enabling businesses to evaluate their current situation and predict future outcomes. Financial analysts, investors, and business owners prefer Excel-based financial modeling because it offers versatility for creating a range of models, including discounted cash flow (DCF), valuation, and budgeting tools. These models are used to assess potential investments, determine project viability, and support strategic decision-making, providing a structured yet flexible way to analyze complex financial situations.
Excel stands out over other financial modeling tools for its versatility, familiarity, and flexibility. Unlike specialized software, Excel provides a customizable environment in which financial models can be tailored to specific business needs without rigid constraints. The widespread use of financial modeling in Excel means most professionals are already familiar with its interface and functions, helping reduce training costs and facilitating collaboration. Excel’s advanced functions, built-in formulas, and seamless data integration make it an ideal tool for financial analysis. Its adaptability to various tasks, cost-effectiveness, and control over data manipulation make it a preferred choice for financial professionals compared to other, less flexible or more expensive tools.
Creating Financial Models in Excel: 14 Expert Best Practices
Creating financial models in Excel requires a blend of structure, clarity, and accuracy. However, certain best practices in financial modeling stand out as universally beneficial. They are guiding principles that can make your financial models more efficient, reliable, and easier to understand. Below are 14 best practices for creating financial models in Excel that are easy to understand and use.
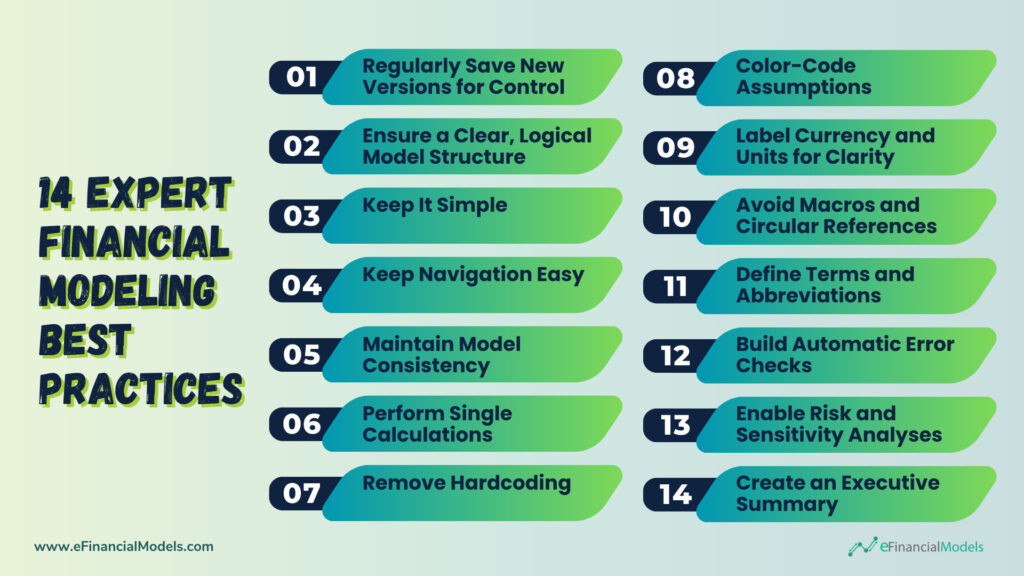
- Regularly Save New Versions for Control: To track the model’s development and progress, it is recommended that the Excel model be saved systematically under a new version number. Also, sometimes, Excel models do crash. Therefore, it is critical that a model be saved at least every half day under a new version to avoid a complete loss of work if the model breaks.
- Ensure a Clear, Logical Model Structure: Finance models should be built logically. Calculations should be performed from left to right and top to bottom to be intuitive to users. Try to organize your modeling sections modularly, apply clear headers or titles, and organize the sections in a clear, understandable, logical structure. For instance, assumptions are the prerequisite to building the operating model; therefore, they should come first. If the user has to repeatedly go through the Excel model to backtrack and refer to different parts of the pages, it will create more confusion and cause them to lose track of their direction. Therefore, logic and structure are key to allowing for a smooth understanding!
- Keep It Simple: Creating financial models in Excel should be as simple as possible (less is more) with an adequate number of worksheets and calculations. Applying precise and consistent logic is key as well. Try to focus on the essential aspects and the key value drivers. Sometimes, too much detail is counterproductive. Minimize the number of rows to make the model easier for users to understand. A concrete example is a three-statement model. Add the statements to a single worksheet.
- Keep Navigation Easy: Allow for easy model navigation. Establish a clear navigation structure by using appropriate labels for all worksheets and sections of your model. The objective is for the user to orient himself and find the relevant sections quickly without having to redo all the financial modeling Excel work.
- Maintain Model Consistency: If you have several sheets that project cash flows from year 1 to year 10, ensure year 1 always starts in the same column on all sheets. This way, it will be easier to check the model and copy/paste formulas from one sheet to another if needed.
- Perform Single Calculations: Each calculation should be performed only once. Since the financial model is in Excel, if you need a calculation, try calculating it once and linking all dependent cells to it. If your calculation is wrong or you wish to change it afterward, you will have to change it only once, and the change will be applied consistently throughout your model.
- Remove Hardcoding: This is a common mistake in many beginner models. Remove hardcoded figures in calculation cells. If you have a calculation cell, e.g., with the formula =0.04 * D2, move the 0.04 to a separate assumption cell, which you can use to perform the desired calculation. This will add more transparency to the model and avoid surprises afterward.
- Color-Code Assumptions for Easy Identification: Financial models are easier to understand when you visually separate input cells from output cells. All inputs should be placed in separate cells and marked with a different font color, e.g., blue, while calculations should be in black (or any other color you prefer). Another point here is to identify the sources of your assumptions to make it very clear where they come from. Therefore, the financial model becomes much more readable and understandable.
- Label Currency and Units For Clarity: State the currency and units – Consistency is important. Every figure in your model must be clear, whether that is a dollar (currency) amount, a volume unit, a price, or something else. Therefore, you need to make the unit very clear and easy to understand. For volume units, a good way to make it clear what unit is referred to is to put the unit abbreviation at the beginning of the row in Excel.
- Avoid Macros and Circular References: On this point, not everybody might agree with us, but here is our point: Macros do not work on all computers, and most users will not understand how they work; therefore, they’re a black box. Thus, if you intend to use a macro, try to clarify why the macro is needed and if there is no solution to model the same without a macro. Regarding circular references, some financial modelers, e.g., use an iteration calculation to compute interest on excess cash to model cash flows correctly. However, while this might be more precise, the model will show a circular reference. Therefore, determining whether the model is correct and conducting a sensitivity analysis becomes challenging.
- Define Terms and Abbreviations: Financial models normally use a series of abbreviations, e.g., NPV (Net Present Value) and DCF (Discounted Cash Flow), which might not be easily understandable by the reader. To make your Excel modeling easier to understand, add a terms and abbreviations section somewhere for easy user reference.
- Build Automatic Error Checks: Build automatic error checks into your model; e.g., a balance sheet must show that total assets equal total equity and liabilities. Therefore, you can build in an automatic check that there is a zero difference in your balance sheet. Suppose that the examination shows anything other than zero. In that case, it will tell you to recheck your calculations and lead you to the source of error (using the detective/audit function in Excel).
- Enable Risk and Sensitivity Analyses: The model should allow us to assess the risks inherent in the business by changing key assumptions and observing how the model reacts to those changes. Enabling risk and sensitivity analysis helps identify how changes in key assumptions impact the business, providing insights into potential risks and areas for adjustment.
- Create an Executive Summary: Build a dashboard with charts in the form of an Executive Summary so users can quickly grasp the essence of your model. It is recommended that the key outputs, key financials, and assumptions be summarized on an executive summary page (max 1 – 2 pages). This should help grasp the model’s essentials in a single page.
Your Next Step in Financial Modeling Excellence Awaits
With this list, we hope to help you save time and offer additional ideas for creating financial models in Excel, along with best practices to consider when building them. A solid grasp of these 14 best practices in financial modelling is key to building accurate, reliable models. By organizing data clearly, maintaining consistency, simplifying calculations, and frequently checking for errors, you ensure your model serves as a dependable decision-making tool.
Now that you’ve mastered these best practices, it’s time to put them into action. Start by applying these principles to your next financial model and refine your skills with each iteration. Remember, the goal is to create models that are both insightful and easy to understand. Apply these 14 best practices, and you’ll be well-prepared to deliver financial insights that drive smarter business decisions.
























































You might also like:
- 10 Ideas to Increase Average Revenue Per User
- 10 Main Elements of a Business Plan
- 14 Best Practices in Financial Modeling
- 5 Best Practices for Managing Days Receivables
- 5 Practical Tips to Help Raise Funds For Startups
- Cash Flow Analysis in Excel
- Financial Modeling for Startups and Small Businesses
- Financial Ratios Analysis and Its Importance
- Business Valuation Service
- 10-Step Financial Planning Checklist for Smart Executives
- How to Build a Capitalization Table
- Excel Template using the RANK Function in Excel
- How to Value a Business Using a Discounted Cash Flow Model
- Real Estate Financial Modeling in Excel
- Finding a Valuation Model for Your Business
- Understanding What is Yield to Maturity and Why It Matters
- Budget Template in Excel – Analysis in 4 Steps
- Financial Spreadsheet – A Key Tool for Entrepreneurs
- Understanding the Key Differences Between Levered and Unlevered Free Cash Flow
- Commercial Real Estate Valuation Methods: Helping Investors in Taking Informed Decisions


Great tips!
I saw some that I had not really considered before. Would put them to practice right away.
Thanks!